
Vertiv (VRT)
Vertiv sets the gold standard. Its fast revenue growth, profitability, and exceptional prospects make it a spectacular asset.― StockStory Analyst Team
1. News


2. Summary
Why We Like Vertiv
Formerly part of Emerson Electric, Vertiv (NYSE:VRT) manufactures and services infrastructure technology products for data centers and communication networks.
- Annual revenue growth of 18.5% over the last five years was superb and indicates its market share increased during this cycle
- Incremental sales over the last five years have been highly profitable as its earnings per share increased by 39.3% annually, topping its revenue gains
- Market share is on track to rise over the next 12 months as its 33.3% projected revenue growth implies demand will accelerate from its two-year trend


Vertiv is a top-tier company. No coincidence the stock is up 1,228% over the last five years.
Is Now The Time To Buy Vertiv?


Vertiv’s stock price of $270.43 implies a valuation ratio of 43.1x forward P/E. The premium valuation means there’s much good news priced into the stock - we certainly can’t argue with that.
Are you a fan of the business model? If so, you can own a smaller position, as high-quality companies tend to outperform the market over a long-term period regardless of entry price.
3. Vertiv (VRT) Research Report: Q4 CY2025 Update
Data center products and services company Vertiv (NYSE:VRT) met Wall Street’s revenue expectations in Q4 CY2025, with sales up 22.7% year on year to $2.88 billion. The company expects next quarter’s revenue to be around $2.6 billion, coming in 1.9% above analysts’ estimates. Its non-GAAP profit of $1.36 per share was 4.9% above analysts’ consensus estimates.
Vertiv (VRT) Q4 CY2025 Highlights:
- Revenue: $2.88 billion vs analyst estimates of $2.88 billion (22.7% year-on-year growth, in line)
- Adjusted EPS: $1.36 vs analyst estimates of $1.30 (4.9% beat)
- Revenue Guidance for Q1 CY2026 is $2.6 billion at the midpoint, above analyst estimates of $2.55 billion
- Adjusted EPS guidance for the upcoming financial year 2026 is $6.02 at the midpoint, beating analyst estimates by 12.9%
- Operating Margin: 20.1%, in line with the same quarter last year
- Free Cash Flow Margin: 31.6%, up from 15.4% in the same quarter last year
- Organic Revenue rose 19.3% year on year (miss)
- Market Capitalization: $76.32 billion
Company Overview
Formerly part of Emerson Electric, Vertiv (NYSE:VRT) manufactures and services infrastructure technology products for data centers and communication networks.
Data centers and communication networks are the infrastructure that gives us the global connectivity we have today. These data centers and communication networks need to be built with parts and must be serviced – that’s where companies like Vertiv come in.
Vertiv designs and manufactures the parts that build infrastructure, which include the protective structures, called racks, that hold sensitive wirings and computing equipment together while maintaining the necessary cooling and humidity. It also provides sophisticated power supplies, like power distribution units, that supply the right amount of power to data centers and make sure they can keep going when their main power source fails.
The company generates revenue through the sale of its hardware products, the associated software needed to manage and monitor the data centers, and maintenance and support services. It sells mostly to data center operators, telecommunications companies, and entities needing secure IT infrastructure, such as the government and banks.
4. Electrical Systems
Like many equipment and component manufacturers, electrical systems companies are buoyed by secular trends such as connectivity and industrial automation. More specific pockets of strong demand include Internet of Things (IoT) connectivity and the 5G telecom upgrade cycle, which can benefit companies whose cables and conduits fit those needs. But like the broader industrials sector, these companies are also at the whim of economic cycles. Interest rates, for example, can greatly impact projects that drive demand for these products.
Companies with similar offerings as Vertiv include Eaton (NYSE:ETN), Emerson Electric (NYSE:EMR), and Schneider Electric (EPA:SU)
5. Revenue Growth
A company’s long-term performance is an indicator of its overall quality. Any business can put up a good quarter or two, but the best consistently grow over the long haul. Thankfully, Vertiv’s 18.5% annualized revenue growth over the last five years was incredible. Its growth surpassed the average industrials company and shows its offerings resonate with customers, a great starting point for our analysis.
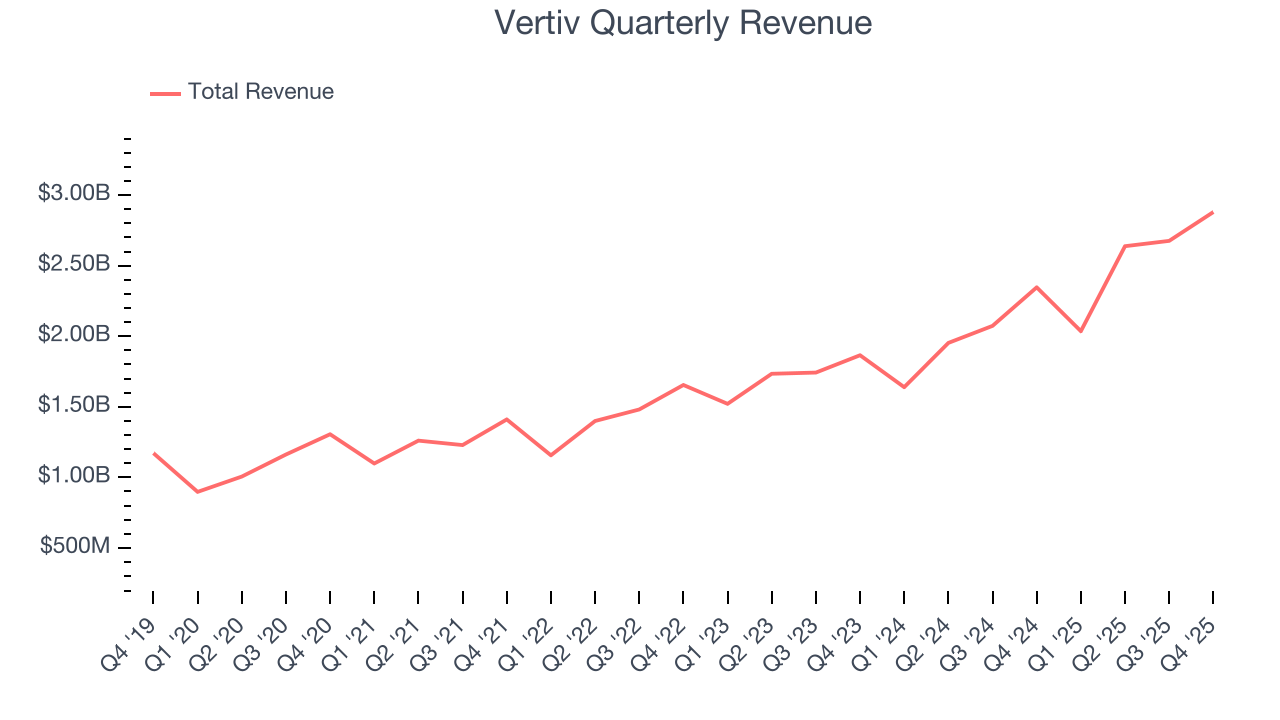
Long-term growth is the most important, but within industrials, a half-decade historical view may miss new industry trends or demand cycles. Vertiv’s annualized revenue growth of 22.1% over the last two years is above its five-year trend, suggesting its demand was strong and recently accelerated. 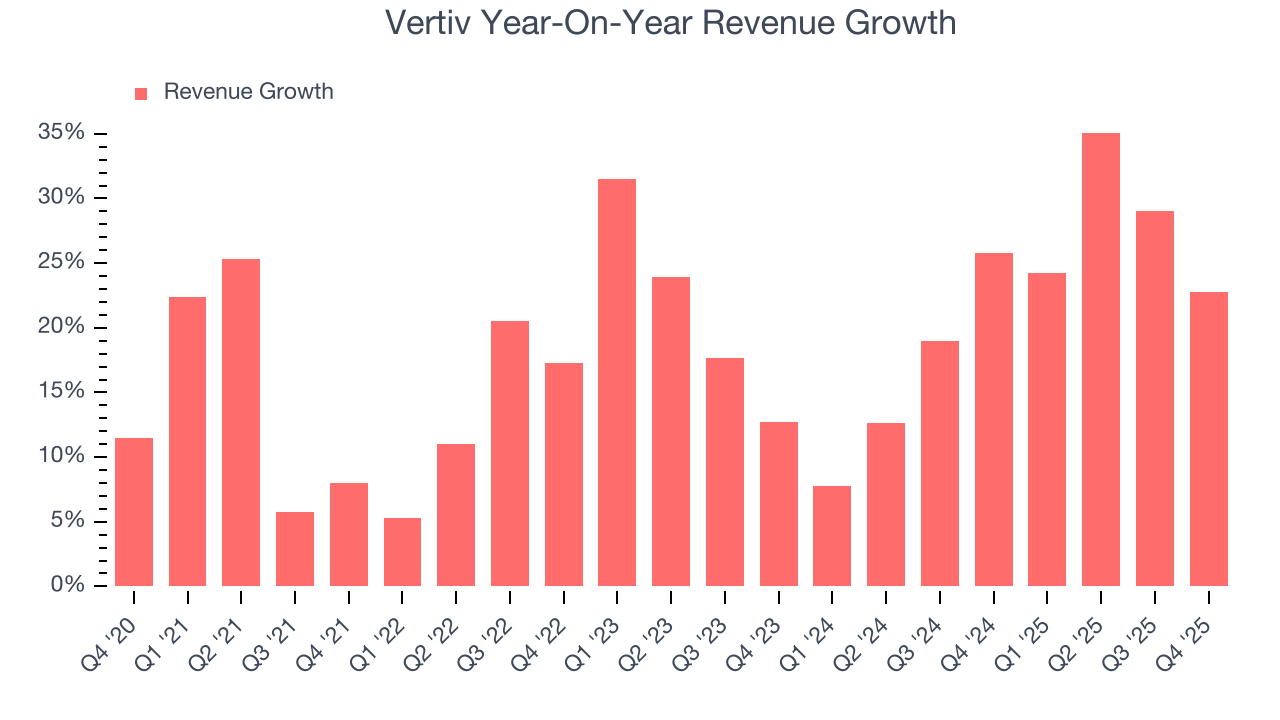
We can better understand the company’s sales dynamics by analyzing its organic revenue, which strips out one-time events like acquisitions and currency fluctuations that don’t accurately reflect its fundamentals. Over the last two years, Vertiv’s organic revenue averaged 21.9% year-on-year growth. Because this number aligns with its two-year revenue growth, we can see the company’s core operations (not acquisitions and divestitures) drove most of its results. 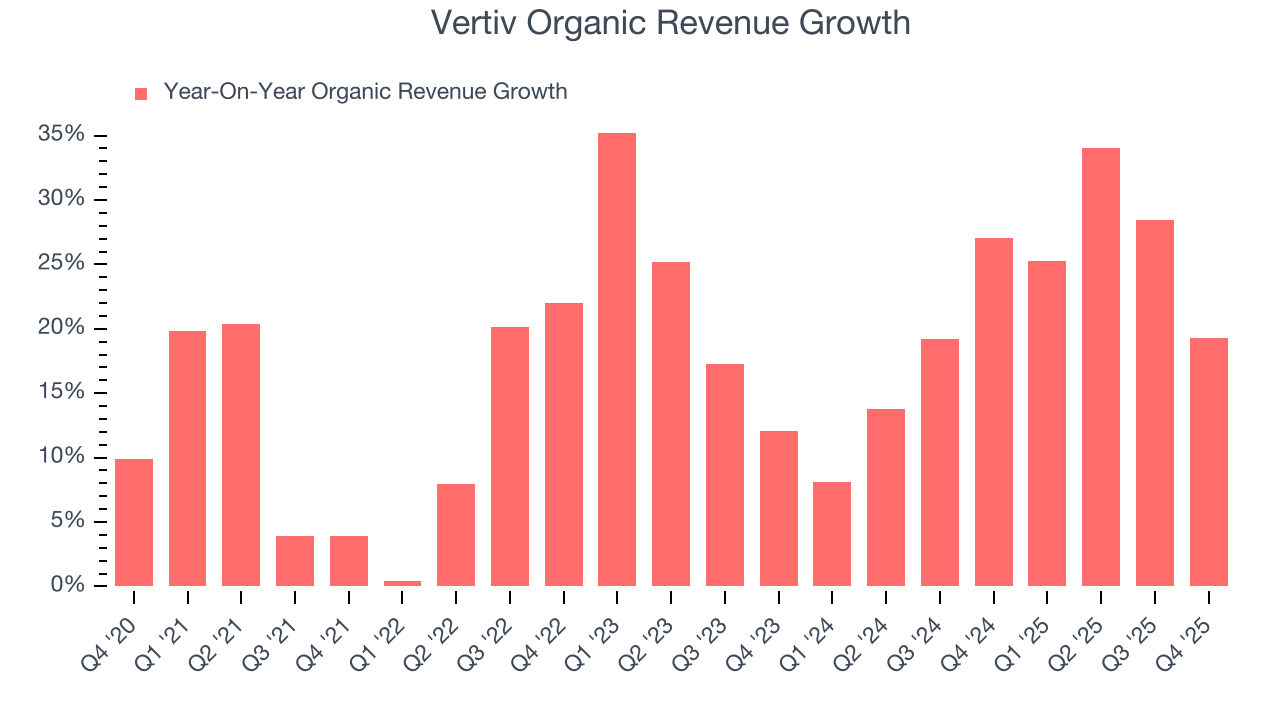
This quarter, Vertiv’s year-on-year revenue growth of 22.7% was excellent, and its $2.88 billion of revenue was in line with Wall Street’s estimates. Company management is currently guiding for a 27.7% year-on-year increase in sales next quarter.
Looking further ahead, sell-side analysts expect revenue to grow 22% over the next 12 months, similar to its two-year rate. This projection is eye-popping for a company of its scale and implies the market sees success for its products and services.
6. Gross Margin & Pricing Power
Vertiv’s gross margin is good compared to other industrials businesses and signals it sells differentiated products, not commodities. As you can see below, it averaged an impressive 34.1% gross margin over the last five years. That means for every $100 in revenue, roughly $34.05 was left to spend on selling, marketing, R&D, and general administrative overhead. 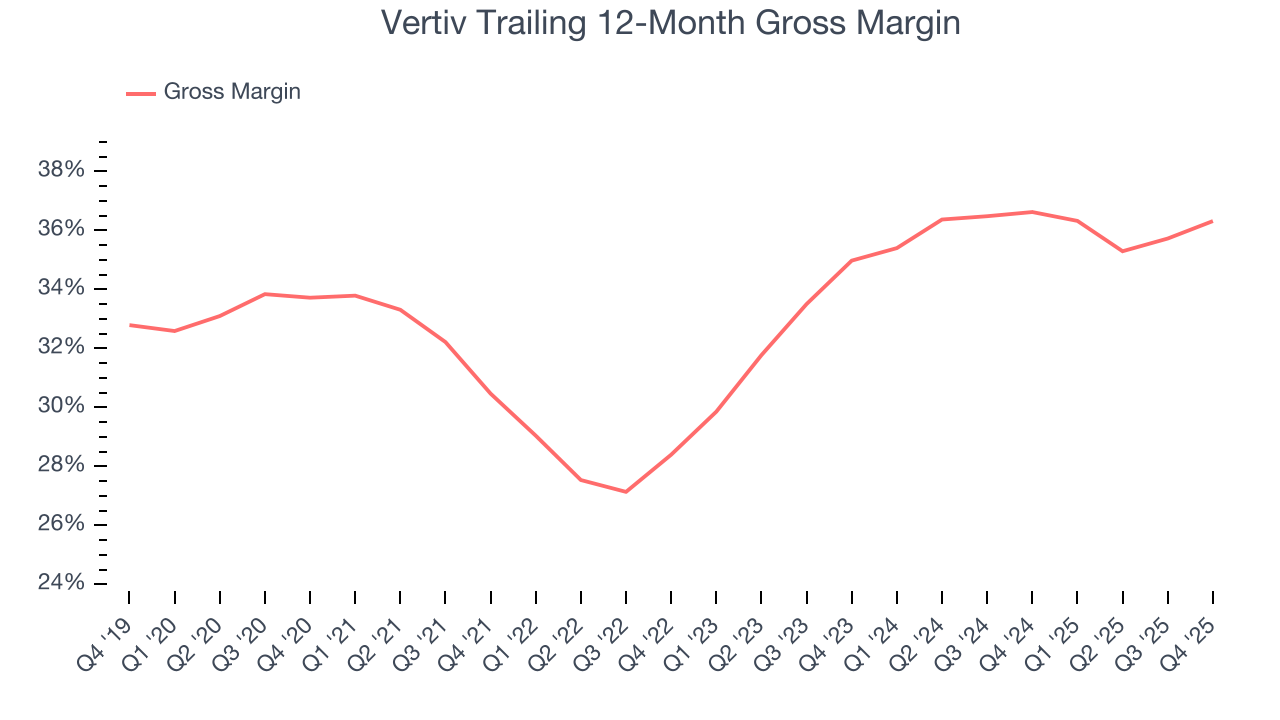
This quarter, Vertiv’s gross profit margin was 38.9%, up 1.9 percentage points year on year. Zooming out, the company’s full-year margin has remained steady over the past 12 months, suggesting its input costs (such as raw materials and manufacturing expenses) have been stable and it isn’t under pressure to lower prices.
7. Operating Margin
Vertiv has been an efficient company over the last five years. It was one of the more profitable businesses in the industrials sector, boasting an average operating margin of 12.7%. This result isn’t too surprising as its gross margin gives it a favorable starting point.
Looking at the trend in its profitability, Vertiv’s operating margin rose by 12.7 percentage points over the last five years, as its sales growth gave it immense operating leverage.
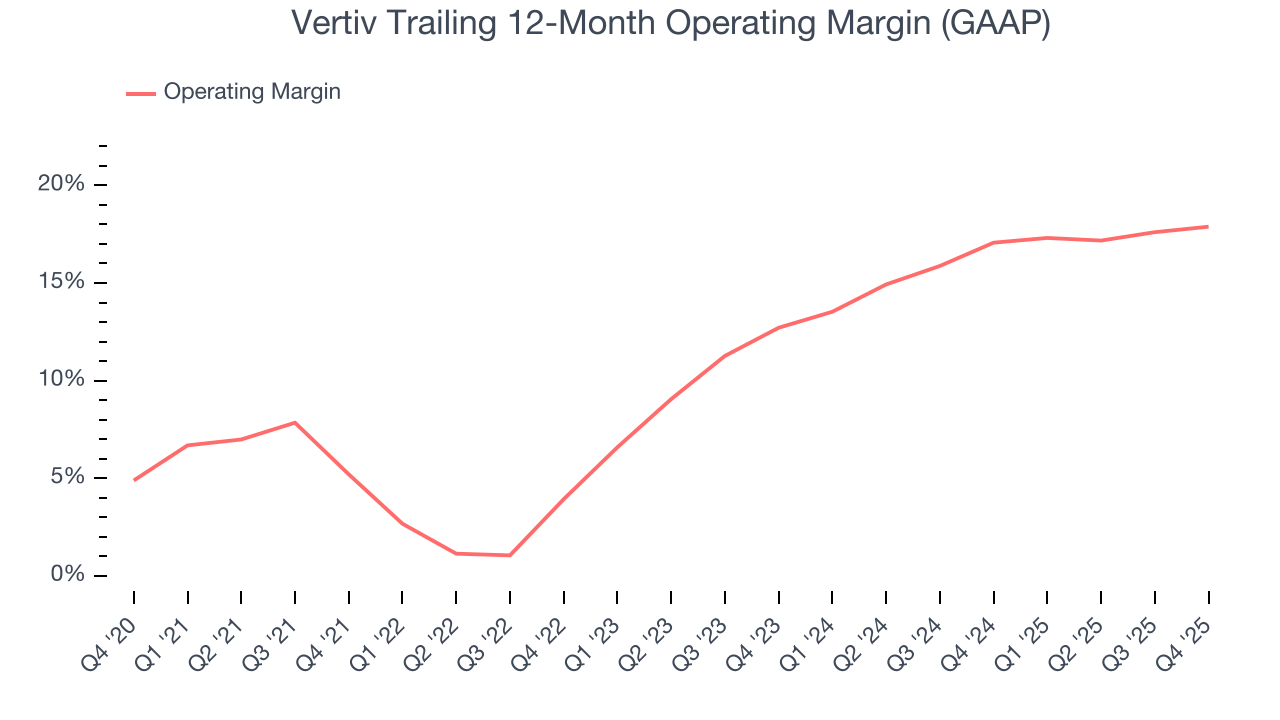
This quarter, Vertiv generated an operating margin profit margin of 20.1%, in line with the same quarter last year. This indicates the company’s cost structure has recently been stable.
8. Earnings Per Share
Revenue trends explain a company’s historical growth, but the long-term change in earnings per share (EPS) points to the profitability of that growth – for example, a company could inflate its sales through excessive spending on advertising and promotions.
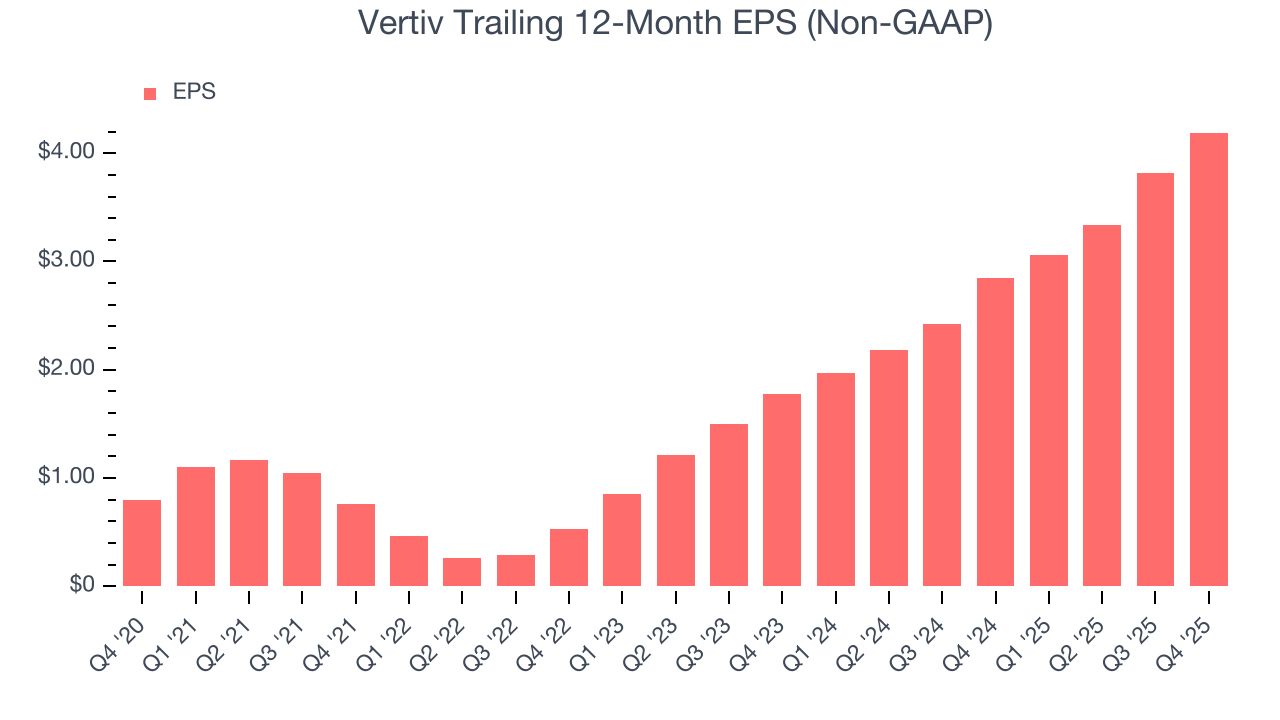
Vertiv’s EPS grew at an astounding 39.3% compounded annual growth rate over the last five years, higher than its 18.5% annualized revenue growth. This tells us the company became more profitable on a per-share basis as it expanded.
Diving into the nuances of Vertiv’s earnings can give us a better understanding of its performance. As we mentioned earlier, Vertiv’s operating margin was flat this quarter but expanded by 12.7 percentage points over the last five years. This was the most relevant factor (aside from the revenue impact) behind its higher earnings; interest expenses and taxes can also affect EPS but don’t tell us as much about a company’s fundamentals.
Like with revenue, we analyze EPS over a more recent period because it can provide insight into an emerging theme or development for the business.
For Vertiv, its two-year annual EPS growth of 53.4% was higher than its five-year trend. We love it when earnings growth accelerates, especially when it accelerates off an already high base.
In Q4, Vertiv reported adjusted EPS of $1.36, up from $0.99 in the same quarter last year. This print beat analysts’ estimates by 4.9%. Over the next 12 months, Wall Street expects Vertiv’s full-year EPS of $4.19 to grow 29.5%.
9. Cash Is King
Although earnings are undoubtedly valuable for assessing company performance, we believe cash is king because you can’t use accounting profits to pay the bills.
Vertiv has shown robust cash profitability, enabling it to comfortably ride out cyclical downturns while investing in plenty of new offerings and returning capital to investors. The company’s free cash flow margin averaged 10.3% over the last five years, quite impressive for an industrials business.
Taking a step back, we can see that Vertiv’s margin expanded by 16 percentage points during that time. This is encouraging, and we can see it became a less capital-intensive business because its free cash flow profitability rose more than its operating profitability.
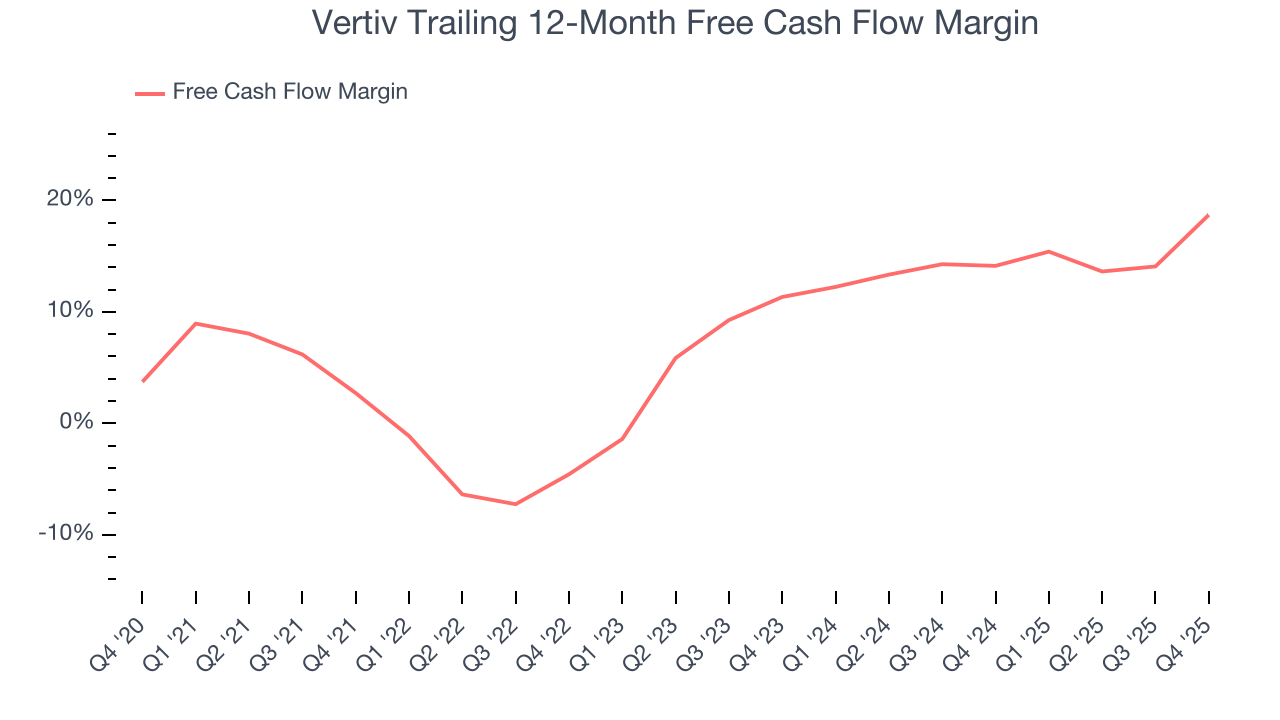
Vertiv’s free cash flow clocked in at $909.9 million in Q4, equivalent to a 31.6% margin. This result was good as its margin was 16.2 percentage points higher than in the same quarter last year, building on its favorable historical trend.
10. Return on Invested Capital (ROIC)
EPS and free cash flow tell us whether a company was profitable while growing its revenue. But was it capital-efficient? Enter ROIC, a metric showing how much operating profit a company generates relative to the money it has raised (debt and equity).
Vertiv’s five-year average ROIC was 16.2%, beating other industrials companies by a wide margin. This illustrates its management team’s ability to invest in attractive growth opportunities and produce tangible results for shareholders.
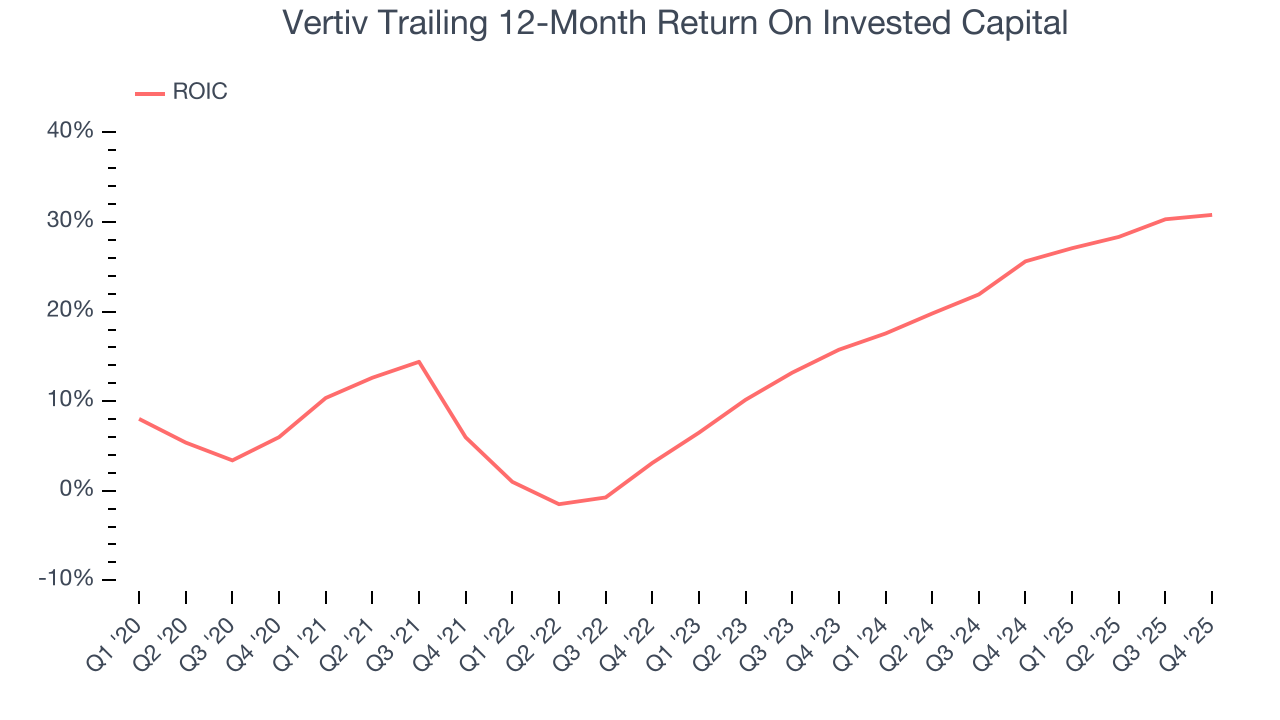
We like to invest in businesses with high returns, but the trend in a company’s ROIC is what often surprises the market and moves the stock price. Vertiv’s ROIC has increased significantly over the last few years. This is a great sign when paired with its already strong returns. It could suggest its competitive advantage or profitable growth opportunities are expanding.
11. Balance Sheet Assessment
Vertiv reported $1.73 billion of cash and $2.91 billion of debt on its balance sheet in the most recent quarter. As investors in high-quality companies, we primarily focus on two things: 1) that a company’s debt level isn’t too high and 2) that its interest payments are not excessively burdening the business.
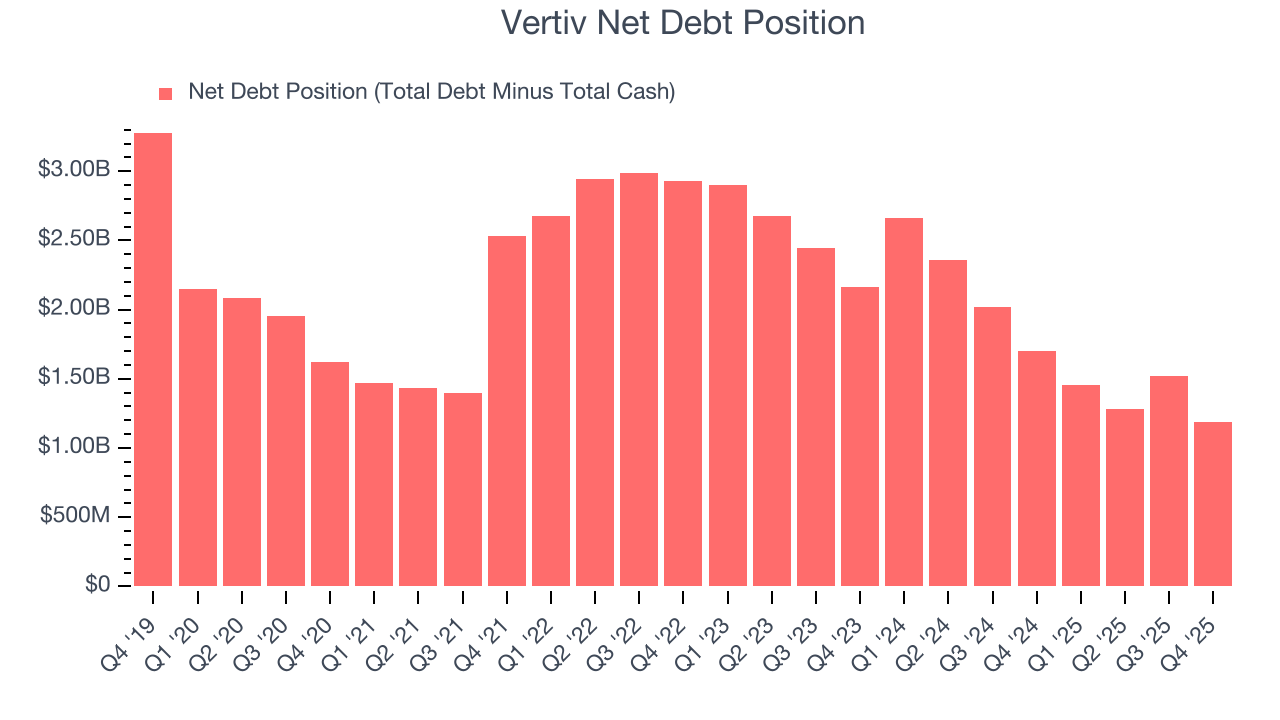
With $2.19 billion of EBITDA over the last 12 months, we view Vertiv’s 0.5× net-debt-to-EBITDA ratio as safe. We also see its $86.1 million of annual interest expenses as appropriate. The company’s profits give it plenty of breathing room, allowing it to continue investing in growth initiatives.
12. Key Takeaways from Vertiv’s Q4 Results
We were impressed by Vertiv’s optimistic full-year EPS guidance, which blew past analysts’ expectations. We were also glad its full-year revenue guidance trumped Wall Street’s estimates. On the other hand, its organic revenue slightly missed. Overall, we think this was a good quarter with some key metrics above expectations. The stock traded up 14.3% to $228.10 immediately following the results.
13. Is Now The Time To Buy Vertiv?
Updated: March 19, 2026 at 10:04 PM EDT
A common mistake we notice when investors are deciding whether to buy a stock or not is that they simply look at the latest earnings results. Business quality and valuation matter more, so we urge you to understand these dynamics as well.
Vertiv is a cream-of-the-crop industrials company. For starters, its revenue growth was exceptional over the last five years and is expected to accelerate over the next 12 months. On top of that, its organic revenue growth has been marvelous, and its rising cash profitability gives it more optionality.
Vertiv’s P/E ratio based on the next 12 months is 43.1x. There’s no doubt it’s a bit of a market darling given the lofty multiple, but we don’t mind owning an elite business, even if it’s expensive. Investments like this should be held patiently for at least three to five years as they benefit from the power of long-term compounding, which more than makes up for any short-term price volatility that comes with high valuations.
Wall Street analysts have a consensus one-year price target of $267.83 on the company (compared to the current share price of $270.43).