
Webster Financial (WBS)
We’re cautious of Webster Financial. Its decelerating revenue growth and even worse EPS performance give us little confidence it can beat the market.― StockStory Analyst Team
1. News


2. Summary
Why Webster Financial Is Not Exciting
Founded during the Great Depression in 1935 and evolving into a major Northeastern financial institution, Webster Financial (NYSE:WBS) is a bank holding company that provides commercial banking, consumer banking, and employee benefits solutions through its Webster Bank and HSA Bank division.
- Estimated net interest income decline of 8.3% for the next 12 months implies a challenging demand environment
- Efficiency ratio is expected to worsen by 2.4 percentage points over the next year
- A bright spot is that its market share has increased this cycle as its 26.3% annual net interest income growth over the last five years was exceptional


Webster Financial falls short of our quality standards. You should search for better opportunities.
Why There Are Better Opportunities Than Webster Financial


At $67.44 per share, Webster Financial trades at 1.1x forward P/B. While valuation is appropriate for the quality you get, we’re still not buyers.
There are stocks out there similarly priced with better business quality. We prefer owning these.
3. Webster Financial (WBS) Research Report: Q4 CY2025 Update
Regional banking company Webster Financial (NYSE:WBS) reported Q4 CY2025 results beating Wall Street’s revenue expectations, with sales up 3.9% year on year to $746.2 million. Its GAAP profit of $1.55 per share was 0.9% above analysts’ consensus estimates.
Webster Financial (WBS) Q4 CY2025 Highlights:
- Net Interest Income: $632.9 million vs analyst estimates of $633.1 million (4% year-on-year growth, in line)
- Net Interest Margin: 3.4% vs analyst estimates of 3.3% (2.3 basis point beat)
- Revenue: $746.2 million vs analyst estimates of $729.2 million (3.9% year-on-year growth, 2.3% beat)
- Efficiency Ratio: 47% vs analyst estimates of 48.4% (146 basis point beat)
- EPS (GAAP): $1.55 vs analyst estimates of $1.54 (0.9% beat)
- Tangible Book Value per Share: $37.20 vs analyst estimates of $37.40 (12.9% year-on-year growth, 0.5% miss)
- Market Capitalization: $10.68 billion
Company Overview
Founded during the Great Depression in 1935 and evolving into a major Northeastern financial institution, Webster Financial (NYSE:WBS) is a bank holding company that provides commercial banking, consumer banking, and employee benefits solutions through its Webster Bank and HSA Bank division.
Webster Financial operates through three main business segments: Commercial Banking, HSA Bank, and Consumer Banking. The Commercial Banking segment serves businesses with revenues exceeding $2 million, offering specialized services like commercial real estate financing, equipment leasing, asset-based lending, and treasury management. This segment caters to diverse sectors including manufacturing, healthcare, technology, and public institutions.
The HSA Bank division is a standout component of Webster's business model, providing health savings accounts and other consumer-directed healthcare solutions nationwide. These accounts allow individuals with high-deductible health plans to save for medical expenses with tax advantages. This division generates stable, low-cost deposits that help fund the bank's lending activities while reducing reliance on wholesale funding.
In Consumer Banking, Webster maintains a network of banking centers throughout southern New England and the New York metropolitan area, complemented by digital banking channels. This segment offers traditional retail banking products including checking and savings accounts, residential mortgages, home equity lines, and credit cards. It also serves small businesses with annual revenues under $2 million.
Webster has expanded its capabilities through strategic acquisitions, including interLINK, a deposit management platform that facilitates FDIC-insured cash sweeps between banks and brokers, and Ametros, which administers medical funds from insurance settlements. These acquisitions have enhanced Webster's deposit-gathering capabilities and diversified its revenue streams beyond traditional banking.
4. Regional Banks
Regional banks, financial institutions operating within specific geographic areas, serve as intermediaries between local depositors and borrowers. They benefit from rising interest rates that improve net interest margins (the difference between loan yields and deposit costs), digital transformation reducing operational expenses, and local economic growth driving loan demand. However, these banks face headwinds from fintech competition, deposit outflows to higher-yielding alternatives, credit deterioration (increasing loan defaults) during economic slowdowns, and regulatory compliance costs. Recent concerns about regional bank stability following high-profile failures and significant commercial real estate exposure present additional challenges.
Webster Financial competes with other regional banks in the Northeast such as Citizens Financial Group (NYSE:CFG), M&T Bank (NYSE:MTB), and KeyCorp (NYSE:KEY), as well as national banks like JPMorgan Chase (NYSE:JPM) and Bank of America (NYSE:BAC). In the HSA space, its competitors include HealthEquity (NASDAQ:HQY) and Optum Bank, a UnitedHealth Group (NYSE:UNH) subsidiary.
5. Sales Growth
Two primary revenue streams drive bank earnings. While net interest income, which is earned by charging higher rates on loans than paid on deposits, forms the foundation, fee-based services across banking, credit, wealth management, and trading operations provide additional income. Over the last five years, Webster Financial grew its revenue at an exceptional 19.7% compounded annual growth rate. Its growth beat the average banking company and shows its offerings resonate with customers.
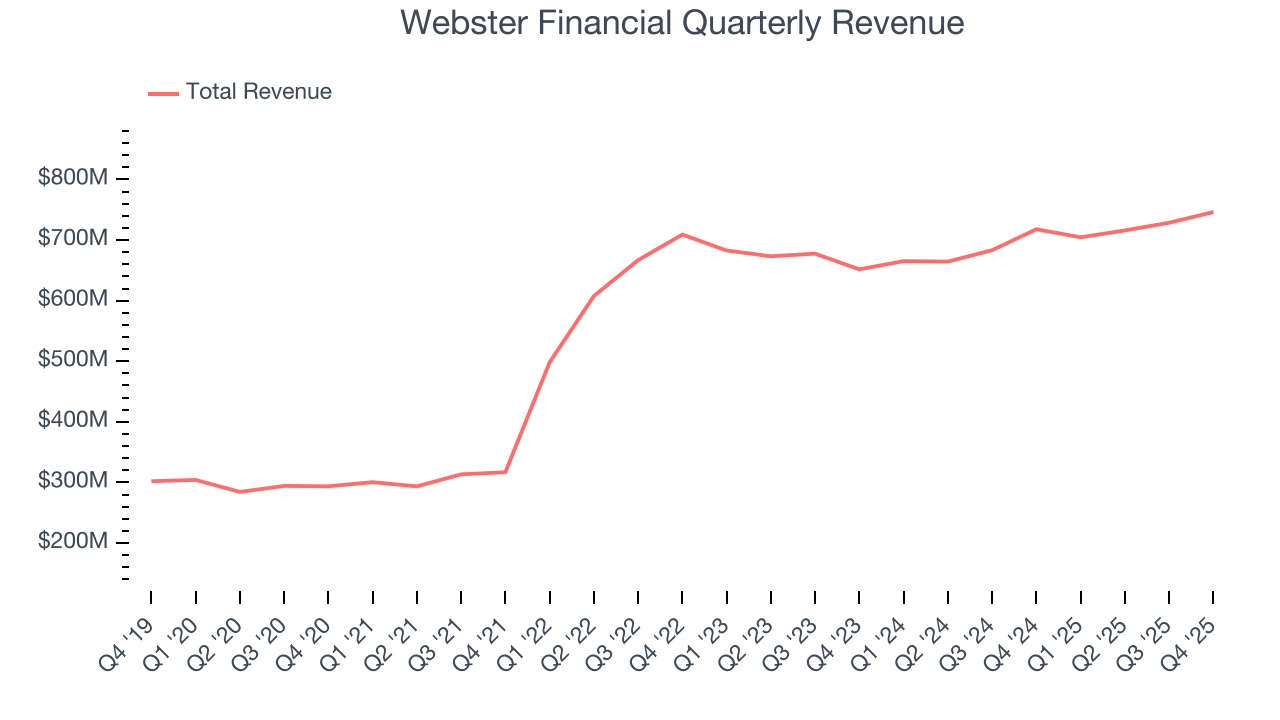
Long-term growth is the most important, but within financials, a half-decade historical view may miss recent interest rate changes and market returns. Webster Financial’s recent performance shows its demand has slowed significantly as its annualized revenue growth of 3.8% over the last two years was well below its five-year trend. 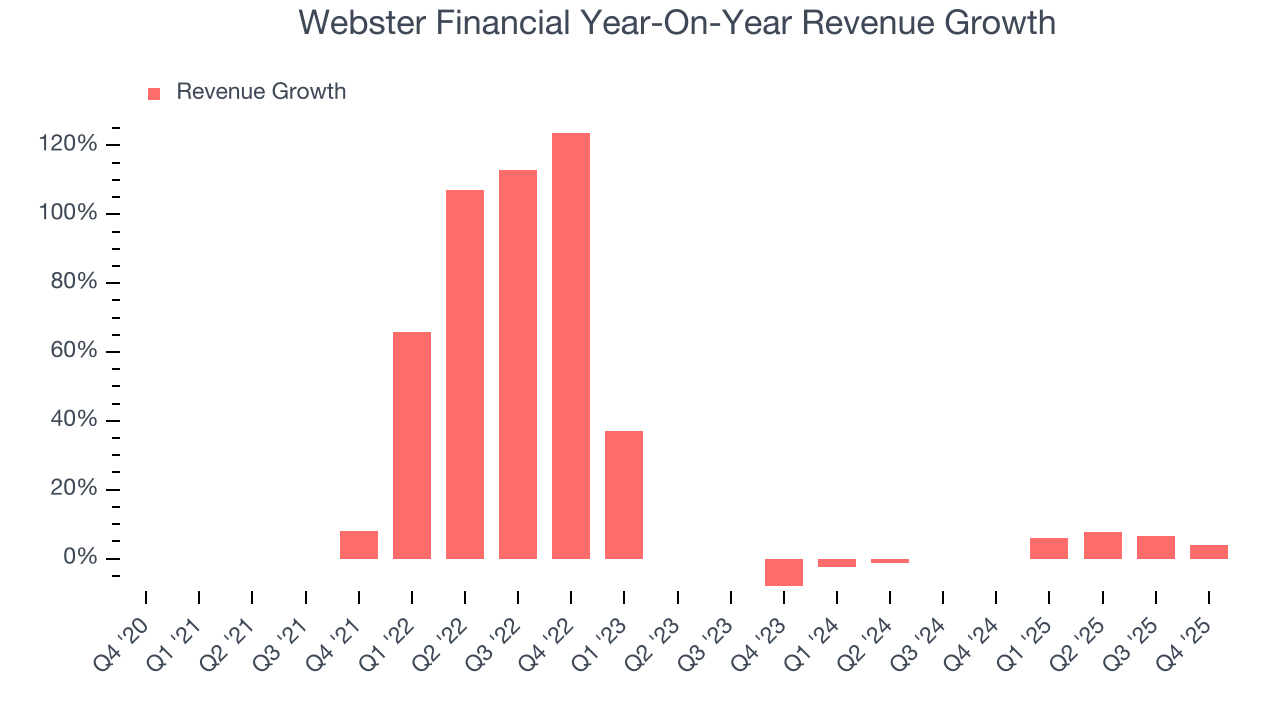 Note: Quarters not shown were determined to be outliers, impacted by outsized investment gains/losses that are not indicative of the recurring fundamentals of the business.
This quarter, Webster Financial reported modest year-on-year revenue growth of 3.9% but beat Wall Street’s estimates by 2.3%.
Net interest income made up 82.9% of the company’s total revenue during the last five years, meaning Webster Financial barely relies on non-interest income to drive its overall growth.
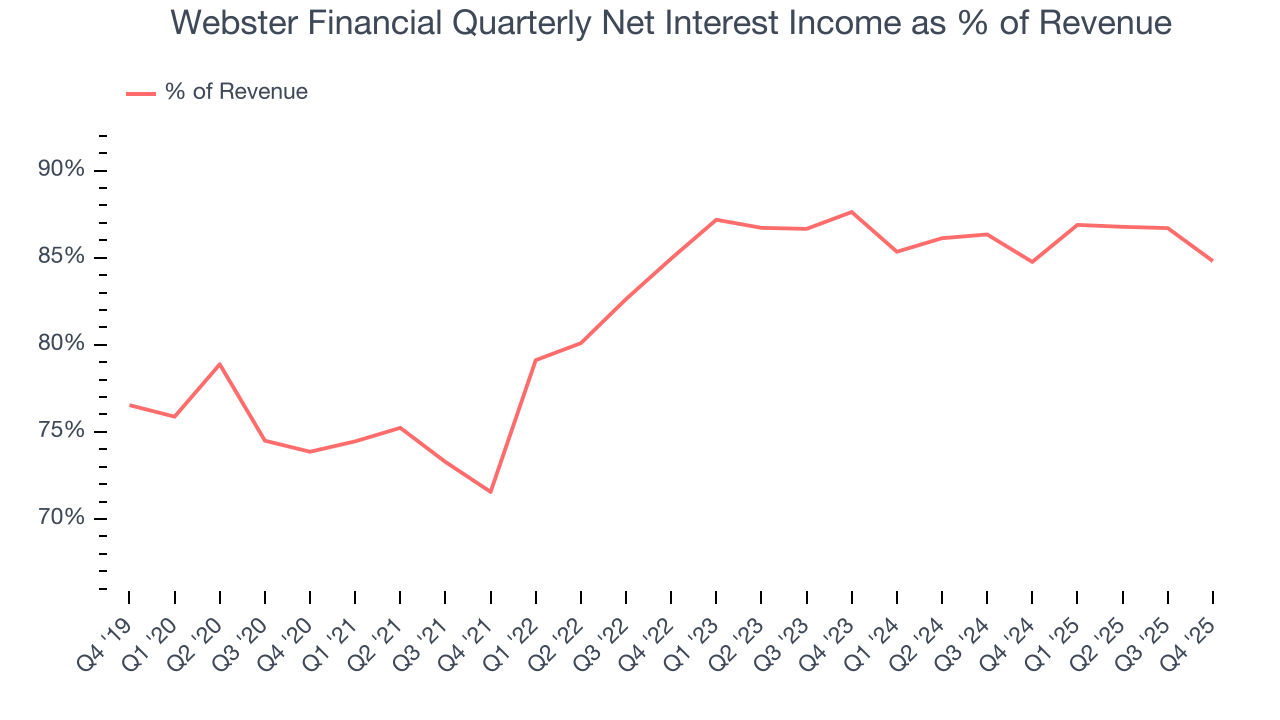
While banks generate revenue from multiple sources, investors view net interest income as the cornerstone - its predictable, recurring characteristics stand in sharp contrast to the volatility of non-interest income.
6. Efficiency Ratio
Topline growth alone doesn't tell the complete story - the profitability of that growth shapes actual earnings impact. Banks track this dynamic through efficiency ratios, which compare non-interest expenses such as personnel, rent, IT, and marketing costs to total revenue streams.
Investors place greater emphasis on efficiency ratio movements than absolute values, understanding that expense structures reflect revenue mix variations. Lower ratios represent better operational performance since they show banks generating more revenue per dollar of expense.
Over the last five years, Webster Financial’s efficiency ratio has swelled by 13.4 percentage points, going from 56.6% to 46%. Said differently, the company’s expenses have grown at a slower rate than revenue, which typically signals prudent management.
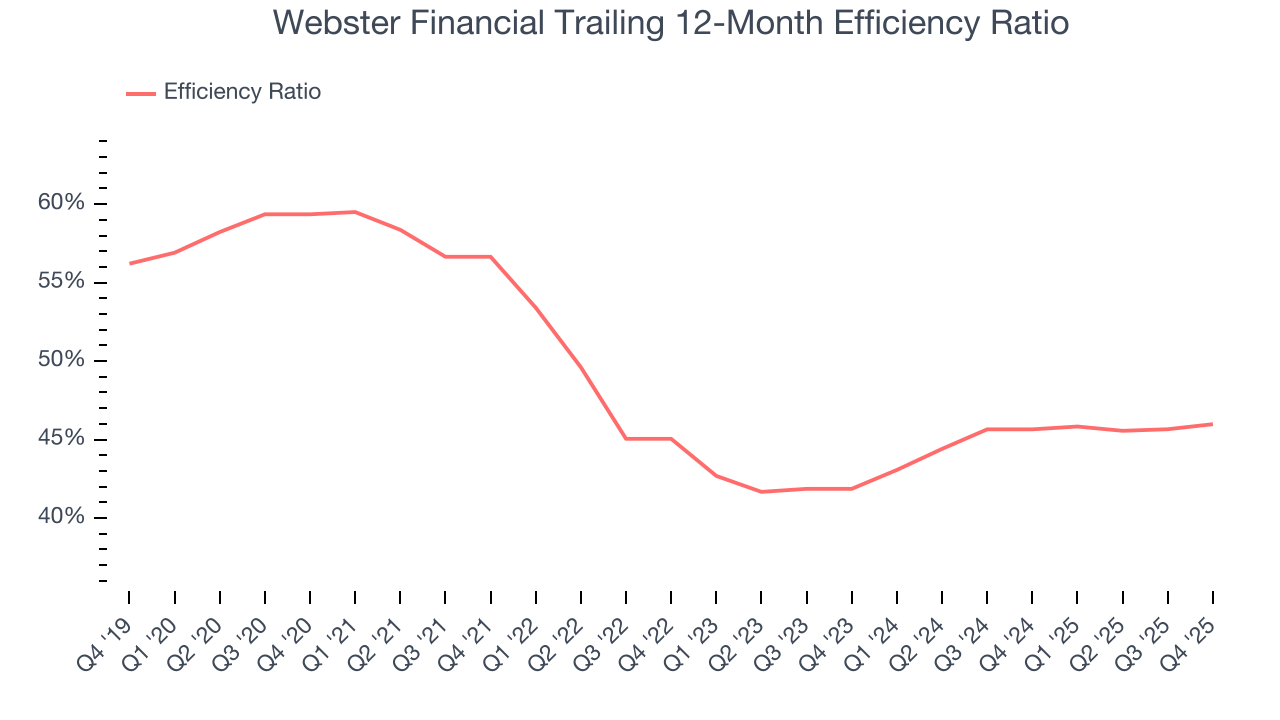
In Q4, Webster Financial’s efficiency ratio was 47%, beating analysts’ expectations by 146 basis points (100 basis points = 1 percentage point).
For the next 12 months, Wall Street expects Webster Financial to become less profitable as it anticipates an efficiency ratio of 48.3%.
7. Earnings Per Share
We track the long-term change in earnings per share (EPS) for the same reason as long-term revenue growth. Compared to revenue, however, EPS highlights whether a company’s growth is profitable.
Webster Financial’s astounding 20.3% annual EPS growth over the last five years aligns with its revenue performance. This tells us it maintained its per-share profitability as it expanded.
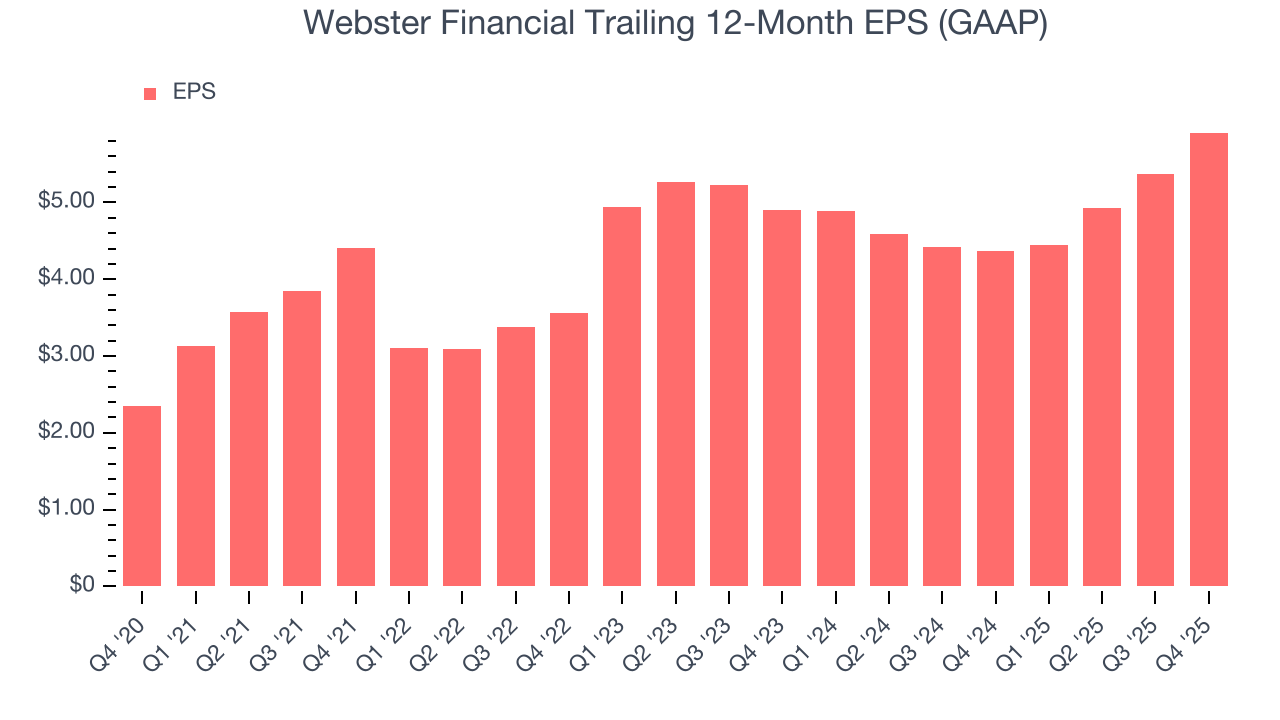
Like with revenue, we analyze EPS over a more recent period because it can provide insight into an emerging theme or development for the business.
Although it wasn’t great, Webster Financial’s two-year annual EPS growth of 9.9% topped its 3.8% two-year revenue growth.
We can take a deeper look into Webster Financial’s earnings to better understand the drivers of its performance. A two-year view shows that Webster Financial has repurchased its stock, shrinking its share count by 5.9%. This tells us its EPS outperformed its revenue not because of increased operational efficiency but financial engineering, as buybacks boost per share earnings. 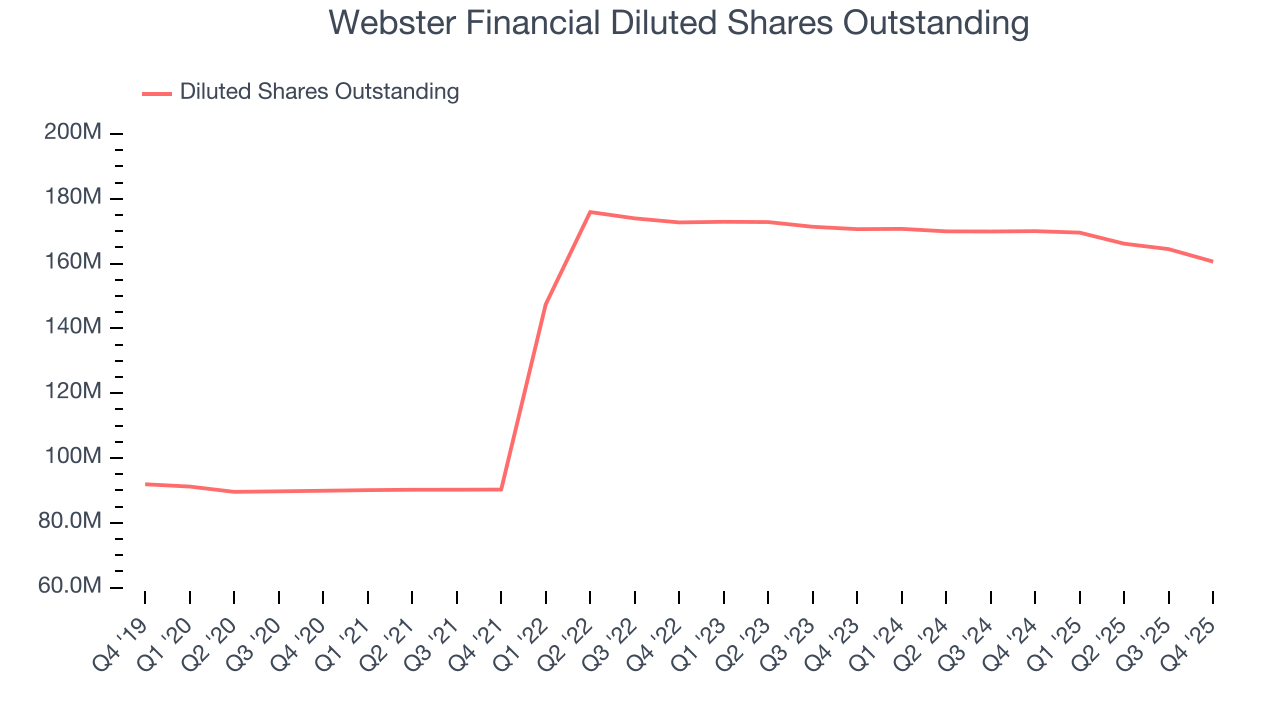
In Q4, Webster Financial reported EPS of $1.55, up from $1.01 in the same quarter last year. This print was close to analysts’ estimates. Over the next 12 months, Wall Street expects Webster Financial’s full-year EPS of $5.91 to grow 11.3%.
8. Tangible Book Value Per Share (TBVPS)
The balance sheet drives banking profitability since earnings flow from the spread between borrowing and lending rates. As such, valuations for these companies concentrate on capital strength and sustainable equity accumulation potential.
This is why we consider tangible book value per share (TBVPS) the most important metric to track for banks. TBVPS represents the real, liquid net worth per share of a bank, excluding intangible assets that have debatable value upon liquidation. Other (and more commonly known) per-share metrics like EPS can sometimes be murky due to M&A or accounting rules allowing for loan losses to be spread out.
Webster Financial’s TBVPS grew at a decent 5.8% annual clip over the last five years. TBVPS growth has accelerated recently, growing by 7.2% annually over the last two years from $32.39 to $37.20 per share.
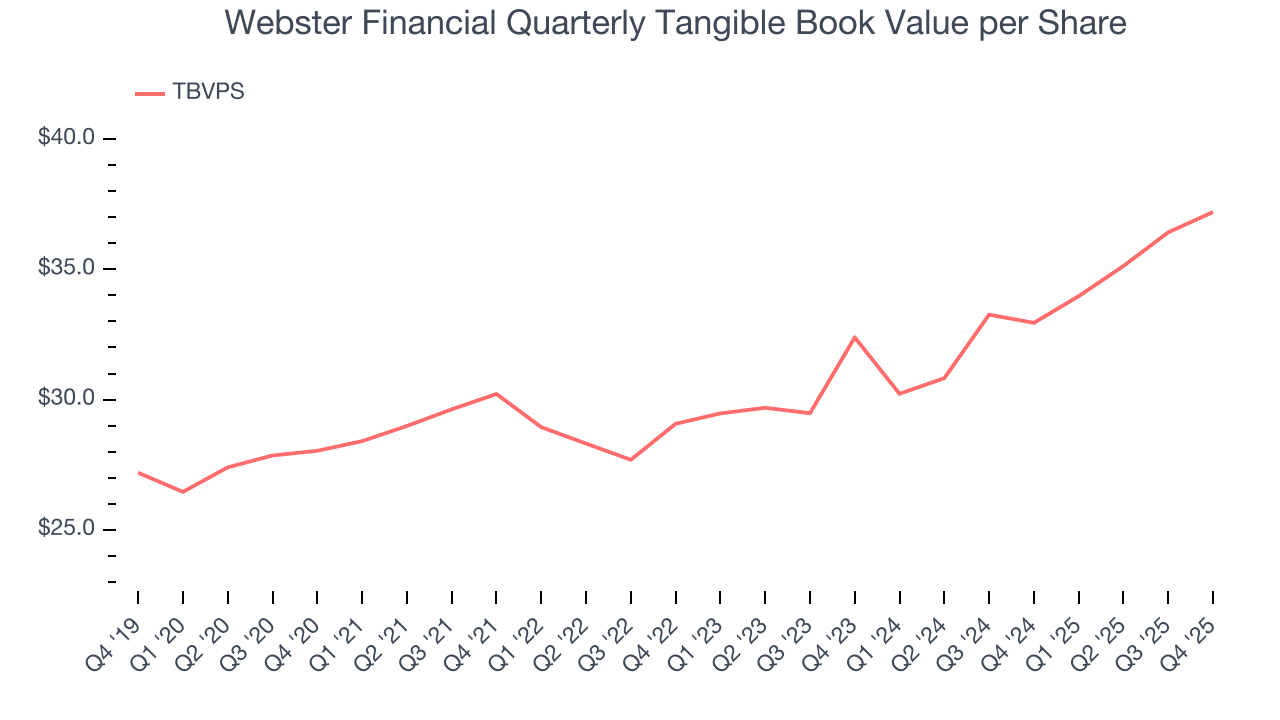
Over the next 12 months, Consensus estimates call for Webster Financial’s TBVPS to grow by 12% to $41.66, mediocre growth rate.
9. Balance Sheet Assessment
Leverage is core to a financial firm’s business model (loans funded by deposits). To ensure economic stability and avoid a repeat of the 2008 GFC, regulators require certain levels of capital and liquidity, focusing on the Tier 1 capital ratio.
Tier 1 capital is the highest-quality capital that a firm holds, consisting primarily of common stock and retained earnings, but also physical gold. It serves as the primary cushion against losses and is the first line of defense in times of financial distress.
This capital is divided by risk-weighted assets to derive the Tier 1 capital ratio. Risk-weighted means that cash and US treasury securities are assigned little risk while unsecured consumer loans and equity investments get much higher risk weights, for example.
New regulation after the 2008 financial crisis requires that all firms must maintain a Tier 1 capital ratio greater than 4.5%. On top of this, there are additional buffers based on scale, risk profile, and other regulatory classifications, so that at the end of the day, firms generally must maintain a 7-10% ratio at minimum.
Over the last two years, Webster Financial has averaged a Tier 1 capital ratio of 11.1%, which is considered safe and well capitalized in the event that macro or market conditions suddenly deteriorate.
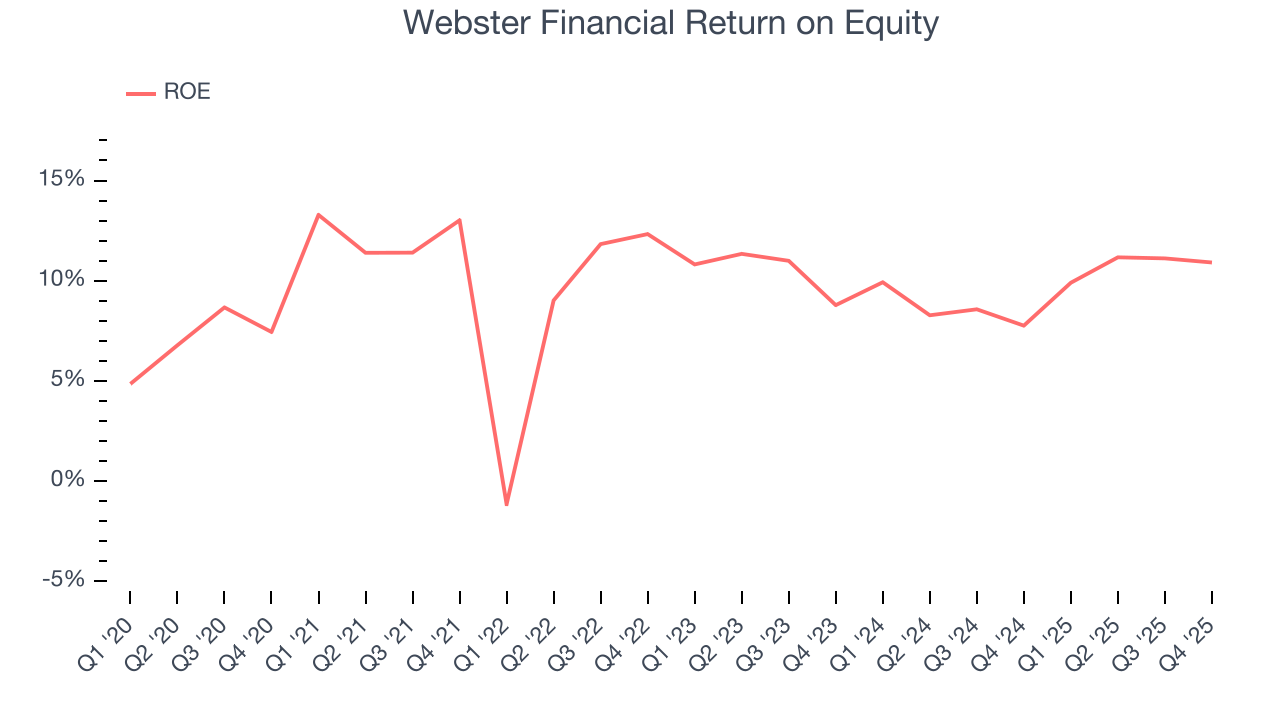
10. Return on Equity
Return on equity (ROE) measures how effectively banks generate profit from each dollar of shareholder equity - a critical funding source. High-ROE institutions typically compound shareholder wealth faster over time through retained earnings, share repurchases, and dividend payments.
Over the last five years, Webster Financial has averaged an ROE of 10%, respectable for a company operating in a sector where the average shakes out around 7.5% and those putting up 15%+ are greatly admired.
11. Key Takeaways from Webster Financial’s Q4 Results
It was encouraging to see Webster Financial beat analysts’ revenue expectations this quarter, leading to a small EPS beat. On the other hand, its tangible book value per share fell slightly short of Wall Street’s estimates. Overall, this was a mixed quarter. The stock remained flat at $66.44 immediately after reporting.
12. Is Now The Time To Buy Webster Financial?
Updated: March 23, 2026 at 12:54 AM EDT
We think that the latest earnings result is only one piece of the bigger puzzle. If you’re deciding whether to own Webster Financial, you should also grasp the company’s longer-term business quality and valuation.
Webster Financial isn’t a terrible business, but it doesn’t pass our bar. Although its revenue growth was exceptional over the last five years, it’s expected to deteriorate over the next 12 months and its estimated net interest income for the next 12 months are weak. And while the company’s net interest income growth was exceptional over the last five years, the downside is its anticipated efficiency ratio over the next year signals its day-to-day expenses will rise.
Webster Financial’s P/B ratio based on the next 12 months is 1.1x. This valuation is reasonable, but the company’s shakier fundamentals present too much downside risk. We're fairly confident there are better stocks to buy right now.
Wall Street analysts have a consensus one-year price target of $74.83 on the company (compared to the current share price of $67.44).