
Wells Fargo (WFC)
Wells Fargo doesn’t excite us. Its sluggish sales growth shows demand is soft, a worrisome sign for investors in high-quality stocks.― StockStory Analyst Team
1. News


2. Summary
Why We Think Wells Fargo Will Underperform
Founded during the California Gold Rush in 1852 to provide banking and express delivery services to miners and merchants, Wells Fargo (NYSE:WFC) is a diversified financial services company that provides banking, lending, investment, and wealth management services to individuals and businesses.
- Customers borrowered less money this cycle as its net interest income declined by 1.5% annually over the last five years
- Net interest margin of 2.7% reflects its high servicing and capital costs
- On the plus side, its demand for the next 12 months is expected to accelerate above its five-year trend as Wall Street forecasts robust net interest income growth of 35.8%


Wells Fargo falls below our quality standards. We’ve identified better opportunities elsewhere.
Why There Are Better Opportunities Than Wells Fargo


Wells Fargo is trading at $81.29 per share, or 1.5x forward P/B. This multiple is higher than most banking companies, and we think it’s quite expensive for the weaker revenue growth you get.
There are stocks out there featuring similar valuation multiples with better fundamentals. We prefer to invest in those.
3. Wells Fargo (WFC) Research Report: Q4 CY2025 Update
Financial services giant Wells Fargo (NYSE:WFC) fell short of the markets revenue expectations in Q4 CY2025 as sales rose 4.1% year on year to $21.29 billion. Its non-GAAP profit of $1.76 per share was 4.4% above analysts’ consensus estimates.
Wells Fargo (WFC) Q4 CY2025 Highlights:
- Net Interest Margin: 2.6% vs analyst estimates of 2.7% (5.5 basis point miss)
- Revenue: $21.29 billion vs analyst estimates of $21.65 billion (4.1% year-on-year growth, 1.6% miss)
- Efficiency Ratio: 64% vs analyst estimates of 62.7% (133 basis point miss)
- Adjusted EPS: $1.76 vs analyst estimates of $1.69 (4.4% beat)
- Tangible Book Value per Share: $45.02 vs analyst estimates of $44.62 (9.4% year-on-year growth, 0.9% beat)
- Market Capitalization: $293.7 billion
Company Overview
Founded during the California Gold Rush in 1852 to provide banking and express delivery services to miners and merchants, Wells Fargo (NYSE:WFC) is a diversified financial services company that provides banking, lending, investment, and wealth management services to individuals and businesses.
Wells Fargo operates through four main business segments that serve different customer needs. The Consumer Banking and Lending segment offers everyday financial products like checking and savings accounts, credit cards, and personal loans to individuals and small businesses. Commercial Banking focuses on serving private and family-owned companies with specialized lending, treasury management, and other financial solutions tailored to their growth needs.
The Corporate and Investment Banking division works with larger corporations, governments, and institutions, providing capital markets services, investment banking, and commercial real estate financing. Meanwhile, the Wealth and Investment Management segment serves affluent and high-net-worth clients with personalized financial planning, private banking, and investment management services.
A typical customer might use Wells Fargo for their primary checking account, obtain a mortgage for their home purchase, invest through a Wells Fargo financial advisor, and later secure a small business loan to expand their company. Business clients might use the bank's treasury management services to optimize cash flow while accessing credit facilities to fund operations.
Wells Fargo generates revenue primarily through interest income on loans, service charges, investment fees, and transaction fees. The company maintains a substantial investment portfolio consisting mainly of U.S. Treasury securities, federal agency debt, and mortgage-backed securities. As a financial holding company, Wells Fargo operates under extensive regulatory oversight from multiple federal agencies including the Federal Reserve, the Office of the Comptroller of the Currency, and the Consumer Financial Protection Bureau.
4. Diversified Banks
At their core, diversified banks take in deposits and engage in various forms of lending, which means revenue is generated through interest rate spreads (difference between loan and deposit rates) and fees. Other revenue comes from adjacent services such as wealth management, card and account fees, and products such as annuities. These institutions benefit from rising interest rates that improve NIMs (net interest margins), digital transformation reducing operational costs, and expanding wealth management services as populations age. However, they face headwinds including fintech competition disrupting traditional models (how disruptive is crypto?), stringent regulatory requirements increasing compliance costs, and cybersecurity threats requiring substantial technology investments. Economic downturns also pose risks through potential loan defaults and compressed margins during accommodative monetary policy periods.
Wells Fargo competes with other major U.S. financial institutions including JPMorgan Chase (NYSE:JPM), Bank of America (NYSE:BAC), and Citigroup (NYSE:C), as well as regional banks like PNC Financial Services (NYSE:PNC) and U.S. Bancorp (NYSE:USB).
5. Sales Growth
Net interest income and and fee-based revenue are the two pillars supporting bank earnings. The former captures profit from the gap between lending rates and deposit costs, while the latter encompasses charges for banking services, credit products, wealth management, and trading activities. Unfortunately, Wells Fargo’s 2.5% annualized revenue growth over the last five years was sluggish. This was below our standards and is a rough starting point for our analysis.
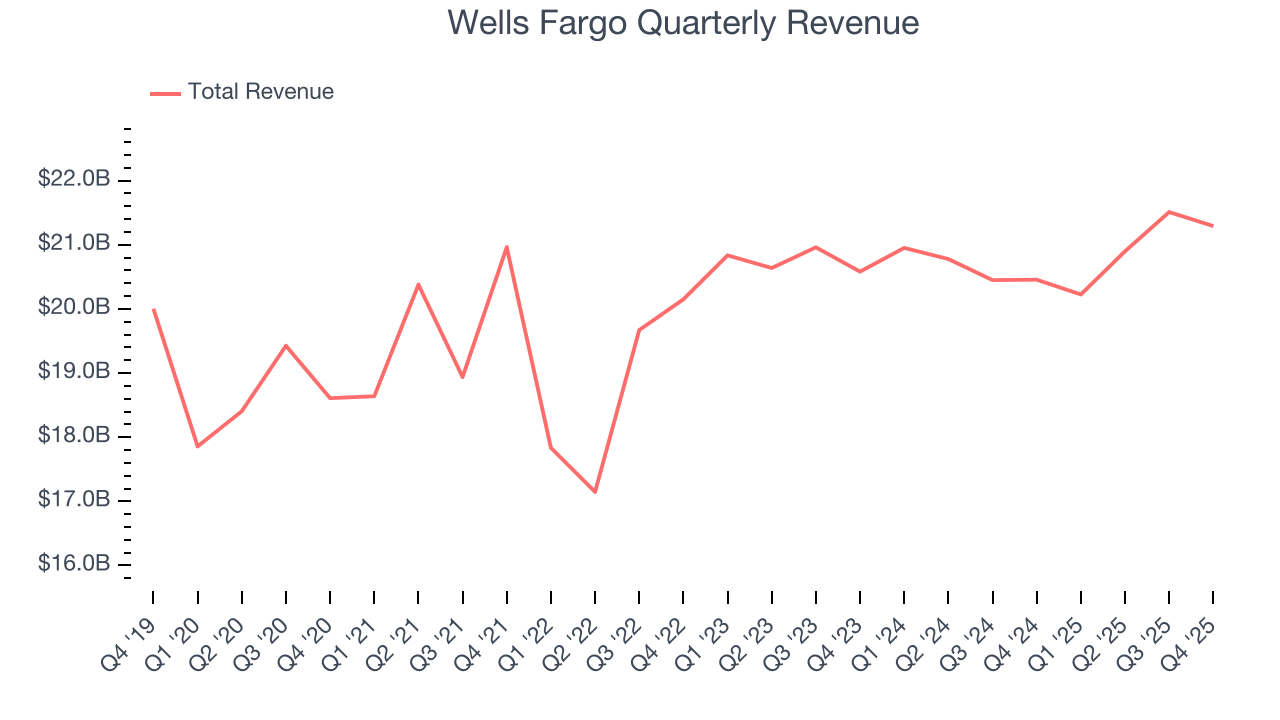
Long-term growth is the most important, but within financials, a half-decade historical view may miss recent interest rate changes and market returns. Wells Fargo’s recent performance shows its demand has slowed as its revenue was flat over the last two years. 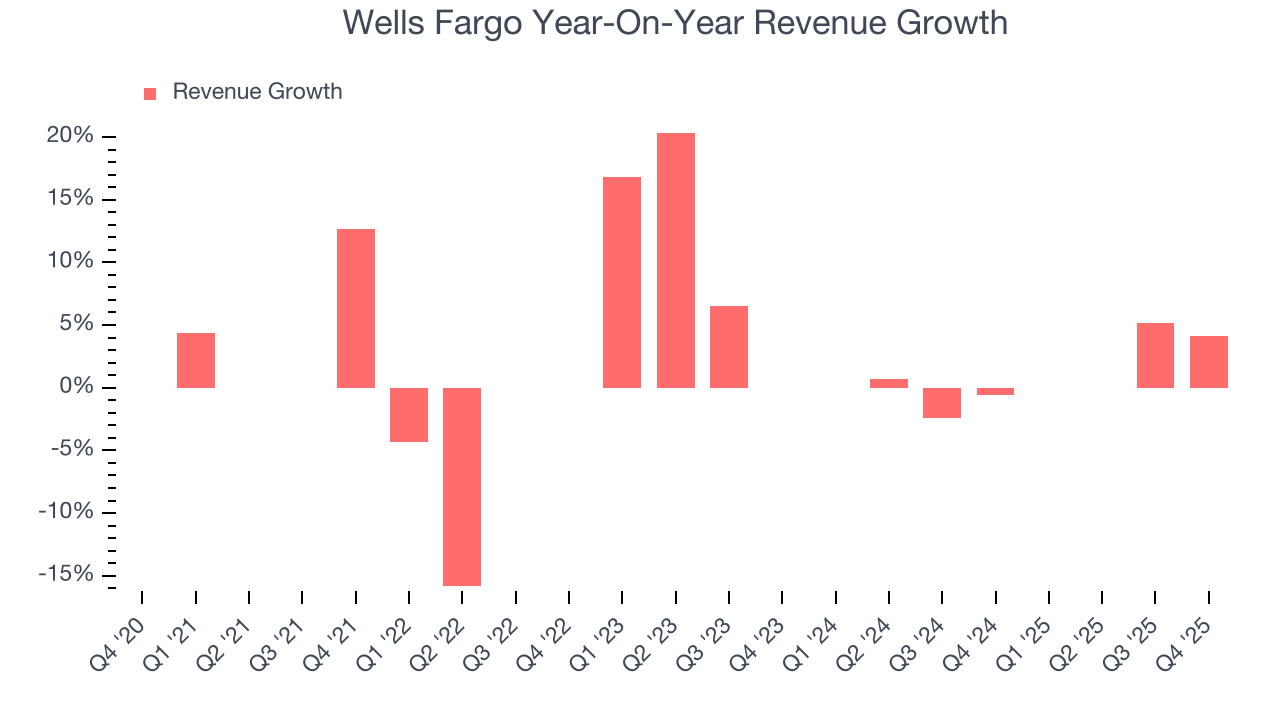 Note: Quarters not shown were determined to be outliers, impacted by outsized investment gains/losses that are not indicative of the recurring fundamentals of the business.
This quarter, Wells Fargo’s revenue grew by 4.1% year on year to $21.29 billion, falling short of Wall Street’s estimates.
Net interest income made up 56.4% of the company’s total revenue during the last five years, meaning Wells Fargo’s growth drivers strike a balance between lending and non-lending activities.
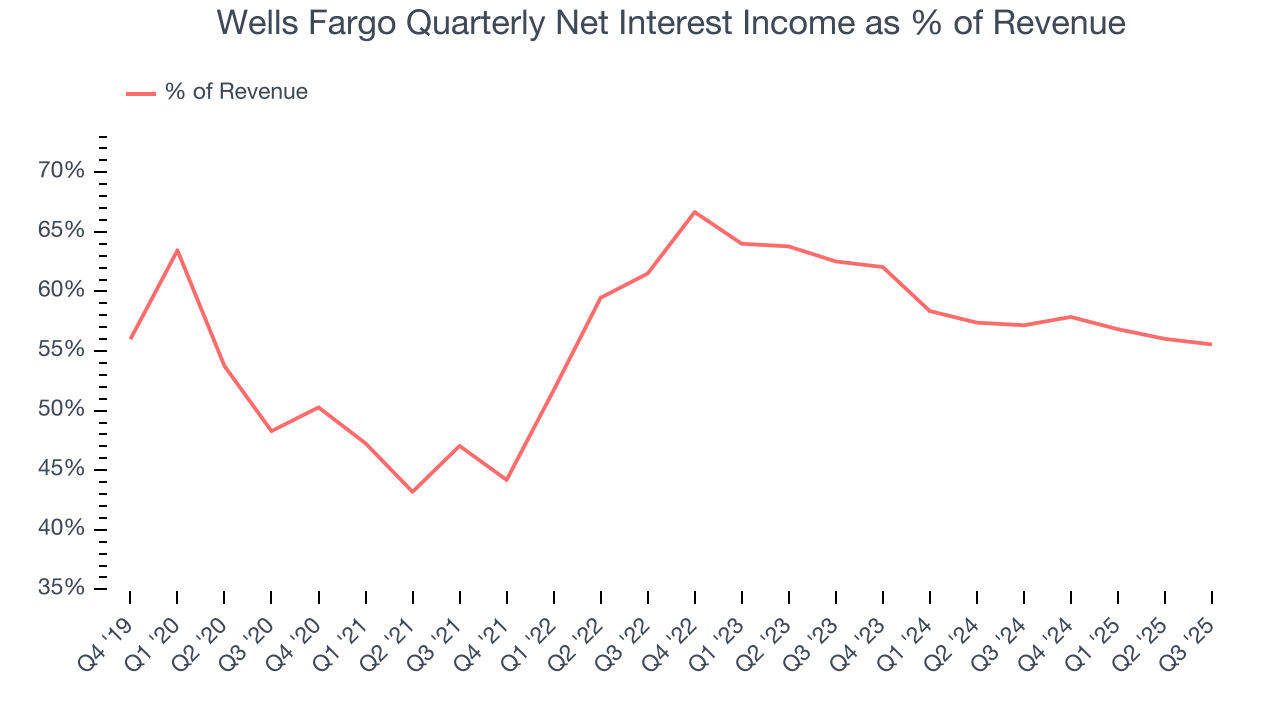
Net interest income commands greater market attention due to its reliability and consistency, whereas non-interest income is often seen as lower-quality revenue that lacks the same dependable characteristics.
6. Earnings Per Share
Revenue trends explain a company’s historical growth, but the long-term change in earnings per share (EPS) points to the profitability of that growth – for example, a company could inflate its sales through excessive spending on advertising and promotions.
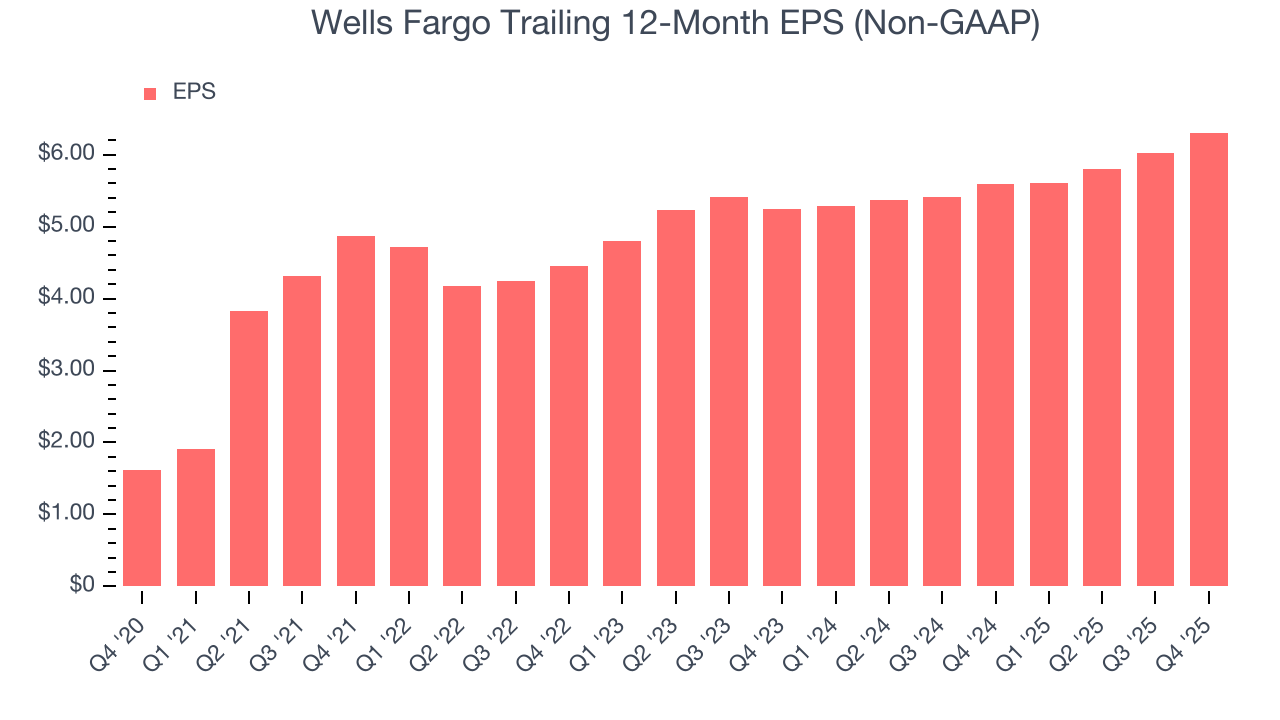
Wells Fargo’s EPS grew at an astounding 31.2% compounded annual growth rate over the last five years, higher than its 2.5% annualized revenue growth. However, this alone doesn’t tell us much about its business quality because its efficiency ratio didn’t improve.
Like with revenue, we analyze EPS over a shorter period to see if we are missing a change in the business.
For Wells Fargo, its two-year annual EPS growth of 9.6% was lower than its five-year trend. We hope its growth can accelerate in the future.
In Q4, Wells Fargo reported adjusted EPS of $1.76, up from $1.48 in the same quarter last year. This print beat analysts’ estimates by 4.4%. Over the next 12 months, Wall Street expects Wells Fargo’s full-year EPS of $6.31 to grow 10.6%.
7. Tangible Book Value Per Share (TBVPS)
The balance sheet drives banking profitability since earnings flow from the spread between borrowing and lending rates. As such, valuations for these companies concentrate on capital strength and sustainable equity accumulation potential.
Because of this, tangible book value per share (TBVPS) emerges as the critical performance benchmark. By excluding intangible assets with uncertain liquidation values, this metric captures real, liquid net worth per share. Traditional metrics like EPS are helpful but face distortion from M&A activity and loan loss accounting rules.
Wells Fargo’s TBVPS grew at a solid 6.3% annual clip over the last five years. The last two years show a similar trajectory as TBVPS grew by 7.2% annually from $39.21 to $45.02 per share.
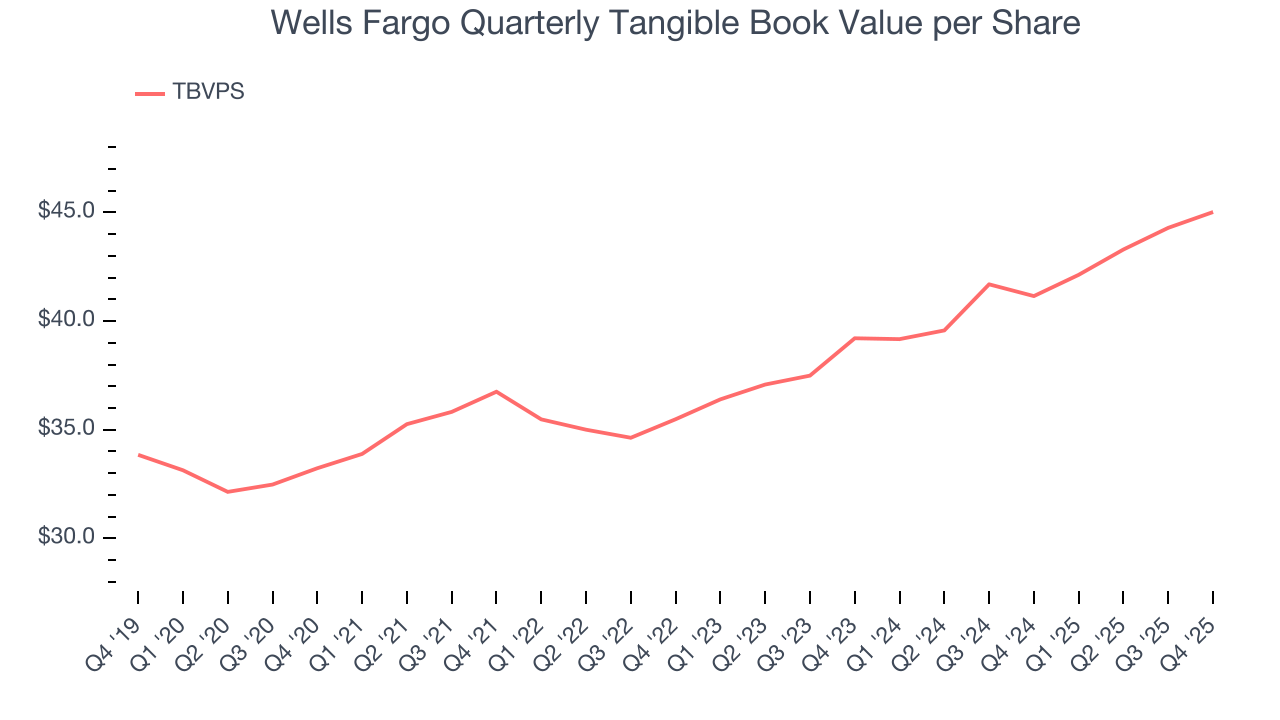
Over the next 12 months, Consensus estimates call for Wells Fargo’s TBVPS to grow by 4.2% to $46.90, lousy growth rate.
8. Balance Sheet Assessment
Leverage is core to a financial firm’s business model (loans funded by deposits). To ensure economic stability and avoid a repeat of the 2008 GFC, regulators require certain levels of capital and liquidity, focusing on the Tier 1 capital ratio.
Tier 1 capital is the highest-quality capital that a firm holds, consisting primarily of common stock and retained earnings, but also physical gold. It serves as the primary cushion against losses and is the first line of defense in times of financial distress.
This capital is divided by risk-weighted assets to derive the Tier 1 capital ratio. Risk-weighted means that cash and US treasury securities are assigned little risk while unsecured consumer loans and equity investments get much higher risk weights, for example.
New regulation after the 2008 financial crisis requires that all firms must maintain a Tier 1 capital ratio greater than 4.5%. On top of this, there are additional buffers based on scale, risk profile, and other regulatory classifications, so that at the end of the day, firms generally must maintain a 7-10% ratio at minimum.
Over the last two years, Wells Fargo has averaged a Tier 1 capital ratio of 12.3%, which is considered safe and well capitalized in the event that macro or market conditions suddenly deteriorate.
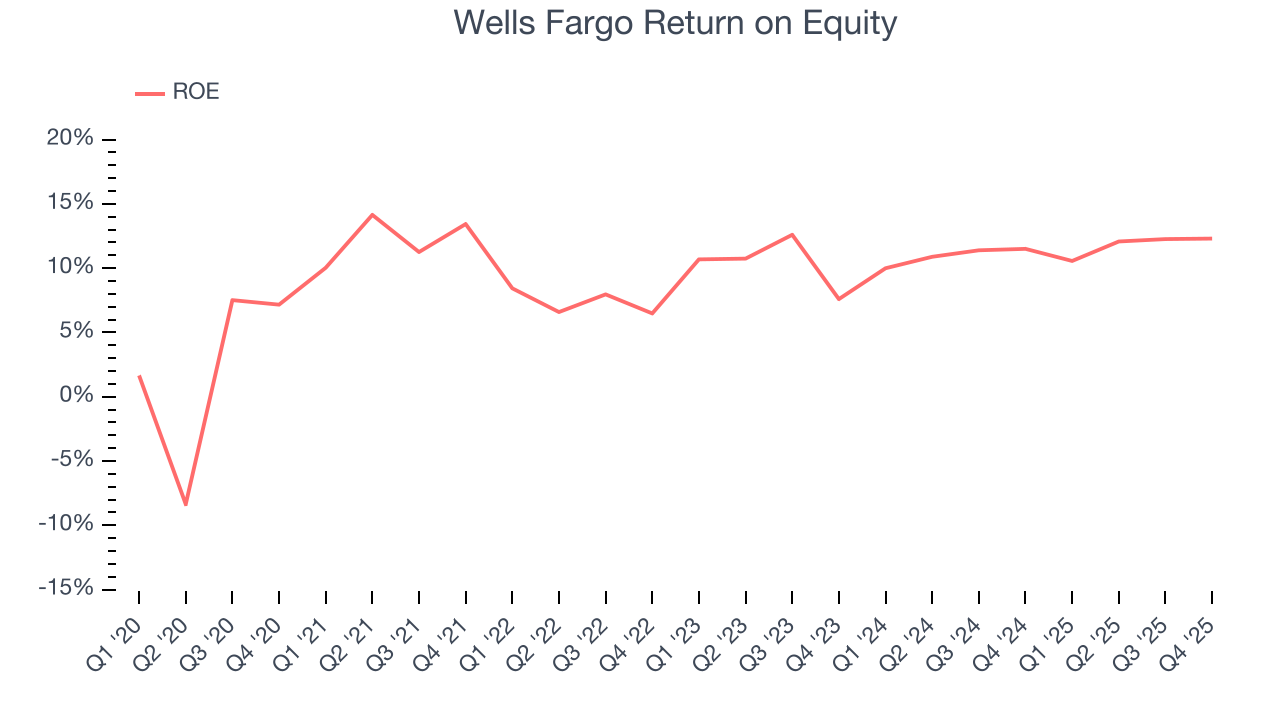
9. Return on Equity
Return on equity, or ROE, quantifies bank profitability relative to shareholder equity - an essential capital source for these institutions. Over extended periods, superior ROE performance drives faster shareholder wealth compounding through reinvestment, share repurchases, and dividend growth.
Over the last five years, Wells Fargo has averaged an ROE of 10.5%, respectable for a company operating in a sector where the average shakes out around 7.5% and those putting up 15%+ are greatly admired.
10. Key Takeaways from Wells Fargo’s Q4 Results
It was good to see Wells Fargo narrowly top analysts’ tangible book value per share expectations this quarter. On the other hand, its revenue missed. Overall, this was a mixed quarter. The stock traded down 1.1% to $92.51 immediately following the results.
11. Is Now The Time To Buy Wells Fargo?
Updated: March 1, 2026 at 12:30 AM EST
Are you wondering whether to buy Wells Fargo or pass? We urge investors to not only consider the latest earnings results but also longer-term business quality and valuation as well.
Wells Fargo isn’t a terrible business, but it doesn’t pass our quality test. To begin with, its revenue growth was weak over the last five years. While its estimated net interest income growth for the next 12 months is great, the downside is its declining net interest margin shows its loan book is becoming less profitable. On top of that, its net interest income has declined over the last five years.
Wells Fargo’s P/B ratio based on the next 12 months is 1.5x. Investors with a higher risk tolerance might like the company, but we think the potential downside is too great. We're pretty confident there are superior stocks to buy right now.
Wall Street analysts have a consensus one-year price target of $101.65 on the company (compared to the current share price of $81.29).
Although the price target is bullish, readers should exercise caution because analysts tend to be overly optimistic. The firms they work for, often big banks, have relationships with companies that extend into fundraising, M&A advisory, and other rewarding business lines. As a result, they typically hesitate to say bad things for fear they will lose out. We at StockStory do not suffer from such conflicts of interest, so we’ll always tell it like it is.