
Monarch (MCRI)
We wouldn’t recommend Monarch. Its weak sales growth and low returns on capital show it struggled to generate demand and profits.― StockStory Analyst Team
1. News


2. Summary
Why We Think Monarch Will Underperform
Established in 1993, Monarch (NASDAQ:MCRI) operates luxury casinos and resorts, offering high-end gaming, dining, and hospitality experiences.
- 4.3% annual revenue growth over the last two years was slower than its consumer discretionary peers
- Below-average returns on capital indicate management struggled to find compelling investment opportunities
- Anticipated sales growth of 2.8% for the next year implies demand will be shaky


Monarch falls short of our expectations. We’d rather invest in businesses with stronger moats.
Why There Are Better Opportunities Than Monarch


Monarch’s stock price of $100.41 implies a valuation ratio of 17.2x forward P/E. While valuation is appropriate for the quality you get, we’re still on the sidelines for now.
There are stocks out there similarly priced with better business quality. We prefer owning these.
3. Monarch (MCRI) Research Report: Q4 CY2025 Update
Luxury casino and resort operator Monarch (NASDAQ:MCRI) met Wall Street’s revenue expectations in Q4 CY2025, with sales up 4.1% year on year to $140 million. Its GAAP profit of $1.25 per share was 8.9% below analysts’ consensus estimates.
Monarch (MCRI) Q4 CY2025 Highlights:
- Revenue: $140 million vs analyst estimates of $139.4 million (4.1% year-on-year growth, in line)
- EPS (GAAP): $1.25 vs analyst expectations of $1.37 (8.9% miss)
- Adjusted EBITDA: $51.81 million vs analyst estimates of $48.95 million (37% margin, 5.8% beat)
- Operating Margin: 20.8%, up from 7.6% in the same quarter last year
- Market Capitalization: $1.71 billion
Company Overview
Established in 1993, Monarch (NASDAQ:MCRI) operates luxury casinos and resorts, offering high-end gaming, dining, and hospitality experiences.
Monarch began its journey with the Atlantis Casino Resort Spa in Reno, Nevada. It aimed to deliver a high-quality gaming and hospitality experience, focusing on the luxury resort market. The company's destinations provide an extensive range of amenities and services beyond traditional gaming.
Monarch's properties feature modern casino gaming facilities, deluxe hotel accommodations, fine dining, spa services, and entertainment. Its resorts target both gaming enthusiasts and guests seeking a premium leisure experience.
Revenue for Monarch is primarily derived from its diverse offerings, including casino operations, hotel services, and dining and entertainment amenities. The company prioritizes luxury, quality, and complete service, appealing to customers seeking an encompassing resort experience.
4. Casino Operator
Casino operators enjoy limited competition because gambling is a highly regulated industry. These companies can also enjoy healthy margins and profits. Have you ever heard the phrase ‘the house always wins’? Regulation cuts both ways, however, and casinos may face stroke-of-the-pen risk that suddenly limits what they can or can't do and where they can do it. Furthermore, digitization is changing the game, pun intended. Whether it’s online poker or sports betting on your smartphone, innovation is forcing these players to adapt to changing consumer preferences, such as being able to wager anywhere on demand.
Competitors in the casino and resort industry include Boyd Gaming (NYSE:BYD), Red Rock Resorts (NASDAQ:RRR), and Golden Entertainment (NASDAQ:GDEN).
5. Revenue Growth
Examining a company’s long-term performance can provide clues about its quality. Any business can experience short-term success, but top-performing ones enjoy sustained growth for years. Over the last five years, Monarch grew its sales at a 24.2% compounded annual growth rate. Although this growth is acceptable on an absolute basis, it fell slightly short of our standards for the consumer discretionary sector, which enjoys a number of secular tailwinds.
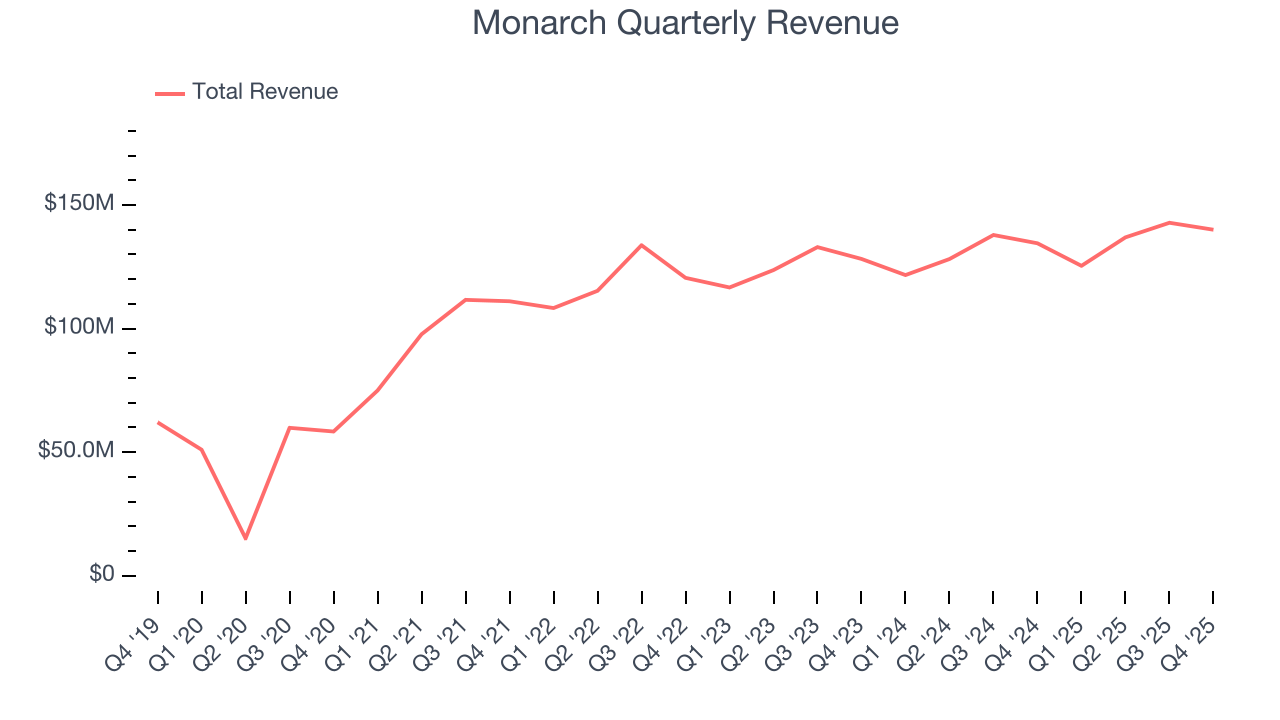
We at StockStory place the most emphasis on long-term growth, but within consumer discretionary, a stretched historical view may miss a company riding a successful new product or trend. Monarch’s recent performance shows its demand has slowed as its annualized revenue growth of 4.3% over the last two years was below its five-year trend. Note that COVID hurt Monarch’s business in 2020 and part of 2021, and it bounced back in a big way thereafter. 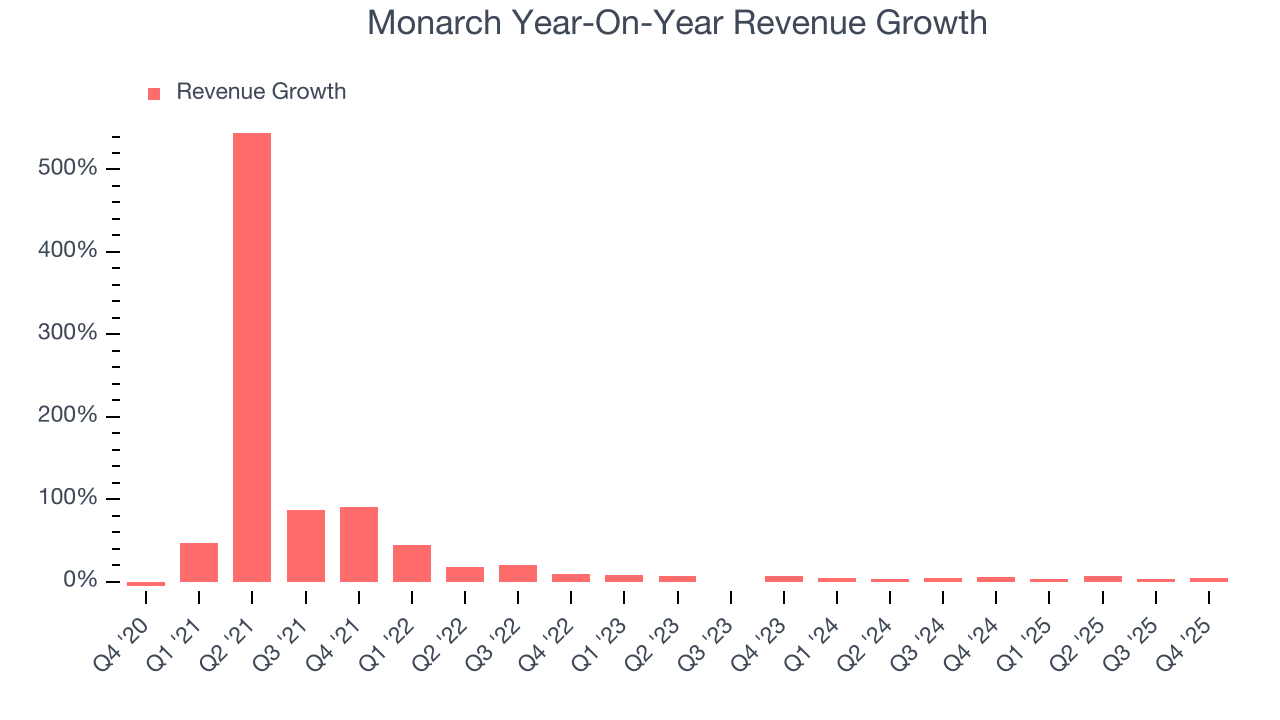
We can dig further into the company’s revenue dynamics by analyzing its three most important segments: Casino, Dining, and Hotel, which are 58%, 24.4%, and 12.8% of revenue. Over the last two years, Monarch’s revenues in all three segments increased. Its Casino revenue (Poker, Blackjack) averaged year-on-year growth of 5.5% while its Dining (food and beverage) and Hotel (overnight stays) revenues averaged 1.4% and 3.7%. 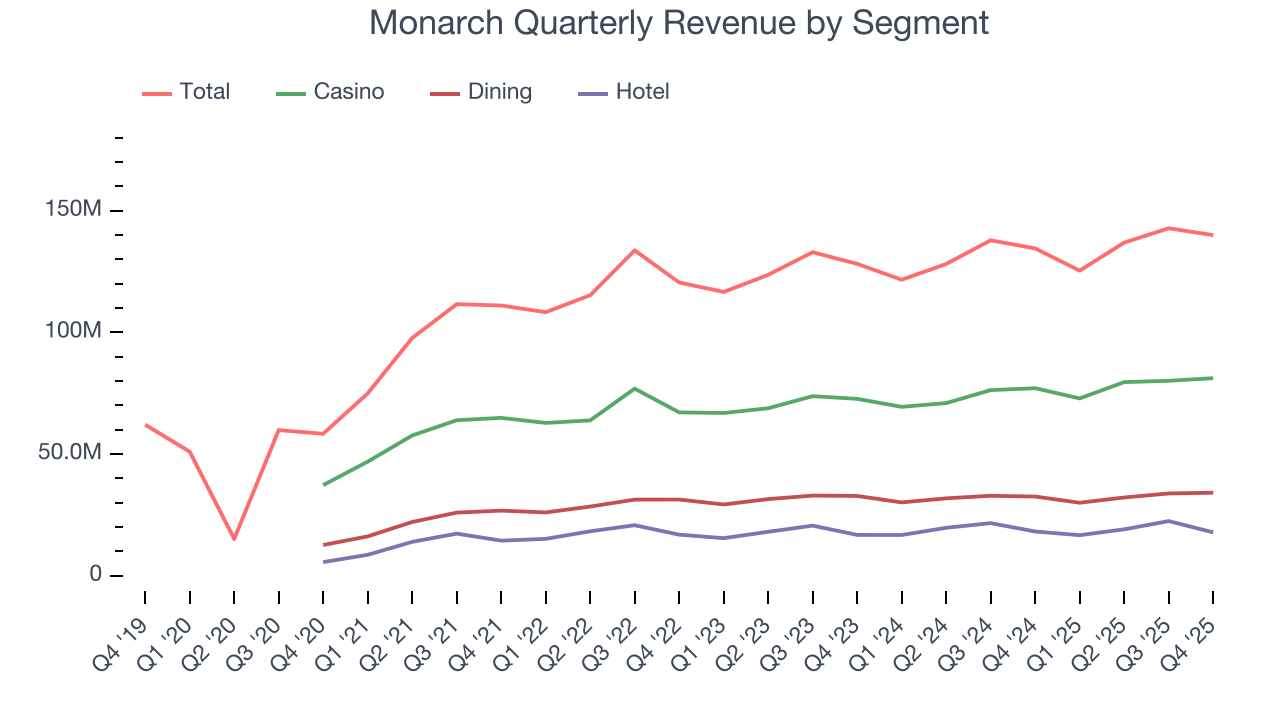
This quarter, Monarch grew its revenue by 4.1% year on year, and its $140 million of revenue was in line with Wall Street’s estimates.
Looking ahead, sell-side analysts expect revenue to grow 3.5% over the next 12 months, similar to its two-year rate. This projection doesn't excite us and implies its newer products and services will not accelerate its top-line performance yet.
6. Operating Margin
Operating margin is a key measure of profitability. Think of it as net income - the bottom line - excluding the impact of taxes and interest on debt, which are less connected to business fundamentals.
Monarch’s operating margin has been trending up over the last 12 months and averaged 21.2% over the last two years. The company’s higher efficiency is a breath of fresh air, but its suboptimal cost structure means it still sports lousy profitability for a consumer discretionary business.
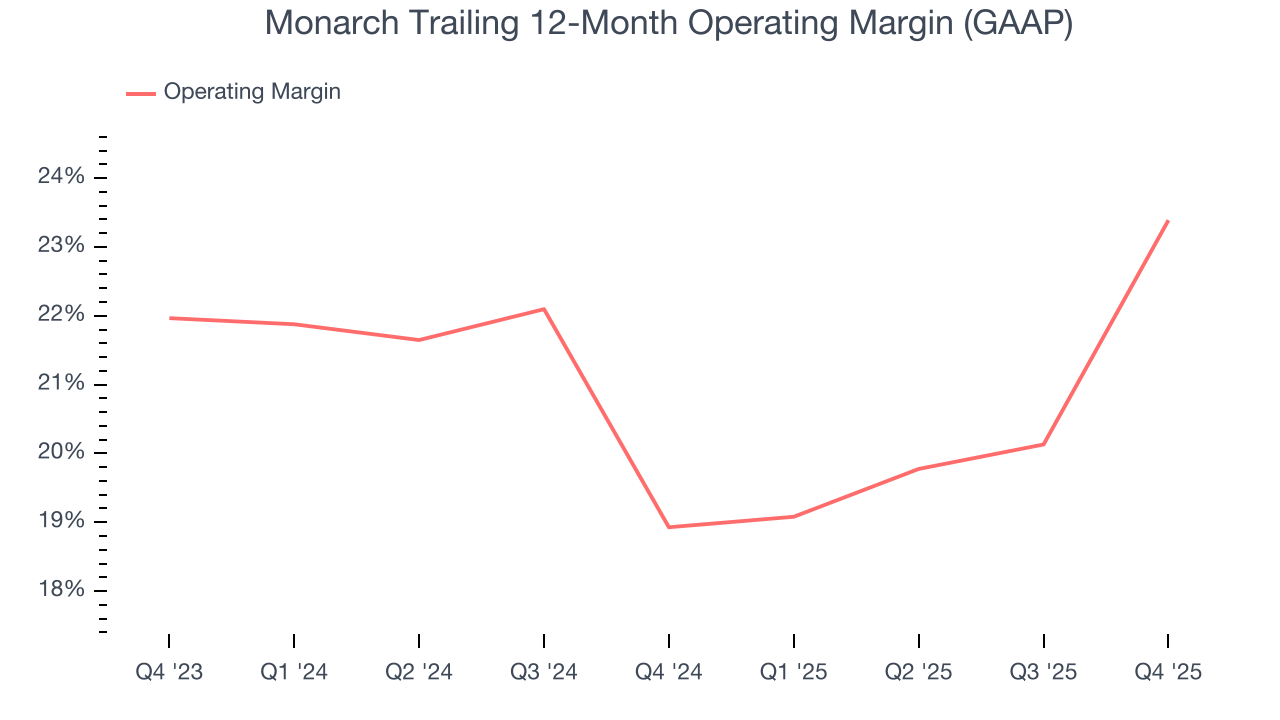
This quarter, Monarch generated an operating margin profit margin of 20.8%, up 13.2 percentage points year on year. This increase was a welcome development and shows it was more efficient.
7. Earnings Per Share
We track the long-term change in earnings per share (EPS) for the same reason as long-term revenue growth. Compared to revenue, however, EPS highlights whether a company’s growth is profitable.
Monarch’s EPS grew at a decent 34.4% compounded annual growth rate over the last five years, higher than its 24.2% annualized revenue growth. This tells us the company became more profitable on a per-share basis as it expanded.
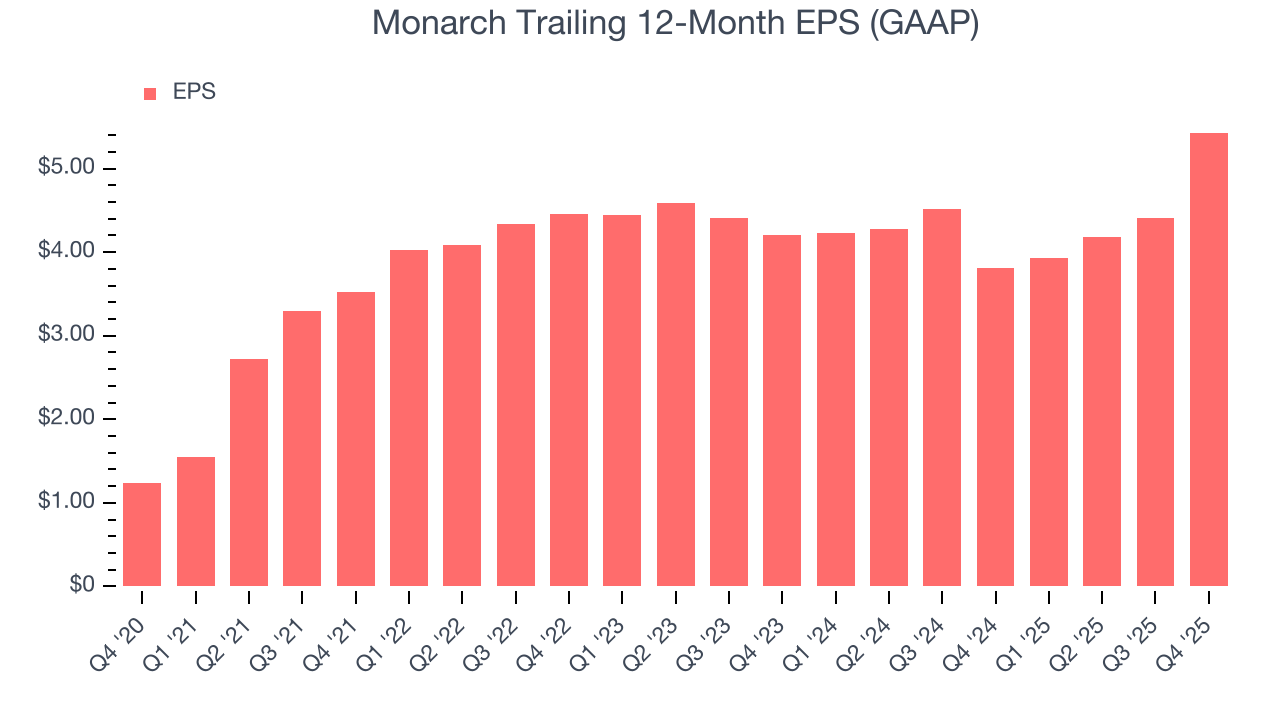
In Q4, Monarch reported EPS of $1.25, up from $0.22 in the same quarter last year. Despite growing year on year, this print missed analysts’ estimates, but we care more about long-term EPS growth than short-term movements. Over the next 12 months, Wall Street expects Monarch’s full-year EPS of $5.43 to grow 5.2%.
8. Cash Is King
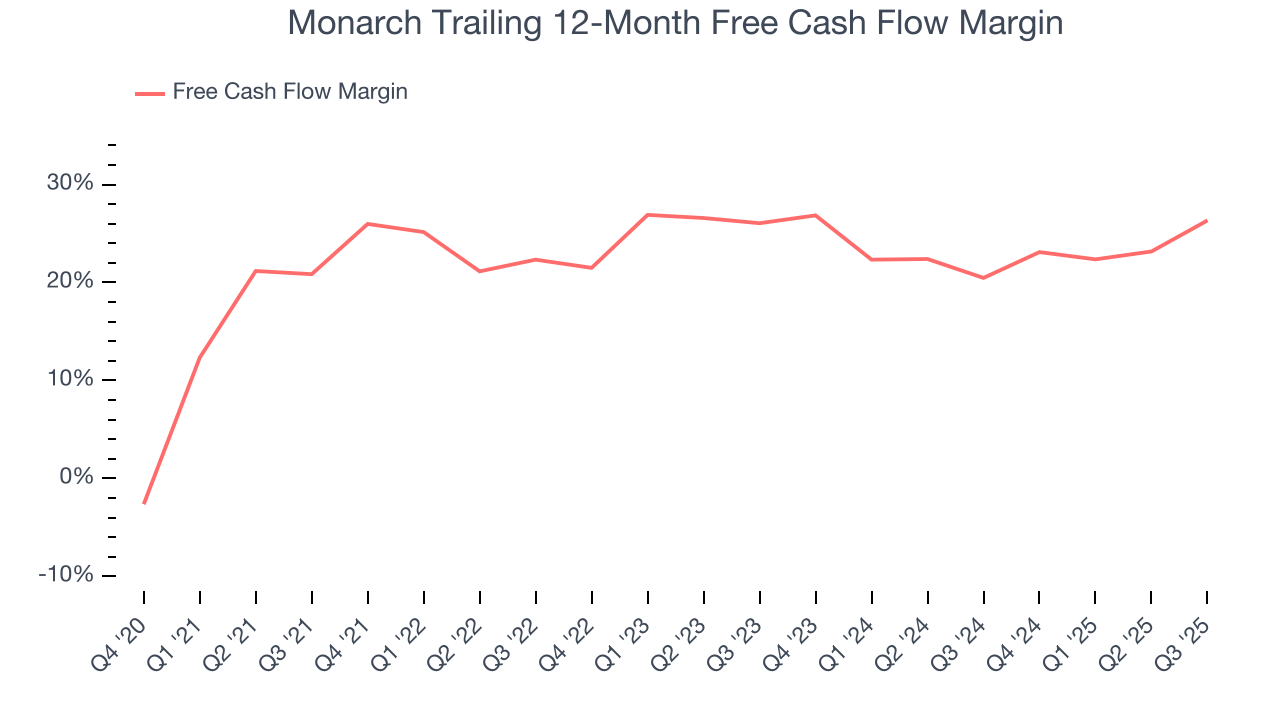
Although earnings are undoubtedly valuable for assessing company performance, we believe cash is king because you can’t use accounting profits to pay the bills.
Monarch has shown poor cash profitability over the last two years, giving the company limited opportunities to return capital to shareholders. Its free cash flow margin averaged 23.9%, lousy for a consumer discretionary business.
9. Return on Invested Capital (ROIC)
EPS and free cash flow tell us whether a company was profitable while growing its revenue. But was it capital-efficient? A company’s ROIC explains this by showing how much operating profit it makes compared to the money it has raised (debt and equity).
Monarch historically did a mediocre job investing in profitable growth initiatives. Its five-year average ROIC was 17.8%, somewhat low compared to the best consumer discretionary companies that consistently pump out 25%+.
We like to invest in businesses with high returns, but the trend in a company’s ROIC is what often surprises the market and moves the stock price. Fortunately, Monarch’s ROIC averaged 4.4 percentage point increases each year over the last few years. This is a good sign, and we hope the company can continue improving.
10. Balance Sheet Assessment
Companies with more cash than debt have lower bankruptcy risk.
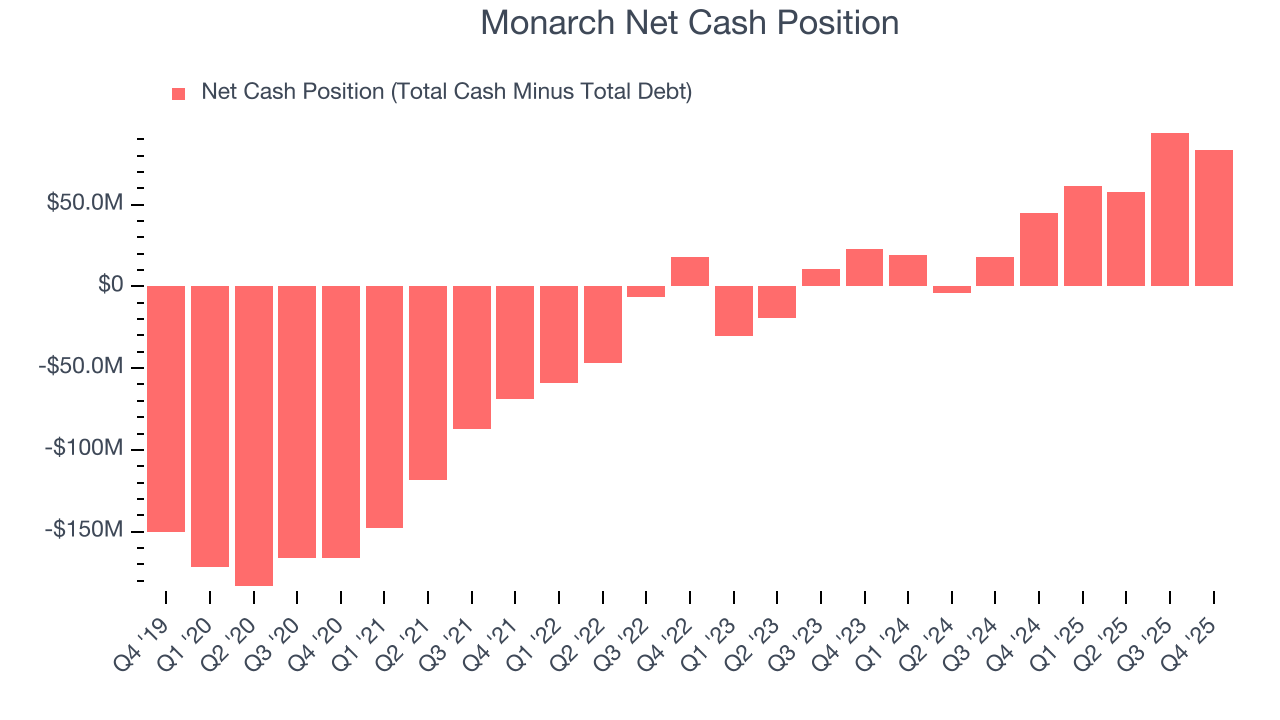
Monarch is a profitable, well-capitalized company with $96.47 million of cash and $13.3 million of debt on its balance sheet. This $83.17 million net cash position is 4.9% of its market cap and gives it the freedom to borrow money, return capital to shareholders, or invest in growth initiatives. Leverage is not an issue here.
11. Key Takeaways from Monarch’s Q4 Results
It was encouraging to see Monarch beat analysts’ EBITDA expectations this quarter. On the other hand, its Hotel revenue missed and its EPS fell short of Wall Street’s estimates. Overall, this quarter could have been better. The stock remained flat at $93.25 immediately following the results.
12. Is Now The Time To Buy Monarch?
Updated: March 15, 2026 at 11:07 PM EDT
Before deciding whether to buy Monarch or pass, we urge investors to consider business quality, valuation, and the latest quarterly results.
Monarch falls short of our quality standards. On top of that, Monarch’s projected EPS for the next year is lacking, and its relatively low ROIC suggests management has struggled to find compelling investment opportunities.
Monarch’s P/E ratio based on the next 12 months is 17.2x. This valuation is reasonable, but the company’s shaky fundamentals present too much downside risk. There are better investments elsewhere.
Wall Street analysts have a consensus one-year price target of $107.67 on the company (compared to the current share price of $100.41).