
Pangaea (PANL)
We’re cautious of Pangaea. It not only barely produces cash but also has been less efficient lately, as seen by its falling margins.― StockStory Analyst Team
1. News


2. Summary
Why We Think Pangaea Will Underperform
Established in 1996, Pangaea Logistics (NASDAQ:PANL) specializes in global logistics and transportation services, focusing on the shipment of dry bulk cargoes.
- Earnings per share have contracted by 30.5% annually over the last four years, a headwind for returns as stock prices often echo long-term EPS performance
- Ability to fund investments or reward shareholders with increased buybacks or dividends is restricted by its weak free cash flow margin of 1.1% for the last five years
- The good news is that its exciting sales outlook for the upcoming 12 months calls for 19.6% growth, an acceleration from its two-year trend


Pangaea falls short of our quality standards. Better stocks can be found in the market.
Why There Are Better Opportunities Than Pangaea


Pangaea is trading at $6.42 per share, or 27.4x forward P/E. Not only does Pangaea trade at a premium to companies in the industrials space, but this multiple is also high for its fundamentals.
We’d rather invest in similarly-priced but higher-quality companies with more reliable earnings growth.
3. Pangaea (PANL) Research Report: Q4 CY2025 Update
Pangaea Logistics (NASDAQ:PANL) reported revenue ahead of Wall Street’s expectations in Q4 CY2025, with sales up 24.9% year on year to $183.9 million. Its non-GAAP profit of $0.16 per share was 30.4% below analysts’ consensus estimates.
Pangaea (PANL) Q4 CY2025 Highlights:
- Revenue: $183.9 million vs analyst estimates of $181.7 million (24.9% year-on-year growth, 1.2% beat)
- Adjusted EPS: $0.16 vs analyst expectations of $0.23 (30.4% miss)
- Adjusted EBITDA: $28.74 million vs analyst estimates of $31.9 million (15.6% margin, 9.9% miss)
- Operating Margin: 8%, down from 10.1% in the same quarter last year
- Free Cash Flow Margin: 7.7%, up from 5.1% in the same quarter last year
- Market Capitalization: $542.5 million
Company Overview
Established in 1996, Pangaea Logistics (NASDAQ:PANL) specializes in global logistics and transportation services, focusing on the shipment of dry bulk cargoes.
Pangaea Logistics Solutions was founded to optimize the supply chain for industries reliant on bulk commodities. Specifically, the company sought to improve the efficiency of transporting materials such as grains, minerals, and other bulk goods across global shipping routes.
Pangaea Logistics operates a fleet of vessels suited for a variety of dry bulk cargoes. The company specializes in logistics solutions that manage maritime shipping for commodities like nickel ore from Indonesia, bauxite from the Caribbean, and ice-class trades in the Arctic region. Additionally, subsidiary Nordic Bulk Carriers allows Pangaea to navigate polar and harsh environments, offering services that differentiate them within the shipping industry.
The company’s revenue is primarily derived from long-term charter agreements and spot market contracts, allowing flexibility in adapting to changing market conditions. The long-term nature of charter agreements allow for a predictable revenue stream for Pangea, providing some security. Pangaea sells its shipping services to major industrial and commodities companies, utilizing direct sales and broker networks.
4. Marine Transportation
The growth of e-commerce and global trade continues to drive demand for shipping services, presenting opportunities for marine transportation companies. While ocean freight is more fuel efficient and therefore cheaper than its air and ground counterparts, it results in slower delivery times, presenting a trade off. To improve transit speeds, the industry continues to invest in digitization to optimize fleets and routes. However, marine transportation companies are still at the whim of economic cycles. Consumer spending, for example, can greatly impact the demand for these companies’ offerings while fuel costs can influence profit margins. Geopolitical tensions can also affect access to trade routes, and if certain countries are banned from using passageways like the Panama Canal, costs can spiral out of control.
Competitors in the logistics and transportation industry include Genco Shipping & Trading (NYSE:GNK), Daseke (NASDAQ:DSKE), and Star Bulk Carriers (NASDAQ:SBLK)
5. Revenue Growth
A company’s long-term performance is an indicator of its overall quality. Any business can experience short-term success, but top-performing ones enjoy sustained growth for years. Thankfully, Pangaea’s 10.5% annualized revenue growth over the last five years was impressive. Its growth beat the average industrials company and shows its offerings resonate with customers.
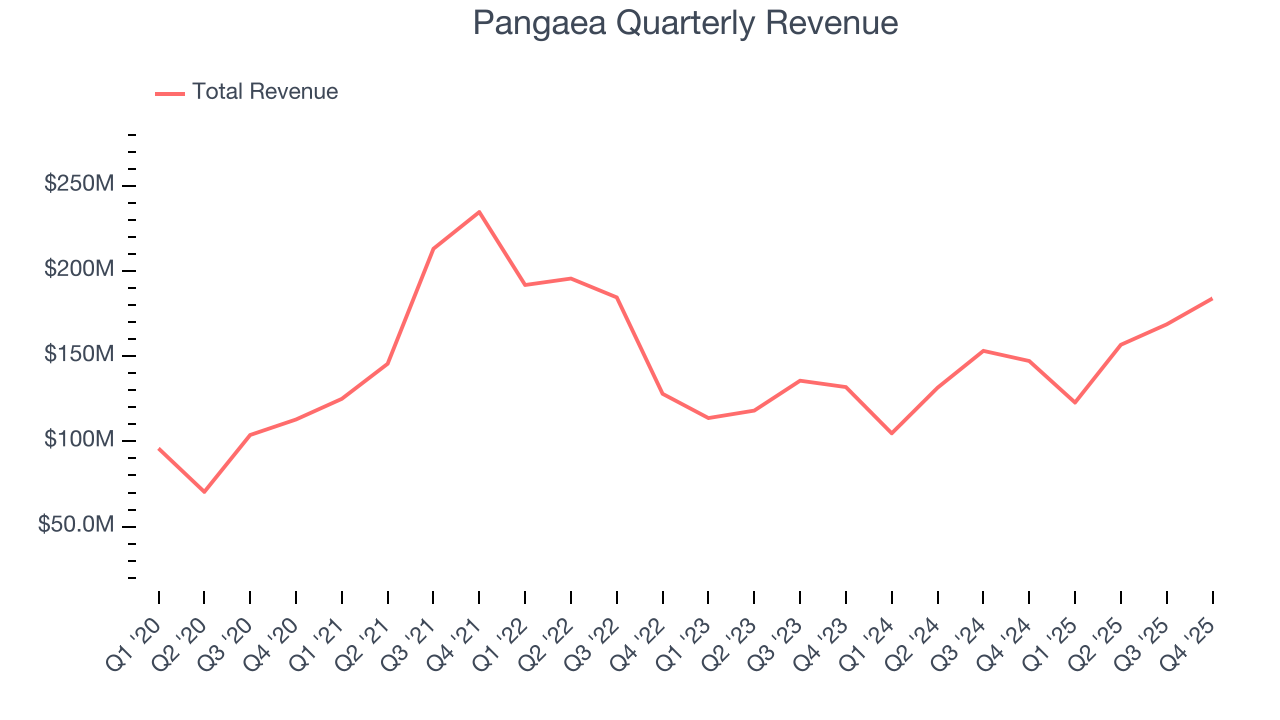
We at StockStory place the most emphasis on long-term growth, but within industrials, a half-decade historical view may miss cycles, industry trends, or a company capitalizing on catalysts such as a new contract win or a successful product line. Pangaea’s annualized revenue growth of 12.5% over the last two years is above its five-year trend, suggesting its demand was strong and recently accelerated. 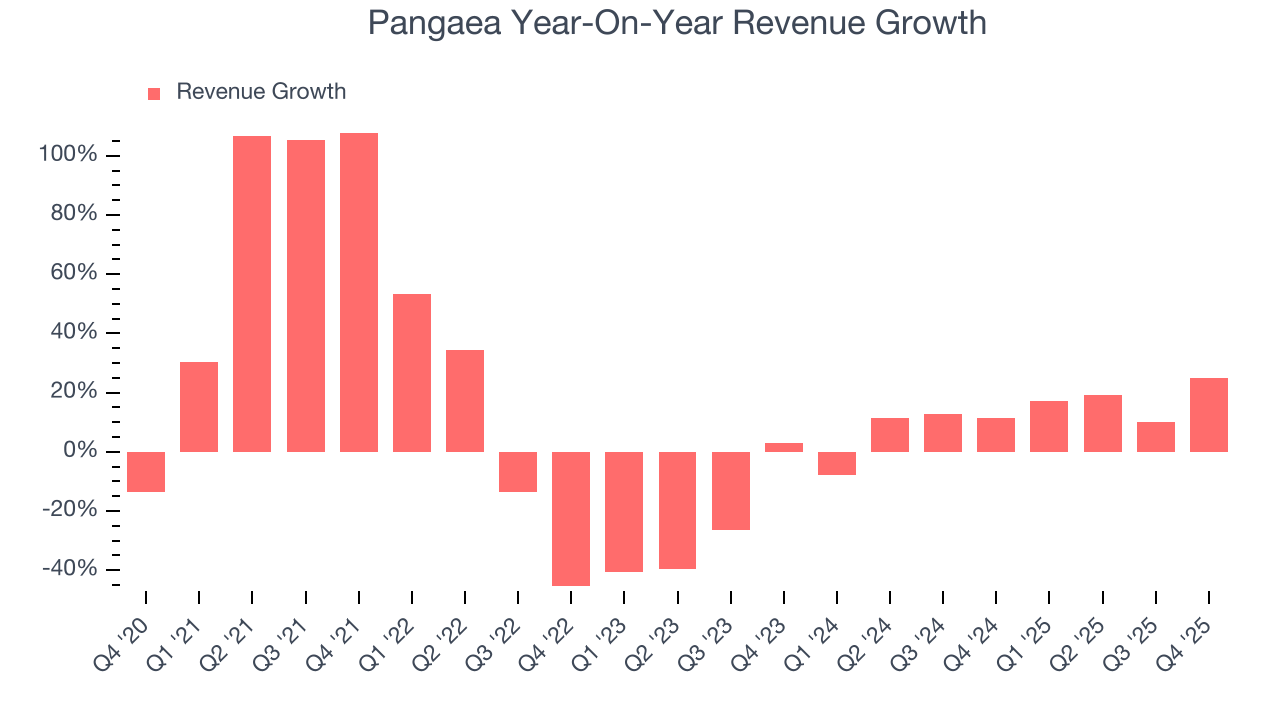
This quarter, Pangaea reported robust year-on-year revenue growth of 24.9%, and its $183.9 million of revenue topped Wall Street estimates by 1.2%.
Looking ahead, sell-side analysts expect revenue to grow 25.1% over the next 12 months, an improvement versus the last two years. This projection is eye-popping and indicates its newer products and services will spur better top-line performance.
6. Gross Margin & Pricing Power
For industrials businesses, cost of sales is usually comprised of the direct labor, raw materials, and supplies needed to offer a product or service. These costs can be impacted by inflation and supply chain dynamics in the short term and a company’s purchasing power and scale over the long term.
Pangaea has bad unit economics for an industrials business, signaling it operates in a competitive market. As you can see below, it averaged a 19.2% gross margin over the last five years. That means Pangaea paid its suppliers a lot of money ($80.77 for every $100 in revenue) to run its business. 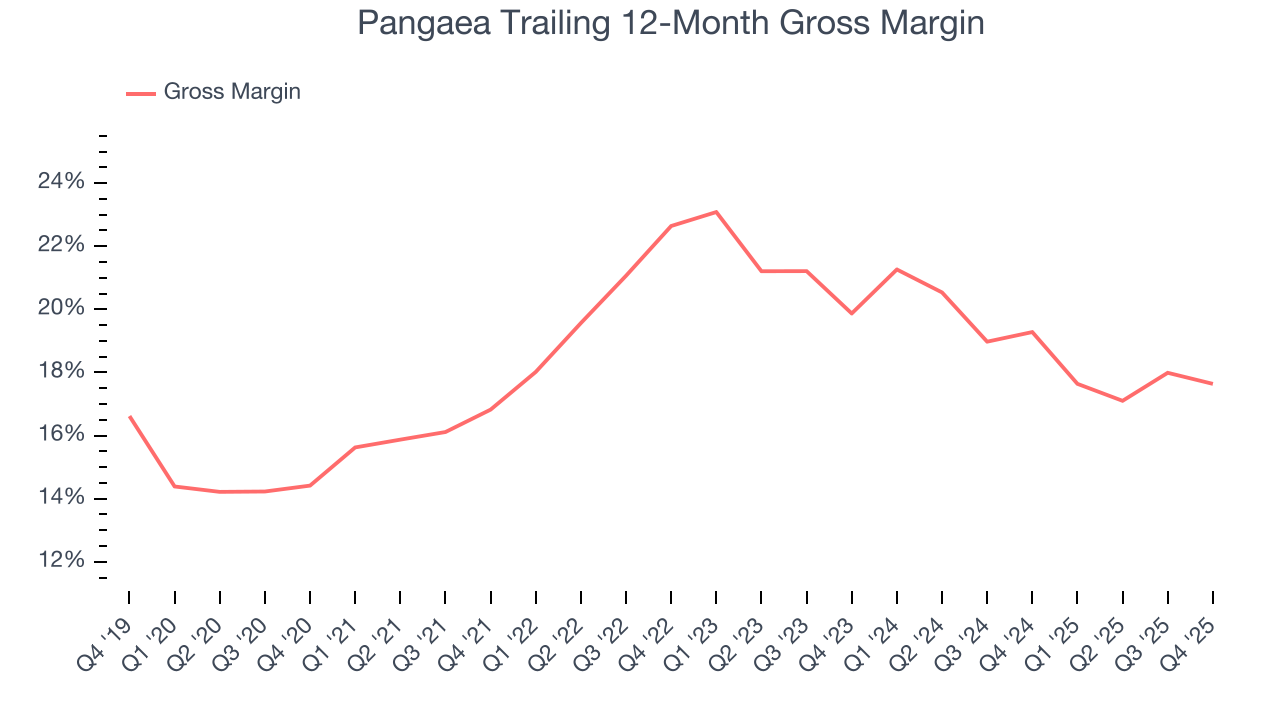
Pangaea produced a 18.1% gross profit margin in Q4, down 1.5 percentage points year on year. Pangaea’s full-year margin has also been trending down over the past 12 months, decreasing by 1.6 percentage points. If this move continues, it could suggest a more competitive environment with some pressure to lower prices and higher input costs (such as raw materials and manufacturing expenses).
7. Operating Margin
Operating margin is a key measure of profitability. Think of it as net income - the bottom line - excluding the impact of taxes and interest on debt, which are less connected to business fundamentals.
Pangaea has managed its cost base well over the last five years. It demonstrated solid profitability for an industrials business, producing an average operating margin of 10.4%. This result was particularly impressive because of its low gross margin, which is mostly a factor of what it sells and takes huge shifts to move meaningfully. Companies have more control over their operating margins, and it’s a show of well-managed operations if they’re high when gross margins are low.
Analyzing the trend in its profitability, Pangaea’s operating margin decreased by 5 percentage points over the last five years. This raises questions about the company’s expense base because its revenue growth should have given it leverage on its fixed costs, resulting in better economies of scale and profitability.
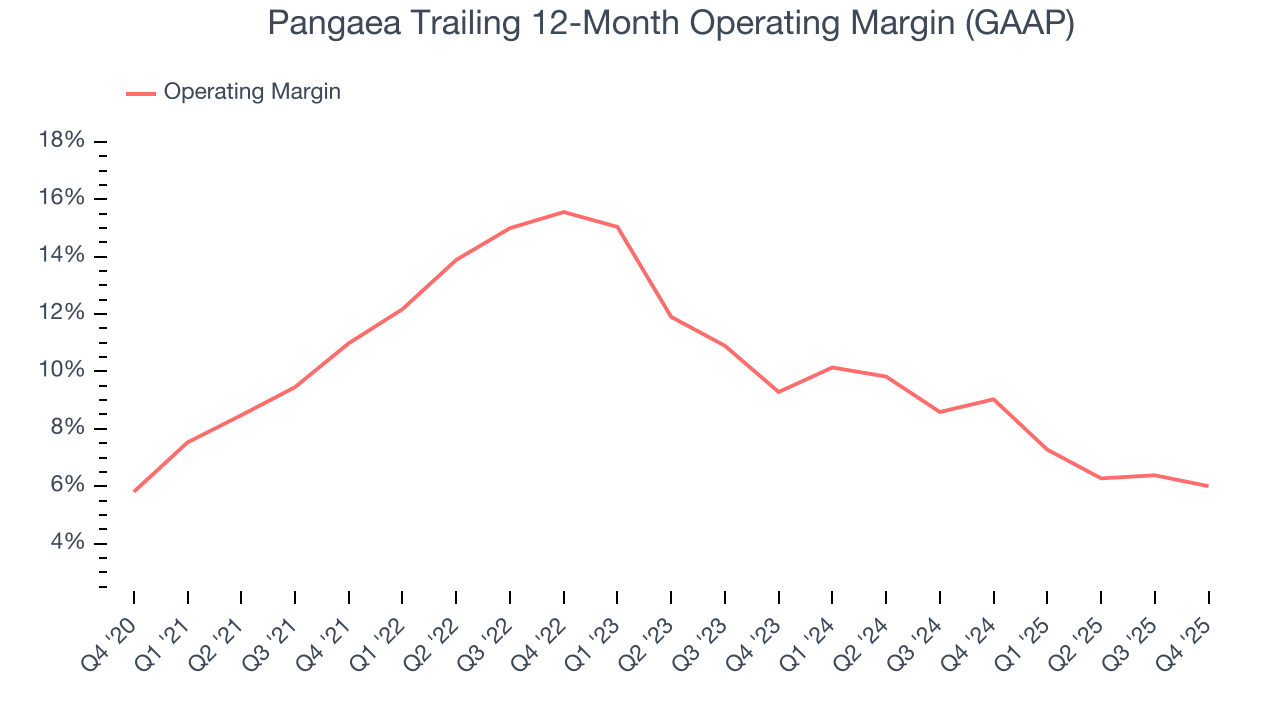
This quarter, Pangaea generated an operating margin profit margin of 8%, down 2 percentage points year on year. Since Pangaea’s operating margin decreased more than its gross margin, we can assume it was less efficient because expenses such as marketing, R&D, and administrative overhead increased.
8. Earnings Per Share
Revenue trends explain a company’s historical growth, but the long-term change in earnings per share (EPS) points to the profitability of that growth – for example, a company could inflate its sales through excessive spending on advertising and promotions.
Pangaea’s full-year EPS dropped 190%, or 30.5% annually, over the last four years. We tend to steer our readers away from companies with falling revenue and EPS, where diminishing earnings could imply changing secular trends and preferences. If the tide turns unexpectedly, Pangaea’s low margin of safety could leave its stock price susceptible to large downswings.
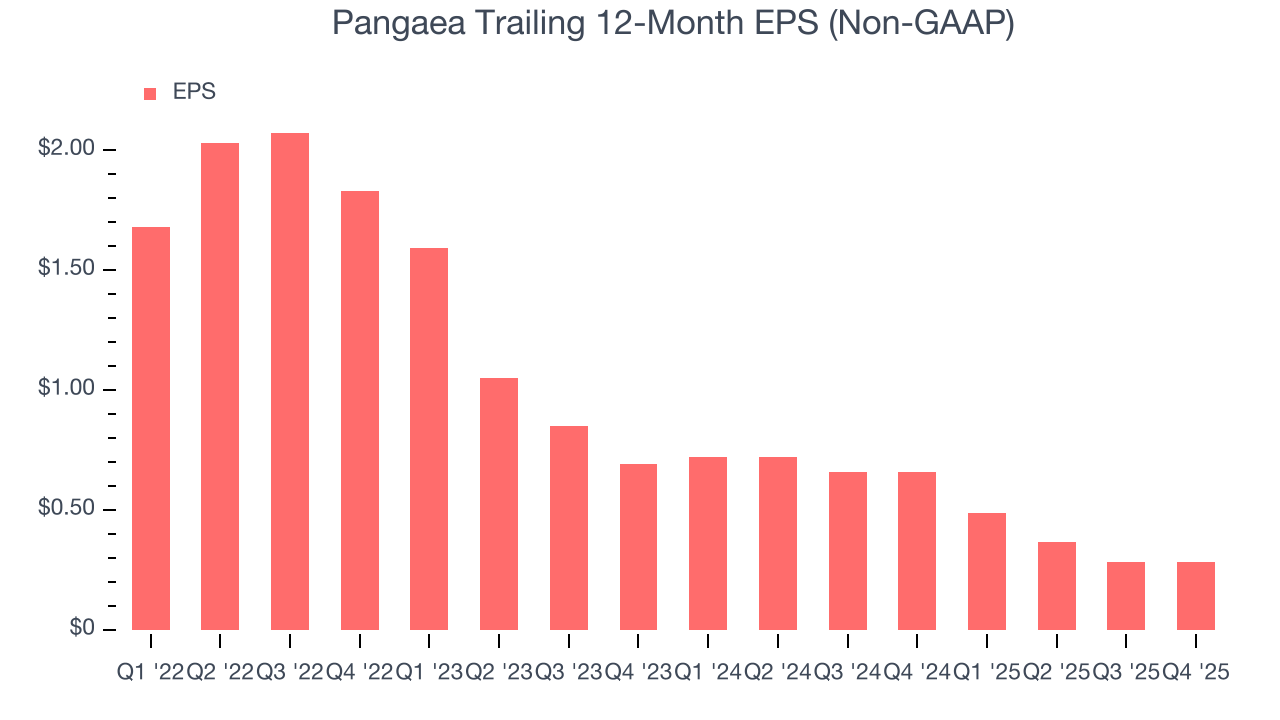
Like with revenue, we analyze EPS over a shorter period to see if we are missing a change in the business.
Sadly for Pangaea, its EPS declined by 36.3% annually over the last two years while its revenue grew by 12.5%. This tells us the company became less profitable on a per-share basis as it expanded.
Diving into the nuances of Pangaea’s earnings can give us a better understanding of its performance. A two-year view shows Pangaea has diluted its shareholders, growing its share count by 41.4%. This has led to lower per share earnings. Taxes and interest expenses can also affect EPS but don’t tell us as much about a company’s fundamentals. 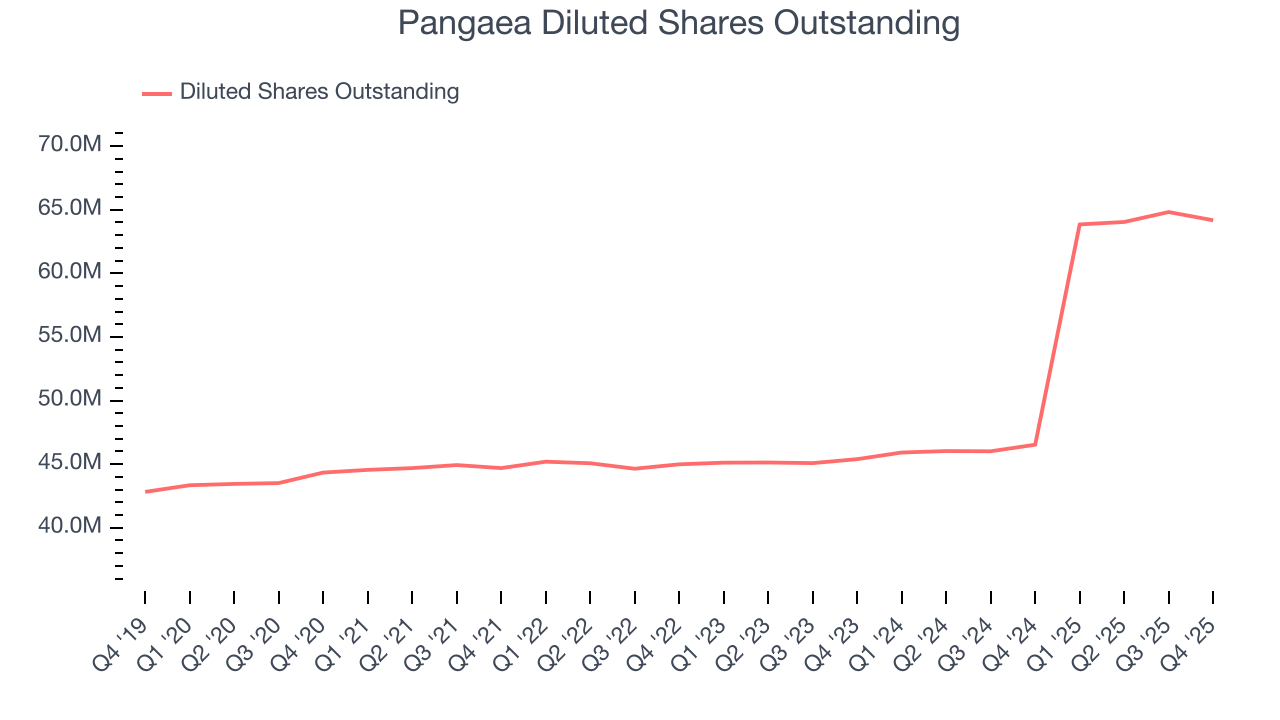
In Q4, Pangaea reported adjusted EPS of $0.16, in line with the same quarter last year. This print missed analysts’ estimates. Over the next 12 months, Wall Street expects Pangaea’s full-year EPS of $0.28 to grow 300%.
9. Cash Is King
Although earnings are undoubtedly valuable for assessing company performance, we believe cash is king because you can’t use accounting profits to pay the bills.
Pangaea has shown poor cash profitability relative to peers over the last five years, giving the company fewer opportunities to return capital to shareholders. Its free cash flow margin averaged 1.1%, below what we’d expect for an industrials business. The divergence from its good operating margin stems from its capital-intensive business model, which requires Pangaea to make large cash investments in working capital and capital expenditures.
Taking a step back, an encouraging sign is that Pangaea’s margin expanded by 26.3 percentage points during that time. The company’s improvement shows it’s heading in the right direction, and we can see it became a less capital-intensive business because its free cash flow profitability rose while its operating profitability fell.
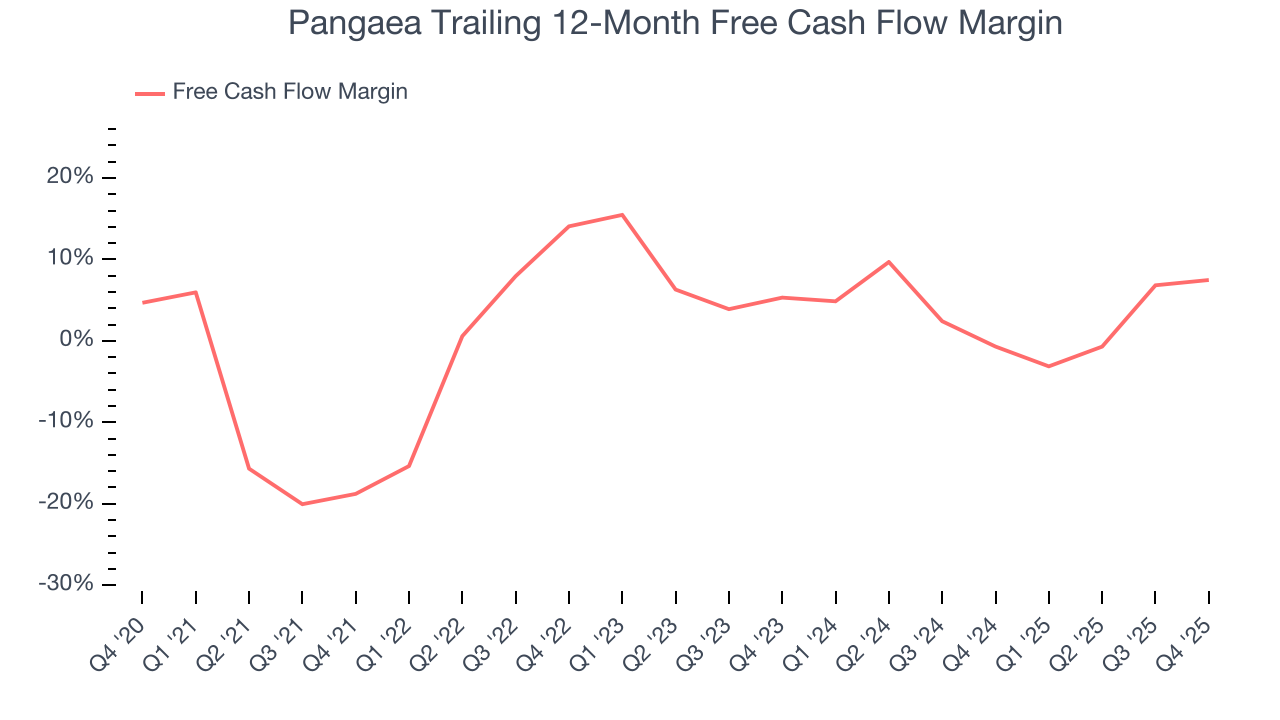
Pangaea’s free cash flow clocked in at $14.14 million in Q4, equivalent to a 7.7% margin. This result was good as its margin was 2.6 percentage points higher than in the same quarter last year, building on its favorable historical trend.
10. Balance Sheet Assessment
Pangaea reported $103.3 million of cash and $374.3 million of debt on its balance sheet in the most recent quarter. As investors in high-quality companies, we primarily focus on two things: 1) that a company’s debt level isn’t too high and 2) that its interest payments are not excessively burdening the business.
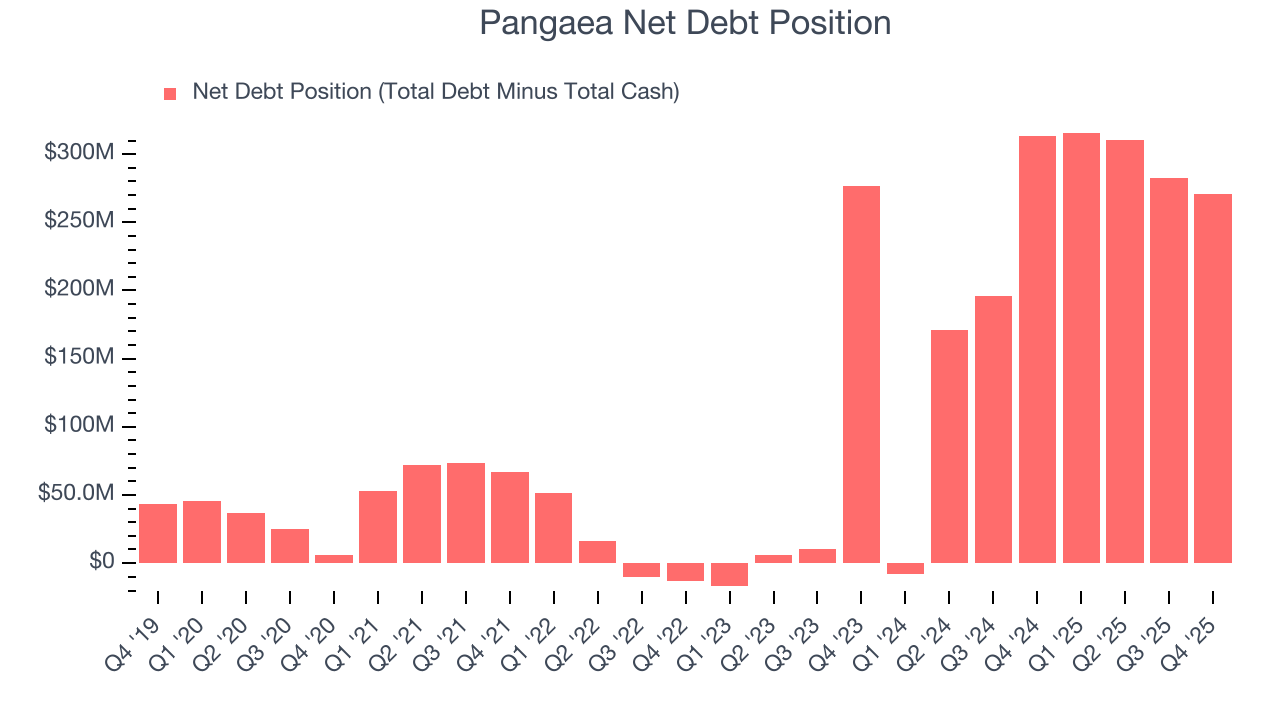
With $87.69 million of EBITDA over the last 12 months, we view Pangaea’s 3.1× net-debt-to-EBITDA ratio as safe. We also see its $22.37 million of annual interest expenses as appropriate. The company’s profits give it plenty of breathing room, allowing it to continue investing in growth initiatives.
11. Key Takeaways from Pangaea’s Q4 Results
It was good to see Pangaea narrowly top analysts’ revenue expectations this quarter. On the other hand, its EBITDA missed and its EPS fell short of Wall Street’s estimates. Overall, this was a weaker quarter. The stock traded down 1% to $8.26 immediately following the results.
12. Is Now The Time To Buy Pangaea?
Updated: March 28, 2026 at 10:12 PM EDT
Before investing in or passing on Pangaea, we urge you to understand the company’s business quality (or lack thereof), valuation, and the latest quarterly results - in that order.
Pangaea isn’t a terrible business, but it isn’t one of our picks. Although its revenue growth was impressive over the last five years and is expected to accelerate over the next 12 months, its projected EPS for the next year is lacking. And while the company’s rising cash profitability gives it more optionality, the downside is its declining EPS over the last four years makes it a less attractive asset to the public markets.
Pangaea’s P/E ratio based on the next 12 months is 27.4x. While this valuation is reasonable, we don’t really see a big opportunity at the moment. We're pretty confident there are more exciting stocks to buy at the moment.
Wall Street analysts have a consensus one-year price target of $10.85 on the company (compared to the current share price of $6.42).
Although the price target is bullish, readers should exercise caution because analysts tend to be overly optimistic. The firms they work for, often big banks, have relationships with companies that extend into fundraising, M&A advisory, and other rewarding business lines. As a result, they typically hesitate to say bad things for fear they will lose out. We at StockStory do not suffer from such conflicts of interest, so we’ll always tell it like it is.