
Tesla (TSLA)
Tesla is in for a bumpy ride. Its poor sales growth and falling returns on capital suggest its growth opportunities are shrinking.― StockStory Analyst Team
1. News


2. Summary
Why Tesla Is Up For Debate
Originally founded by Martin Eberhard and Marc Tarpenning in 2003, Tesla (NASDAQ:TSLA) is an electric vehicle company accelerating the world’s transition to sustainable energy.
- Tesla's scale advantage in EV production leads to gross margins that exceed incumbents such as General Motors and Ford. However, a softer macroeconomic backdrop and tariff pressures have weighed on automobile sales, which are highly cyclical.
- The company's execution ability is a question mark given its long history of delays, such as the Cybertruck and Robotaxi launches. Its sizeable investments in projects with uncertain return timelines, like Optimus, also raise skepticism from investors.
- On the bright side, Tesla's Megapack product solves a critical problem for utilities needing renewable energy storage solutions. This innovation has made the energy segment the most profitable and fastest-growing business line for the company.


Tesla is an elite auto manufacturer, but it must commercialize autonomous driving or its energy solutions for the stock to be a home run.
Why There Are Better Opportunities Than Tesla


At $360.45 per share, Tesla trades at 188.1x forward price-to-earnings. This valuation multiple seems a bit much considering the quality you get.
We prefer to invest in similarly-priced but higher-quality companies with superior earnings growth.
3. Tesla (TSLA) Research Report: Q4 CY2025 Update
Electric vehicle pioneer Tesla (NASDAQ:TSLA) missed Wall Street’s revenue expectations in Q4 CY2025, with sales falling 3.1% year on year to $24.9 billion. Its non-GAAP profit of $0.50 per share was 10.8% above analysts’ consensus estimates.
Tesla (TSLA) Q4 CY2025 Highlights:
- Vehicles Delivered: 418,227 vs analyst estimates of 428,536 (2.4% miss)
- Revenue: $24.9 billion vs analyst estimates of $25.12 billion (0.9% miss)
- Operating Profit (GAAP): $1.41 billion vs analyst estimates of $1.29 billion (8.8% beat)
- EPS (non-GAAP): $0.50 vs analyst estimates of $0.45 (10.8% beat)
- Automotive Revenue: $17.69 billion vs analyst estimates of $17.92 billion (1.3% miss)
- Energy Revenue: $3.84 billion vs analyst estimates of $3.86 billion (small miss)
- Services Revenue: $3.37 billion vs analyst estimates of $3.38 billion (small miss)
- Gross Margin: 20.1%, up from 16.3% in the same quarter last year
- Operating Margin: 5.7%, in line with the same quarter last year
- Free Cash Flow Margin: 5.7%, down from 7.9% in the same quarter last year
- Market Capitalization: $1.43 trillion
Key Topics & Areas Of Debate
The vast majority of Tesla’s revenue (73.3%) comes from electric vehicle (EV) sales, making metrics like units delivered and average sale price crucial for our analysis. However, two emerging questions are shifting the conversation beyond just car sales.
Can the Services segment - mainly consisting of low-margin maintenance and repairs today - decouple from vehicle sales with Tesla’s new AI-driven products?
Sparking hope for bulls are new technologies like Full Self-Driving (FSD) and a potential robotaxi fleet. If successfully commercialized, they could not only supercharge top-line growth but also lift Services gross margin from the high-single-digit percentages.
The second question is whether Tesla’s Energy Generation and Storage division could approach the value of its automotive business. While this may seem farfetched since Energy contributed just 13.5% of revenue last year, a case can be made.
GenAI applications could be the catalyst that accelerates this business as they require vast amounts of computational power. Furthermore, as energy disruptions from extreme weather become more frequent, Tesla’s products could emerge as critical infrastructure.
One standout product we’re closely watching in the Energy segment is the Megapack, a large-scale battery system that stores and distributes massive amounts of electricity. Each Megapack can power 100 to 150 homes for 24 hours and sells for over $1 million. Megapacks also have higher margins than EVs - in fact, a single Megapack sale generates as much operating profit as around 100 Tesla automobiles.
If Tesla can scale its Energy business and expand its software Services offerings, the growth potential is enormous and could settle the debate once and for all.
4. Company Overview
Originally founded by Martin Eberhard and Marc Tarpenning in 2003, Tesla (NASDAQ:TSLA) is an electric vehicle company accelerating the world’s transition to sustainable energy.
Elon Musk entered the equation in 2004 when he saw Tesla's initial prototype and led its Series A investment round. Musk assumed the CEO position in October 2008 after the company released its debut vehicle, the Roadster, a breakthrough for EVs because it was the first fully electric sports car.
Since then, Tesla has released more models including the Model S in 2012 (luxury sedan), the Model X in 2015 (luxury SUV), the Model 3 in 2017 (mass-market sedan), and the Model Y in 2019 (mass-market SUV). The most recent addition was the Cybertruck in 2023.
To make its cars, the company leverages a vertically integrated approach, meaning it does everything from designing and manufacturing to selling and servicing (rather than through dealerships). Competitors in the automobile manufacturing sector include Ford (NYSE:F), General Motors (NYSE:GM), Rivian (NASDAQ:RIVN), and Toyota (TSE:7203).
In addition to automotive sales, maintenance, and servicing, Tesla generates recurring subscription revenue from services such as Full Self-Driving. Energy is another emerging business and comprises everything from solar panels and battery systems to industrial-sized energy storage. These products are largely divorced from EVs and available for customers of all shapes and sizes.
5. Revenue Growth
Tesla shows that fast growth and massive scale can coexist despite conventional wisdom. The company’s revenue base of $31.54 billion five years ago has tripled to $94.83 billion in the last year, translating into an incredible 24.6% annualized growth rate.
Over the same period, Tesla’s automotive peers Rivian, General Motors, and Ford put up annualized growth rates of 76.9%, 8.6%, and 9.2%, respectively. Just note that while Rivian has the most similar vehicles to Tesla, comparisons aren’t exactly apples-to-apples because it’s growing from a much smaller revenue base. 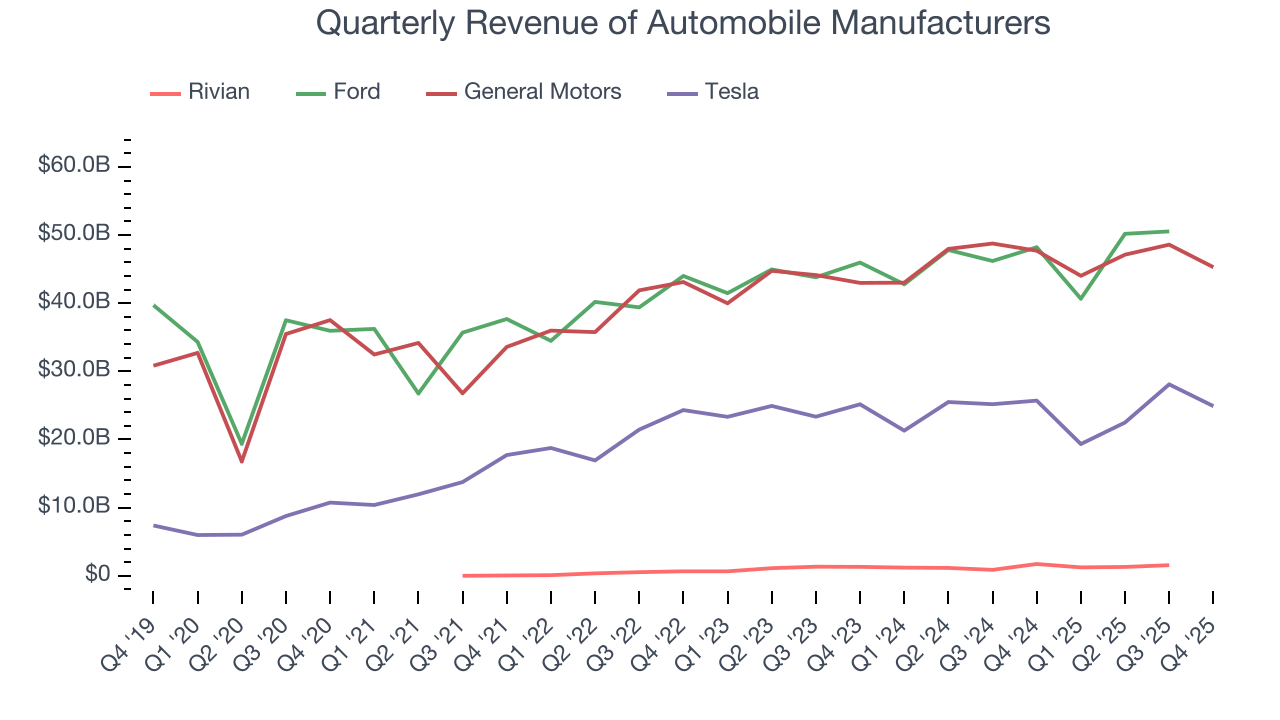
Long-term growth reigns supreme in fundamentals, but for disruptive companies like Tesla, a half-decade historical view may miss emerging trends in autonomous vehicles and energy. Tesla’s recent performance marks a sharp pivot from its five-year trend as its revenue has shown annualized declines of 1% over the last two years. 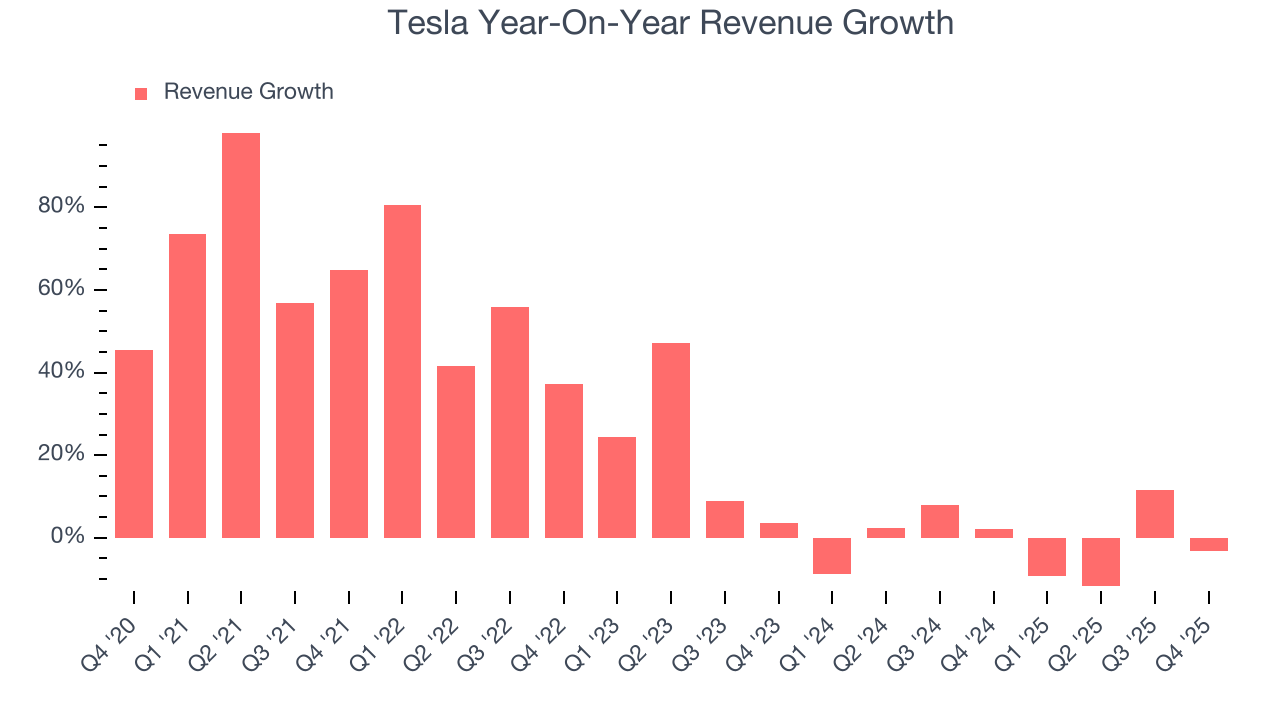
This quarter, Tesla missed Wall Street’s estimates and reported a rather uninspiring 3.1% year-on-year revenue decline, generating $24.9 billion of revenue. Looking ahead, sell-side This projection is admirable for a company of its scale and illustrates the market is baking in success for its newer products.
6. Automotive: Act One
Revenue: The Race For Dominance
Tesla is primarily an automobile manufacturer today and generates 73.3% of its revenue through the sale and leasing of EVs. It historically produced expensive, high-end EVs, but after years of operating losses, has shifted its focus to the mass market with affordable vehicles. The Model 3 and Model Y (released in 2017 and 2019) are the headliners of this story, and we’ll dive into their impacts below.
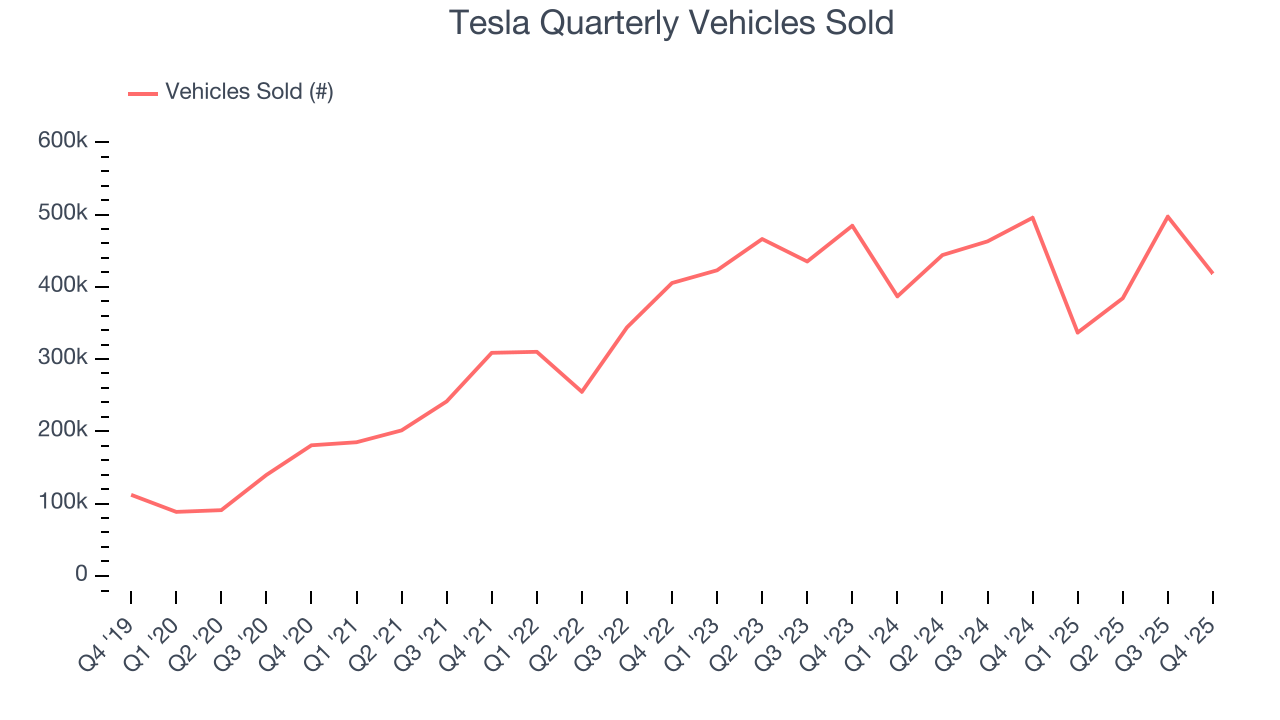
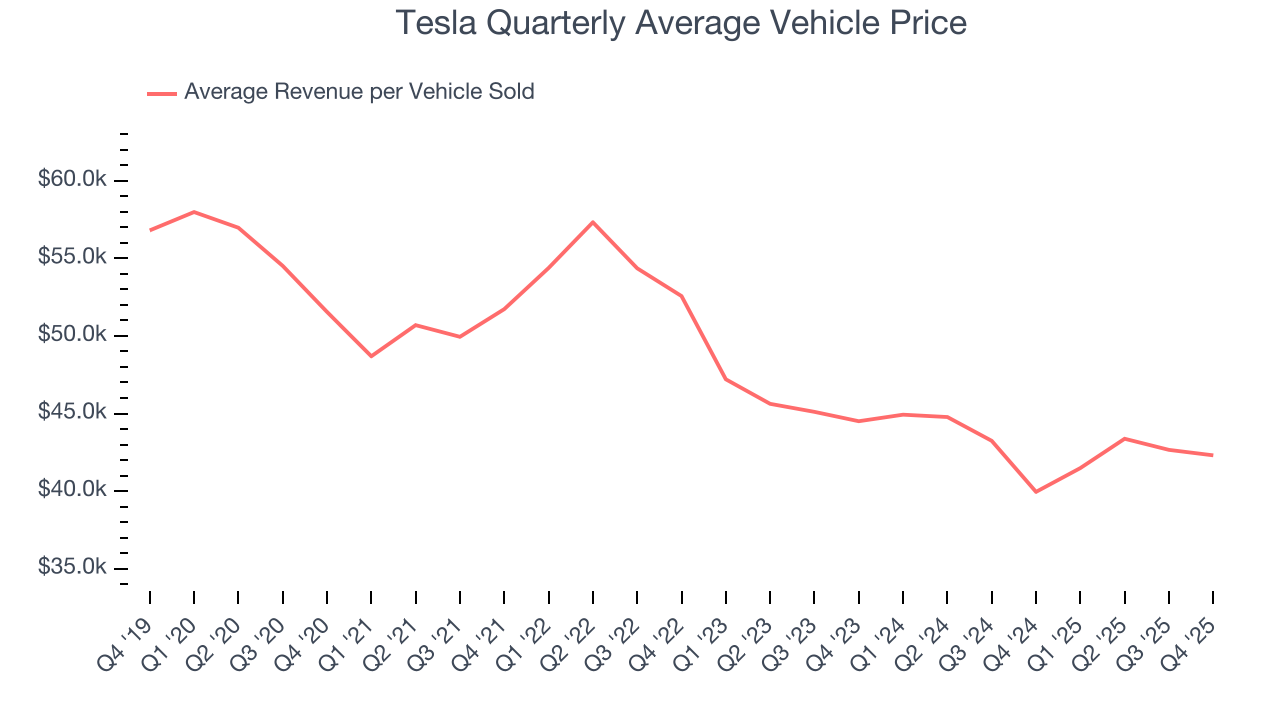
Over the last five years, Tesla’s vehicles sold grew by 26.8% annually to 1.64 million units in the last year. This is above the its 20.6% annualized growth rate for Automotive revenue, implying that its average vehicle price fell.
Specifically, Tesla's average revenue per vehicle sold was $42,494 for the trailing 12 months, noticeably lower than the $54,510 price tag in 2020.
These unit and pricing trends uncover three facets of the company’s automotive business:
1) It has achieved its goal of selling more Model 3 and Model Y vehicles, which carry lower price tags than other models, 2) the scaling production of its mass-market models is boosting manufacturing efficiency because it lowers the fixed cost per vehicle sold, and 3) rather than increasing profitability by reaping the cost-saving benefits, Tesla is passing them to customers through price reductions.
In Q4, Tesla’s vehicles sold shrank by 15.6% year on year to 418,227 units and missed Wall Street’s expectations. Putting this print side-by-side with its 10.6% Automotive revenue decline suggests an average vehicle price of $42,305, up from $39,950 in the same quarter last year.
Unit Economics: The Impact Of Price Cuts
There’s no denying automobile manufacturing is a tough business. Few upstarts succeed because incumbents like General Motors and Ford can afford to break even on the initial sale of vehicles and instead make money on parts and servicing, which come many years down the line.
Tesla does not disclose the operating profitability of its segments, but we can analyze the gross margins of its various divisions to see how it stacks up. For Automotive, this metric reflects how much revenue is left after paying for the raw materials, components, and direct labor costs that go into manufacturing and producing its vehicles.
Thankfully for investors, Tesla has crossed the chasm as its Automotive segment boasted an average gross margin of 22.2% over the last five years. While it may be low in absolute terms, Tesla’s margin was best in class for the industry and illustrates its superior pricing power and procurement capabilities. Its breathing room also explains why the company can squeeze its competitors by slashing prices.
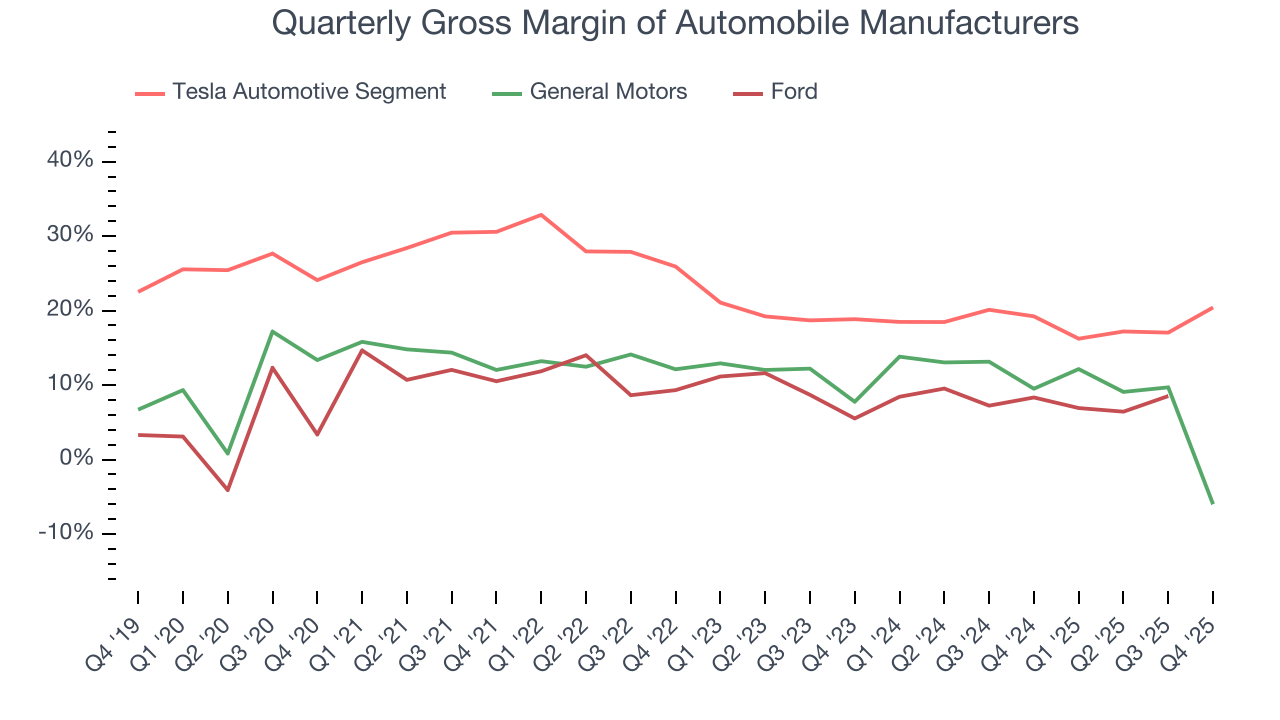
Looking under the hood, Automotive’s annual gross margin fell from 25.6% five years ago to 17.8% in the last year. This is a direct result of its price cuts and shows the company is sacrificing higher profits today to increase its installed base and potentially secure longer-term recurring revenue streams. The trend improved this quarter as its gross margin rose to 20.4%, but we wouldn’t put too much weight on short-term results.
7. Services and Energy: The Key Debate
Revenue: Powering The Business
Tesla is known for its EVs, but the biggest debate surrounding the stock isn’t directly tied to car sales. What the market ponders is whether Services (13.2% of total revenue) and Energy Generation and Storage (13.5% of total revenue) can become much more vital parts of its business. Services has recurring revenue characteristics and a pipeline of bold new AI-driven products while Energy has higher margins than Automotive and a huge underpenetrated market opportunity. You can see why there is excitement here.
Digging in, Services revenue grew at a 40.3% annualized rate over the last five years, 15.7 percentage points faster than total revenue. The previous two years saw deceleration as it grew by 22.7% annually, though this isn’t concerning since it’s still expanding quickly.
Switching to Energy, revenue grew at a fantastic five-year pace, clocking in at 45% annualized. This performance, like Services, trumped its total revenue growth by 20.3 percentage points. Its two-year annualized growth was also 45.5%, highlighting the consistent performance of this segment.
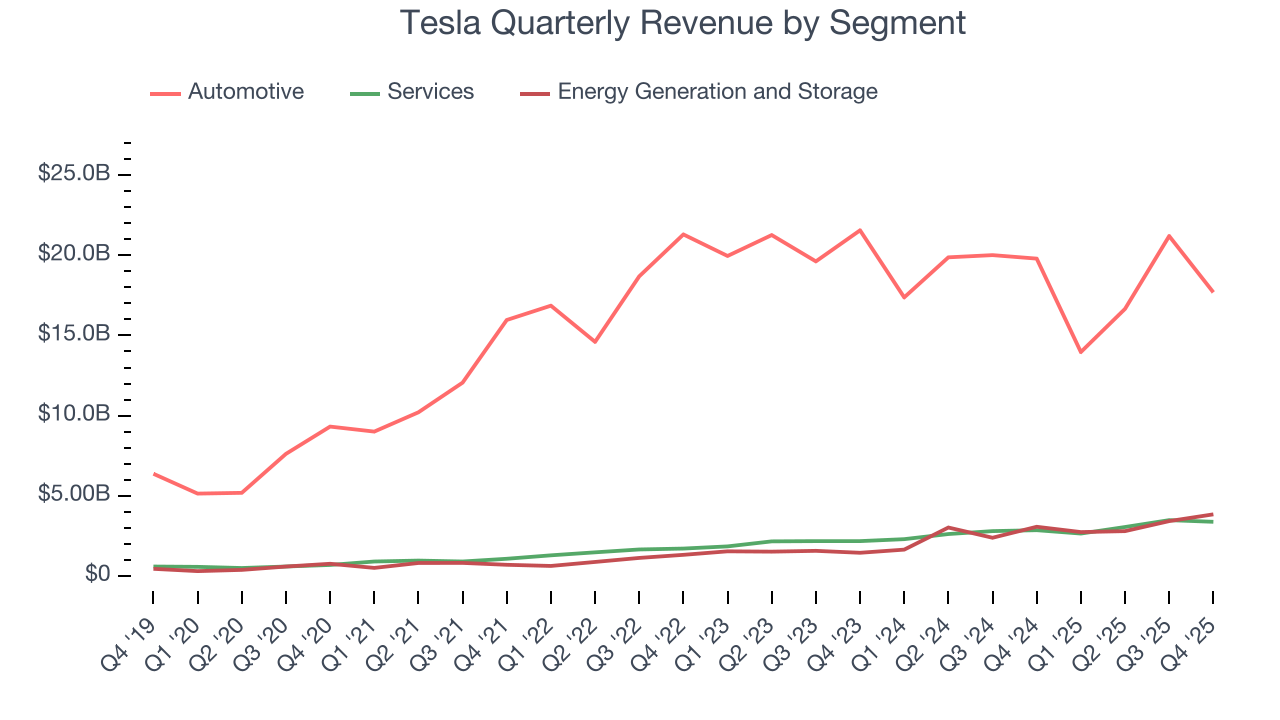
This quarter, total revenue fell by 3.1% year on year while Services and Energy grew by 18.4% and 25.4%, respectively. If this trend continues and it can consistently win EV market share, Tesla’s stock price could see some support.
Unit Economics: What Can Supercharge Profitability?
Energy is currently Tesla’s shining star as it’s the fastest-growing and most profitable segment. It posted a gross margin of 29.8% over the past 12 months, up from breakeven five years ago. Once the renewable energy market matures, margins could certainly rise further if the company continues developing premium products like the Megapack, an innovative battery system that stores and distributes electricity.
Conversely, Services has much to prove as its paltry gross margin of 7.4% over the last year was a drag on the company’s overall unit economics. This margin is underwhelming because the business mainly consists of physical parts and repairs. It’s also surprisingly below Ford and General Motors’s 15-25% for the segment - a wide gap exists because the EV supply chain and ecosystem are less developed, resulting in higher servicing costs for Tesla.
Although we typically assess long-term historical trends, they aren’t as relevant for Services. The debate centers around whether Full Self-Driving (FSD) and robotaxis will ever be fully commercialized, and their impacts aren’t reflected in company financials yet. We lack details and management guidance on these ventures, but bulls would argue that margins could move structurally higher if these revenue sources scale. Bears would argue these business lines are a pipe dream.
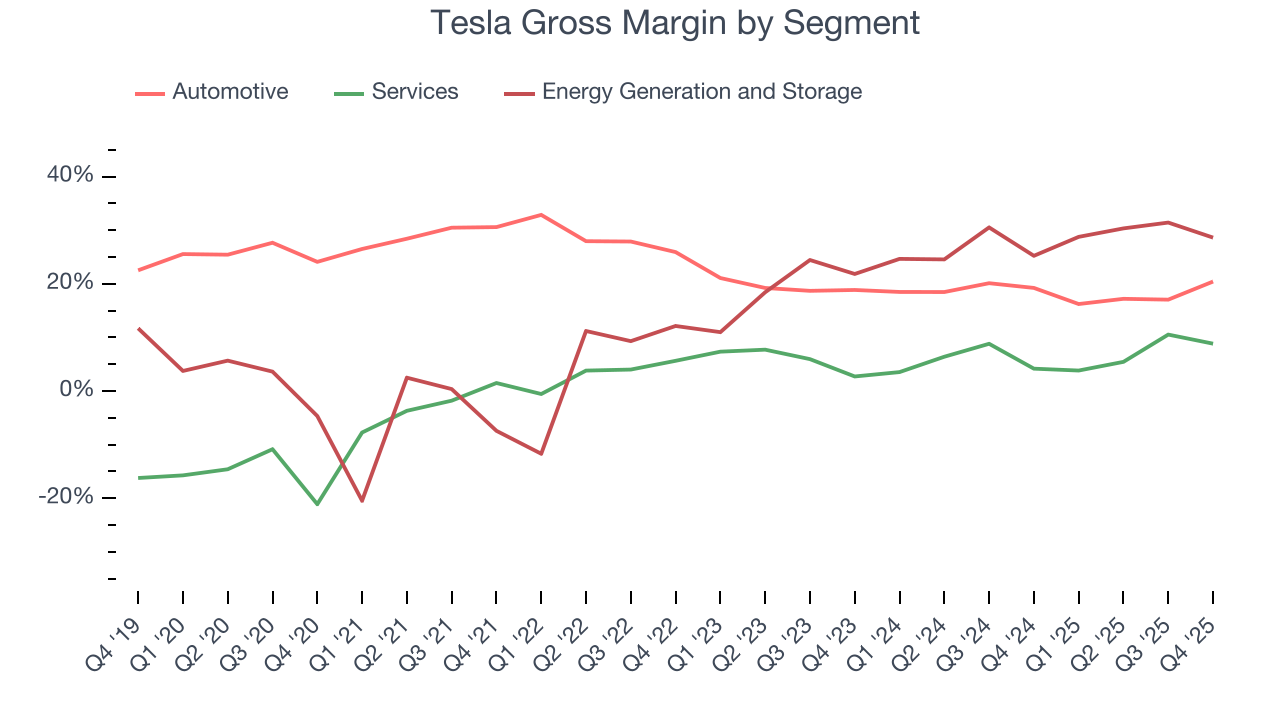
This quarter, Services and Energy produced gross margins of 8.8% and 28.6%, respectively, encouraging signs as they both eclipsed their five-year averages (5.2% for Services and 21.8% for Energy). Energy was particularly noteworthy as it also exceeded the core Automotive segment.
We’ll keep a close eye on Tesla from here. Should any of the company’s ambitious bets (FSD, robotaxis, Megapacks) succeed, bulls will be rewarded handsomely because revenue and profitability would surge, allowing the market to assign the stock a premium valuation multiple due to the higher proportion of recurring, higher-margin, and secular revenue streams. However, if these initiatives fail to materialize or take longer than expected, shareholders could be in for a bumpy ride.
8. Profitability
While gross margins showcase the unit economics of a business, operating margin is a more holistic measure of profitability because it displays the portion of revenue remaining after subtracting all day-to-day expenses, including the cost of sales we talked about earlier to selling, marketing, product development, salaries, and rent.
Segments aside, Tesla’s consolidated gross margin averaged 20.4% over the last five years, a tough starting point for operating profits. Its average operating of 9.5% at that time was uninspiring for a scaled an industrials business and shows it was held back by its large cost base.
Analyzing the trend in its profitability, Tesla’s operating decreased by 7.5 percentage points over the last five years. This raises questions about the company’s expense base because its revenue growth should have given it leverage on its fixed costs, resulting in better economies of scale and profitability. Tesla’s performance was poor no matter how you look at it - it shows that costs were rising and it couldn’t pass them onto its customers. Its margin trajectory could reverse in the future if it can sell more EVs (to further sweat its fixed cost base) and scale its high-potential Services and Energy businesses.
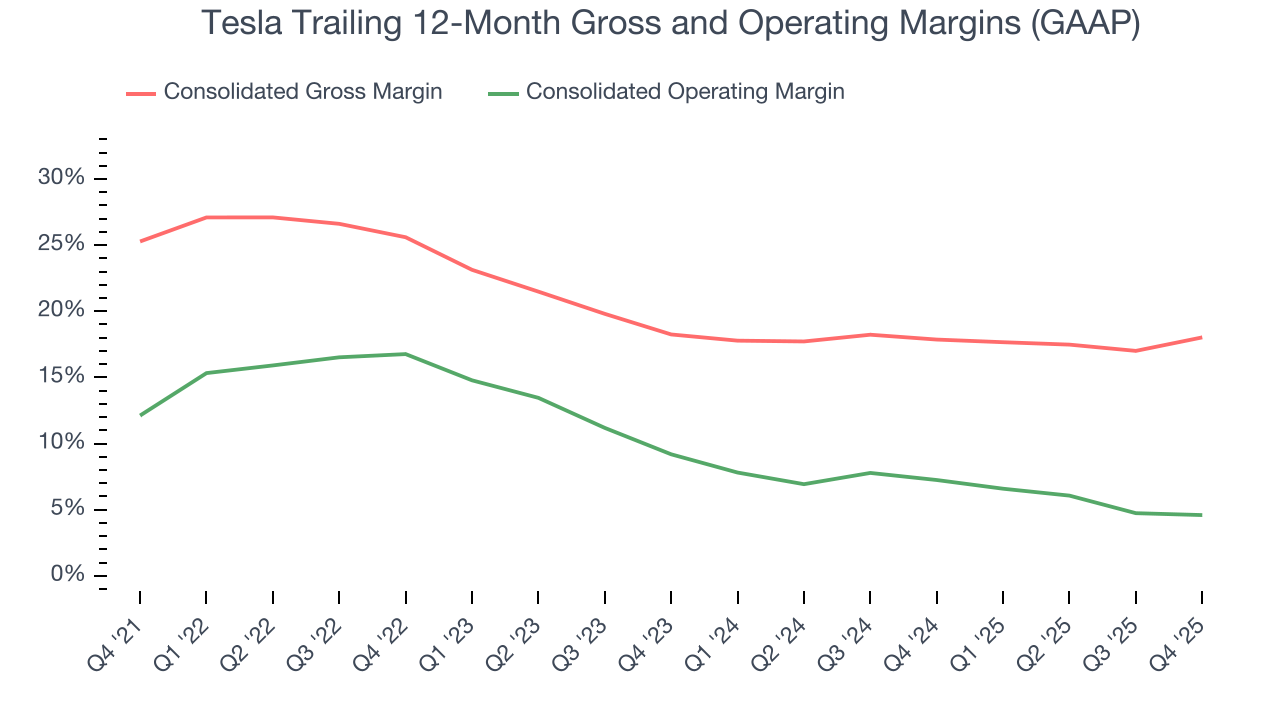
In Q4, Tesla generated an operating profit margin of 5.7%, in line with the same quarter last year. This indicates the company’s cost structure has recently been stable.
In the coming year, Wall Street expects Tesla to become more profitable. Analysts are expecting the company’s trailing 12-month operating of 4.6% to rise to 6.3%.
9. Earnings Per Share
We track the long-term change in earnings per share (EPS) alongside revenue and margins because it shows whether a company’s growth is profitable and what else affects shareholder returns.
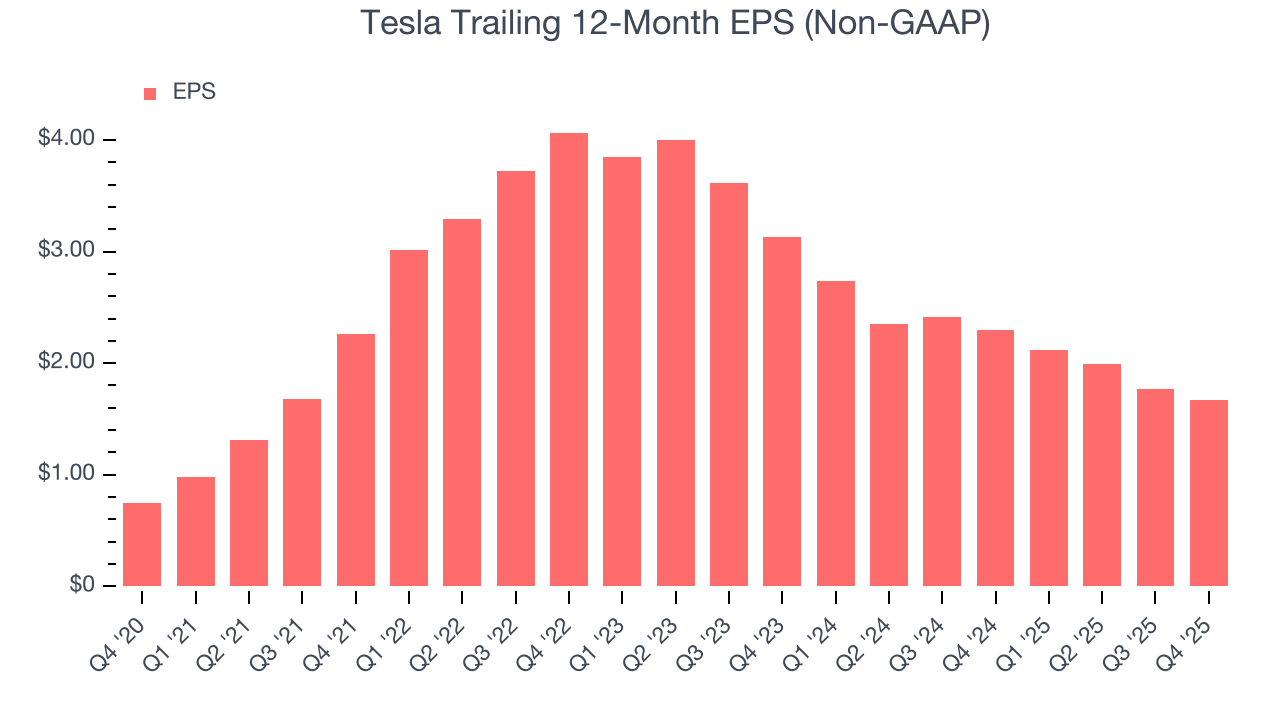
Tesla’s EPS grew at an astounding 17.6% compounded annual growth rate over the last five years. However, this performance was lower than its 24.6% annualized revenue growth, telling us the company became less profitable on a per-share basis as it expanded.
We can take a deeper look into Tesla’s earnings quality to better understand the drivers of its performance. As we mentioned earlier, Tesla’s operating was flat this quarter but declined by 7.5 percentage points over the last five years. Its share count also grew by 5%, meaning the company not only became less efficient with its operating expenses but also diluted its shareholders. 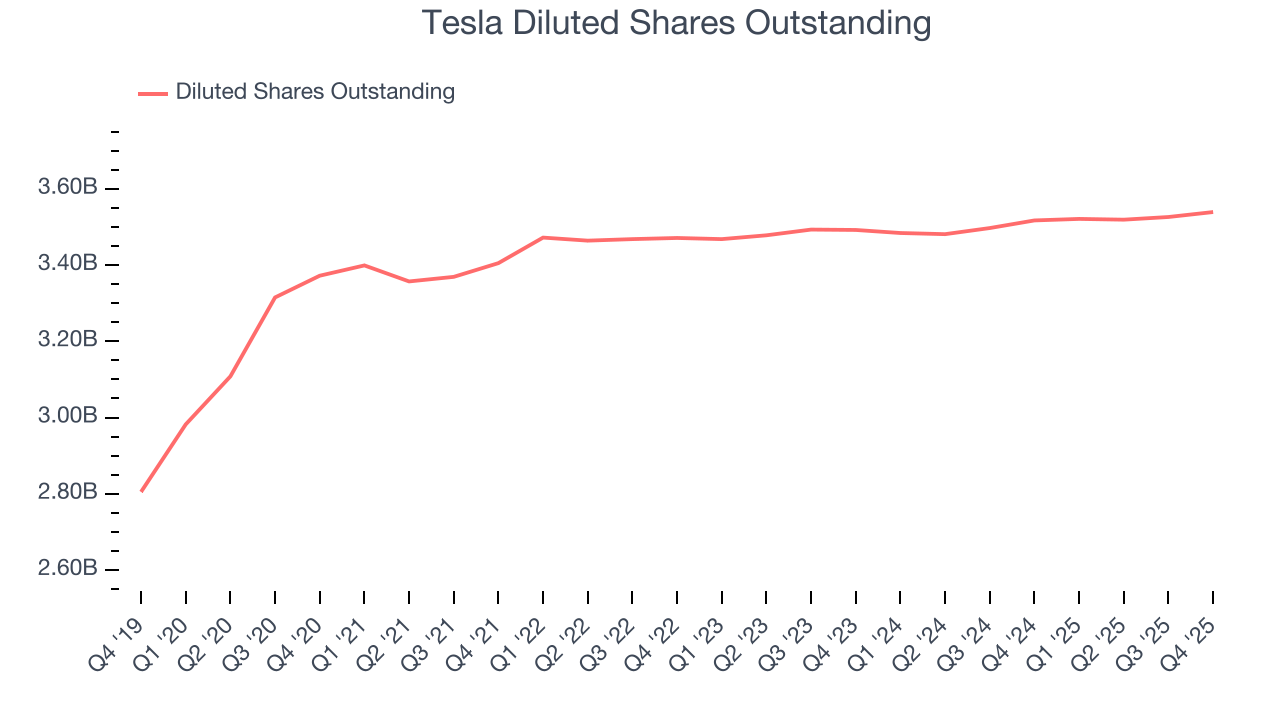
Like with revenue, we analyze EPS over a more recent period because it can provide insight into an emerging theme or development for the business.
For Tesla, its two-year annual EPS declines of 27% mark a reversal from its (seemingly) healthy five-year trend. These shorter-term results were driven by its EV price cuts. We hope Tesla can return to earnings growth in the future.
In Q4, Tesla reported adjusted EPS of $0.50, down from $0.60 in the same quarter last year. Despite falling year on year, this print easily cleared analysts’ estimates. Over the next 12 months, Wall Street expects Tesla’s full-year EPS of $1.67 to grow 26.6%.
10. Cash Is King
If you’ve followed StockStory for a while, you know we emphasize free cash flow. Why, you ask? We believe that in the end, cash is king, and you can’t use accounting profits to pay the bills or invest for the future.
Tesla has shown poor cash profitability over the last five years, giving the company limited opportunities to return capital to shareholders. Its free cash flow margin averaged 6.3%, lousy for an industrials business.
Taking a step back, we can see that Tesla’s margin dropped by 2.8 percentage points during that time. It may have ticked higher more recently, but shareholders are likely hoping for its margin to at least revert to its historical level. If the longer-term trend returns, it could signal it is in the middle of an investment cycle as it pursues new AI technologies such as a robotaxi or humanoid robot fleet.
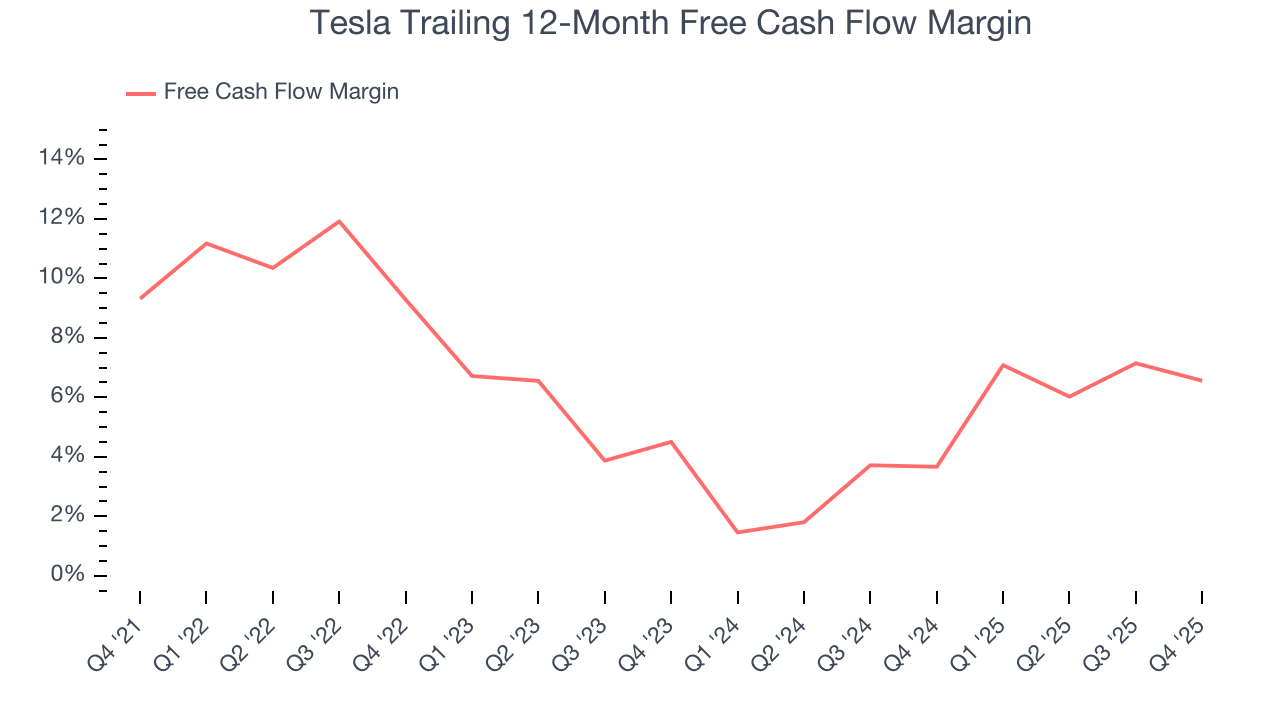
Tesla’s free cash flow clocked in at $1.42 billion in Q4, equivalent to a 5.7% margin. The company’s cash profitability regressed as it was 2.2 percentage points lower than in the same quarter last year, suggesting its historical struggles have dragged on.
Over the next year, analysts predict Tesla’s cash conversion will fall. Their consensus estimates imply its free cash flow margin of 6.6% for the last 12 months will decrease to 3.9%.
11. Return on Invested Capital (ROIC)
EPS and free cash flow tell us whether a company was profitable while growing its revenue. But was it capital-efficient? A company’s ROIC explains this by showing how much operating profit it makes compared to the money it has raised (debt and equity).
Although Tesla hasn’t been the highest-quality company lately, it found a few growth initiatives in the past that worked out wonderfully. Its five-year average ROIC was 28.6%, splendid for an industrials business.
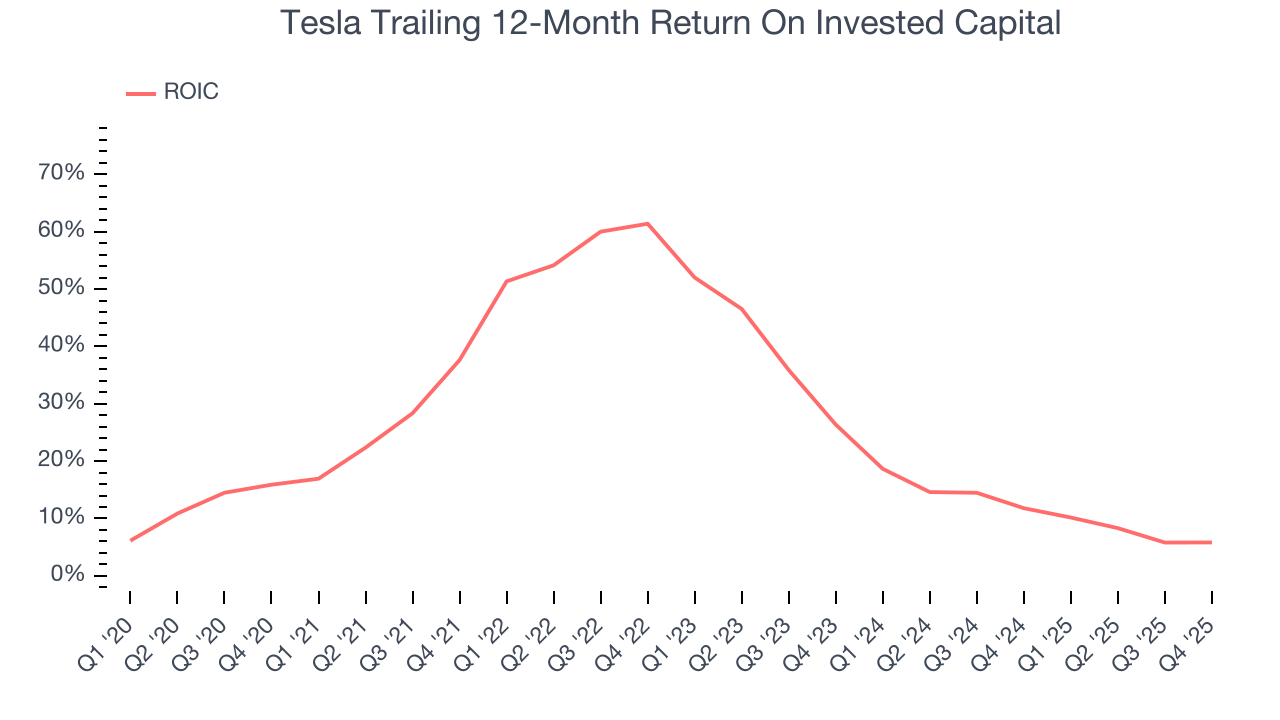
We like to invest in businesses with high returns, but the trend in a company’s ROIC is what often surprises the market and moves the stock price. While Tesla’s ROIC fell recently due to its price cuts, the broader trend is still healthy as its ROIC is higher than a few years ago. This is because it’s investing aggressively to capture the AI opportunity. Only time will tell if these investments bear fruit in higher long-term ROICs.
12. Balance Sheet Assessment
Big corporations like Tesla are attractive to many investors in times of instability thanks to their fortress balance sheets that buffer pockets of soft demand.
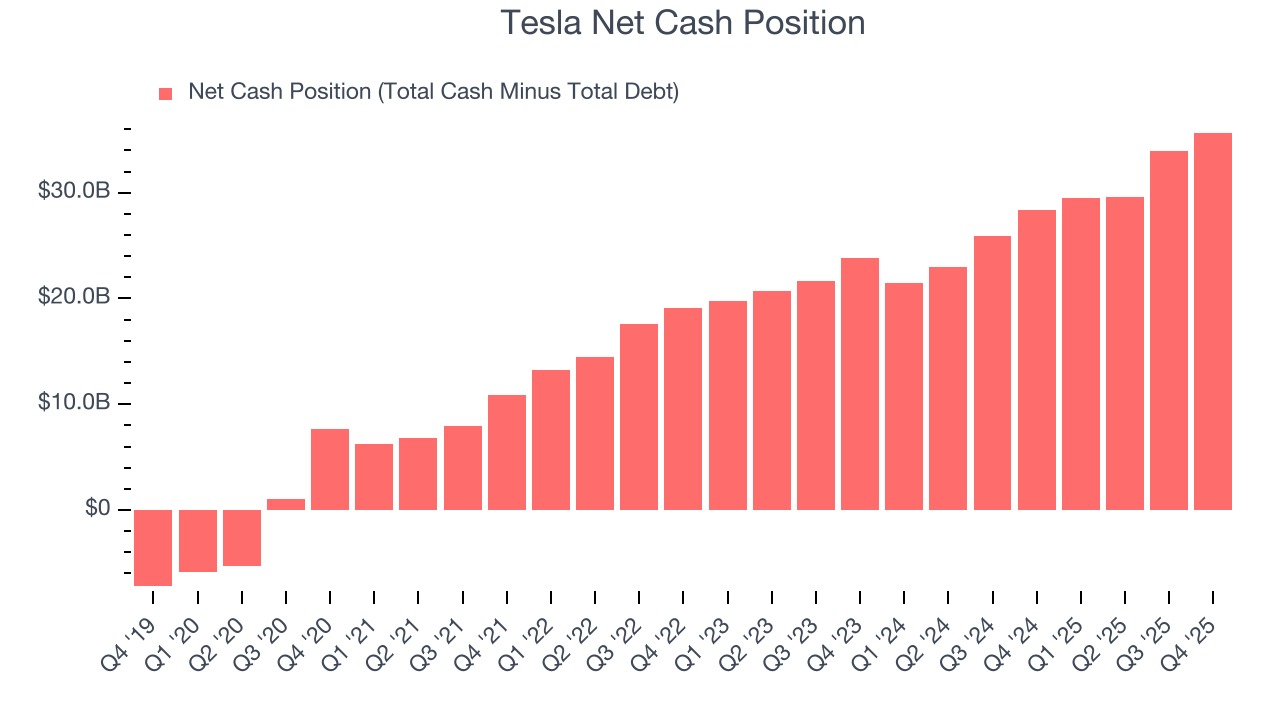
Tesla has an eye-popping $44.06 billion of cash on its balance sheet (that’s no typo) compared to $8.38 billion of debt. This $35.68 billion net cash position is 2.5% of its market cap and shockingly larger than the value of most public companies, giving it the freedom to borrow money, return capital to shareholders, or invest in growth initiatives. Leverage is not an issue here.
13. Key Takeaways from Tesla’s Q4 Results
We enjoyed seeing Tesla beat analysts’ operating income expectations this quarter. We were also glad its EPS outperformed Wall Street’s estimates. On the other hand, its revenue slightly missed and its revenue fell short of Wall Street’s estimates, as Automotive missed while Services and Energy was in line. Overall, this quarter was mixed. The stock traded up 2% to $439.12 immediately after reporting.
14. Is Now The Time To Buy Tesla?
Updated: March 27, 2026 at 11:40 PM EDT
When considering an investment in Tesla, investors should account for its valuation and business qualities as well as what’s happened in the latest quarter.
Tesla falls short of our quality standards. Although its superb long-term revenue growth driven by Energy underscores its exciting and untapped market opportunity, its falling returns show it may be getting harder to find good investments. And while the company’s stellar ROIC suggests it has historically done an exceptional job picking markets to invest in, the downside is its operating margin decline fuels the bear argument.
Tesla’s price-to-earnings ratio based on the next 12 months is 188.1x. This multiple tells us a lot of good news is priced in - we think there are better opportunities elsewhere.
Wall Street analysts have a consensus one-year price target of $421.27 on the company (compared to the current share price of $360.45).
Although the price target is bullish, readers should exercise caution because analysts tend to be overly optimistic. The firms they work for, often big banks, have relationships with companies that extend into fundraising, M&A advisory, and other rewarding business lines. As a result, they typically hesitate to say bad things for fear they will lose out. We at StockStory do not suffer from such conflicts of interest, so we’ll always tell it like it is.