Kirby (KEX)
Kirby is interesting. Its expanding operating margin shows it’s becoming a more efficient business.― StockStory Analyst Team
1. News


2. Summary
Why Kirby Is Interesting
Transporting goods along all U.S. coasts, Kirby (NYSE:KEX) provides inland and coastal marine transportation services.
- Incremental sales over the last five years have been highly profitable as its earnings per share increased by 28% annually, topping its revenue gains
- High free cash flow margin compared to the broader industry gives it optionality, and its recently improved profitability means it has more resources to invest or distribute
- On the flip side, its underwhelming 3.8% return on capital reflects management’s difficulties in finding profitable growth opportunities


Kirby shows some promise. If you like the stock, the valuation seems reasonable.
Why Is Now The Time To Buy Kirby?


Kirby is trading at $124.94 per share, or 18.3x forward P/E. Kirby’s valuation is lower than that of many in the industrials space. Even so, we think it is justified for the revenue growth characteristics.
If you think the market is undervaluing the company, now could be a good time to build a position.
3. Kirby (KEX) Research Report: Q4 CY2025 Update
Marine transportation service company Kirby (NYSE:KEX) fell short of the markets revenue expectations in Q4 CY2025, but sales rose 6.2% year on year to $851.8 million. Its GAAP profit of $1.68 per share was 3.4% above analysts’ consensus estimates.
Kirby (KEX) Q4 CY2025 Highlights:
- Revenue: $851.8 million vs analyst estimates of $863.8 million (6.2% year-on-year growth, 1.4% miss)
- EPS (GAAP): $1.68 vs analyst estimates of $1.63 (3.4% beat)
- Adjusted EBITDA: $203.1 million vs analyst estimates of $191.8 million (23.8% margin, 5.9% beat)
- Operating Margin: 15.2%, up from 6.3% in the same quarter last year
- Free Cash Flow Margin: 31.1%, up from 18.8% in the same quarter last year
- Market Capitalization: $6.94 billion
Company Overview
Transporting goods along all U.S. coasts, Kirby (NYSE:KEX) provides inland and coastal marine transportation services.
Kirby was established in 1921 and initially focused on marine transportation services. Over the years, the company was able to expand its operations and fleet by targeting small to medium sized companies in the marine transportation industry. Specifically, acquisitions have focused on acquiring fleets of tank barges, towboats, and related assets.
Kirby specializes in transporting large amounts of liquid products, like chemicals and petroleum, using its fleet of tank barges and towboats which are owned and operated by the company. It serves big oil companies that need to move oil and refined fuels by rivers and along coasts, chemical manufacturers that need chemicals for making products delivered, and agricultural businesses that need fertilizers.
The process of making deliveries typically involves loading the liquid products onto the tank barges at production facilities or refineries located near waterways. Once loaded, the towboats navigate through inland waterways or along coastal routes with the barges to reach the destinations.
Kirby engages in long-term contracts with customers, typically spanning five to ten years. Pricing on these contracts are based on the volume of liquid cargo being transported, the distance and route of delivery, the type of vessel and equipment required, and any additional services or specialized requirements.
4. Marine Transportation
The growth of e-commerce and global trade continues to drive demand for shipping services, presenting opportunities for marine transportation companies. While ocean freight is more fuel efficient and therefore cheaper than its air and ground counterparts, it results in slower delivery times, presenting a trade off. To improve transit speeds, the industry continues to invest in digitization to optimize fleets and routes. However, marine transportation companies are still at the whim of economic cycles. Consumer spending, for example, can greatly impact the demand for these companies’ offerings while fuel costs can influence profit margins. Geopolitical tensions can also affect access to trade routes, and if certain countries are banned from using passageways like the Panama Canal, costs can spiral out of control.
Competitors offering similar products include SEACOR (NYSE:CKH), Marine Products (NYSE:MPX), and Gulf Island (NASDAQ:GIFI).
5. Revenue Growth
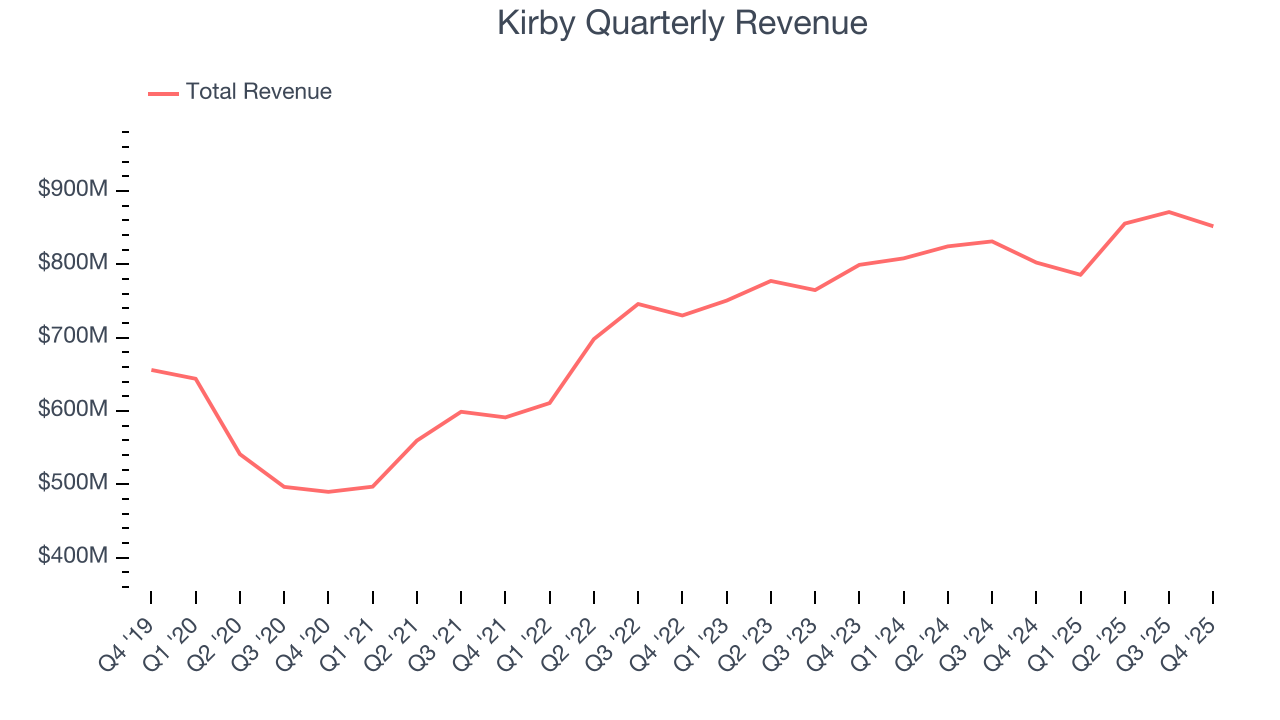
Reviewing a company’s long-term sales performance reveals insights into its quality. Any business can put up a good quarter or two, but the best consistently grow over the long haul. Thankfully, Kirby’s 9.2% annualized revenue growth over the last five years was solid. Its growth beat the average industrials company and shows its offerings resonate with customers.
We at StockStory place the most emphasis on long-term growth, but within industrials, a half-decade historical view may miss cycles, industry trends, or a company capitalizing on catalysts such as a new contract win or a successful product line. Kirby’s recent performance shows its demand has slowed as its annualized revenue growth of 4.3% over the last two years was below its five-year trend. We also note many other Marine Transportation businesses have faced declining sales because of cyclical headwinds. While Kirby grew slower than we’d like, it did do better than its peers. 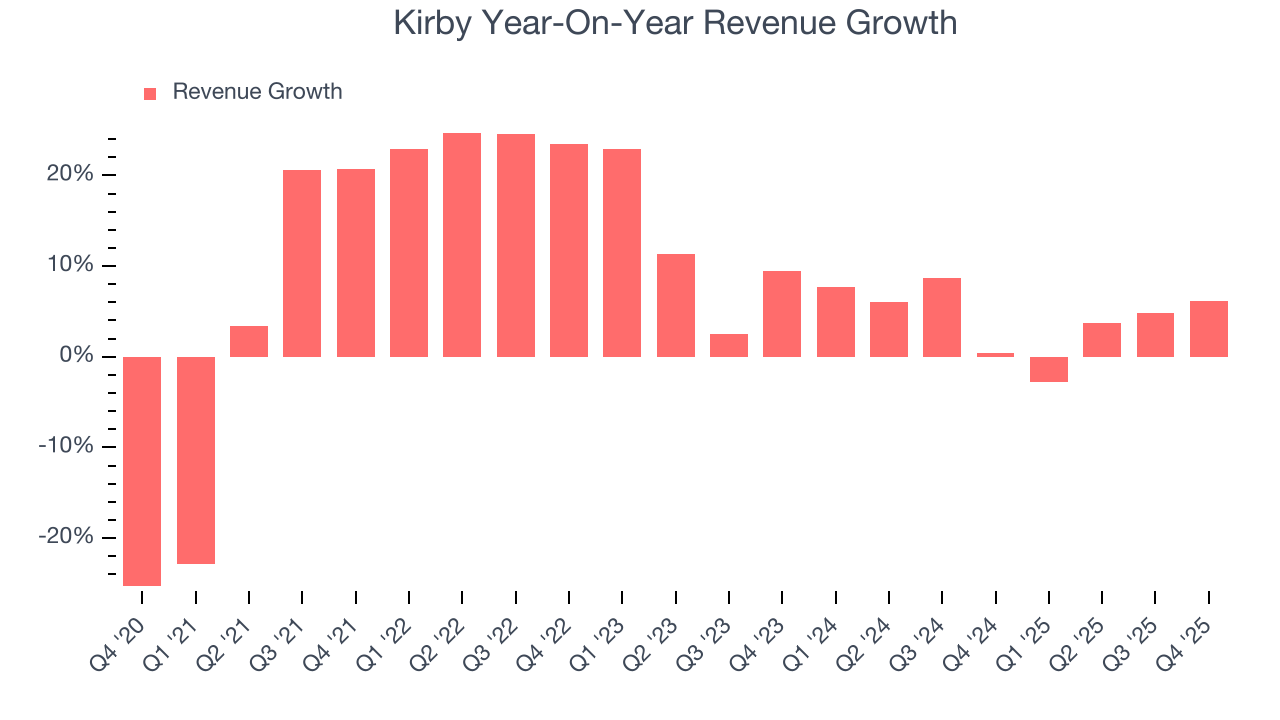
We can better understand the company’s revenue dynamics by analyzing its most important segments, Marine Transportation and Distribution and Services, which are 56.5% and 43.5% of revenue. Over the last two years, Kirby’s Marine Transportation revenue (petroleum products and chemicals) averaged 6.2% year-on-year growth while its Distribution and Services revenue (aftermarket parts and equipment) averaged 2.2% growth. 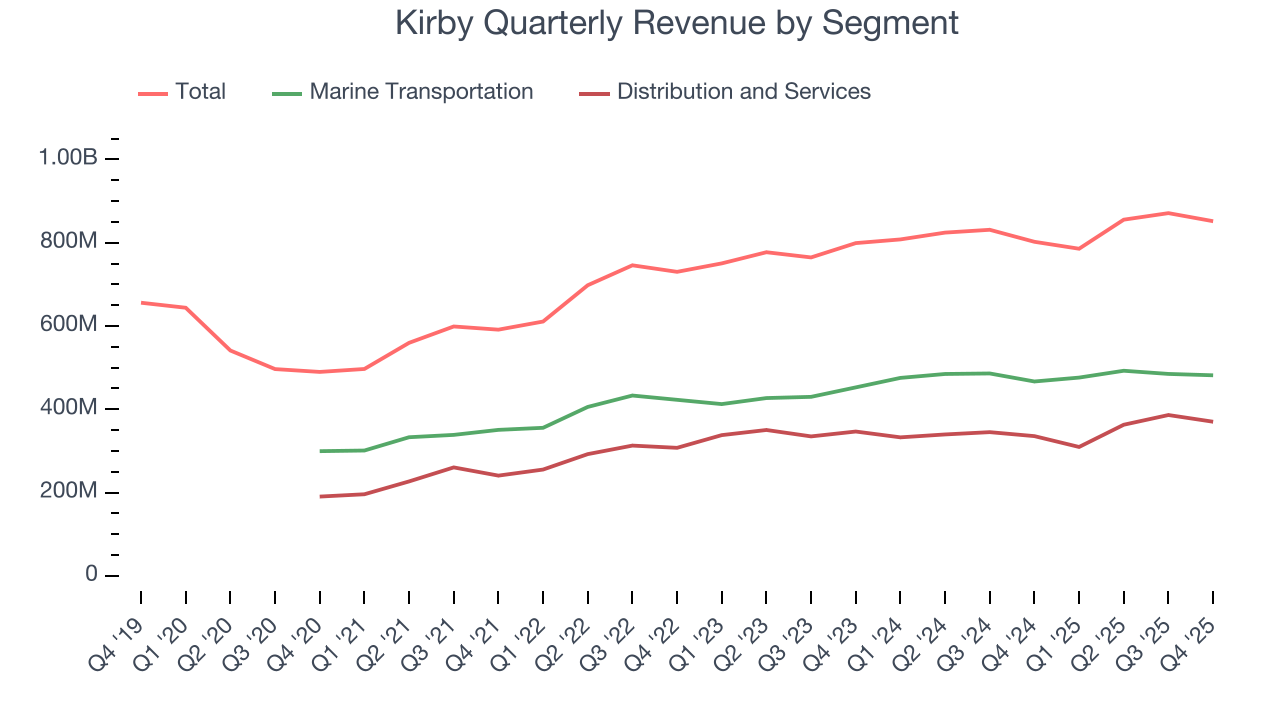
This quarter, Kirby’s revenue grew by 6.2% year on year to $851.8 million, missing Wall Street’s estimates.
Looking ahead, sell-side analysts expect revenue to grow 5.4% over the next 12 months, similar to its two-year rate. While this projection implies its newer products and services will spur better top-line performance, it is still below average for the sector.
6. Gross Margin & Pricing Power
Kirby’s gross margin is slightly below the average industrials company, giving it less room to invest in areas such as research and development. As you can see below, it averaged a 29.7% gross margin over the last five years. Said differently, Kirby had to pay a chunky $70.27 to its suppliers for every $100 in revenue. 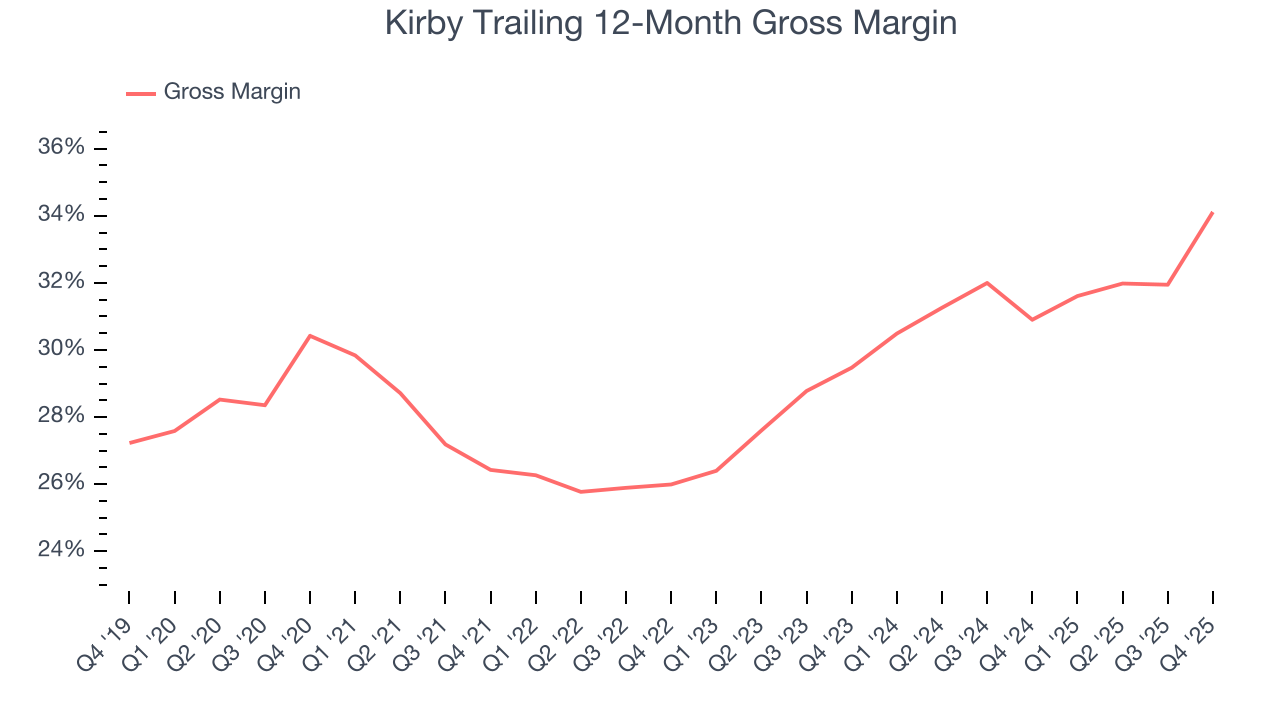
This quarter, Kirby’s gross profit margin was 34.2%, up 8.9 percentage points year on year. Kirby’s full-year margin has also been trending up over the past 12 months, increasing by 3.2 percentage points. If this move continues, it could suggest better unit economics due to more leverage from its growing sales on the fixed portion of its cost of goods sold (such as manufacturing expenses).
7. Operating Margin
Kirby was profitable over the last five years but held back by its large cost base. Its average operating margin of 7.9% was weak for an industrials business. This result isn’t too surprising given its low gross margin as a starting point.
On the plus side, Kirby’s operating margin rose by 26.2 percentage points over the last five years, as its sales growth gave it immense operating leverage. We’ll take Kirby’s improvement as many Marine Transportation companies saw their margins fall (along with revenue, as mentioned above) because the cycle turned in the wrong direction.
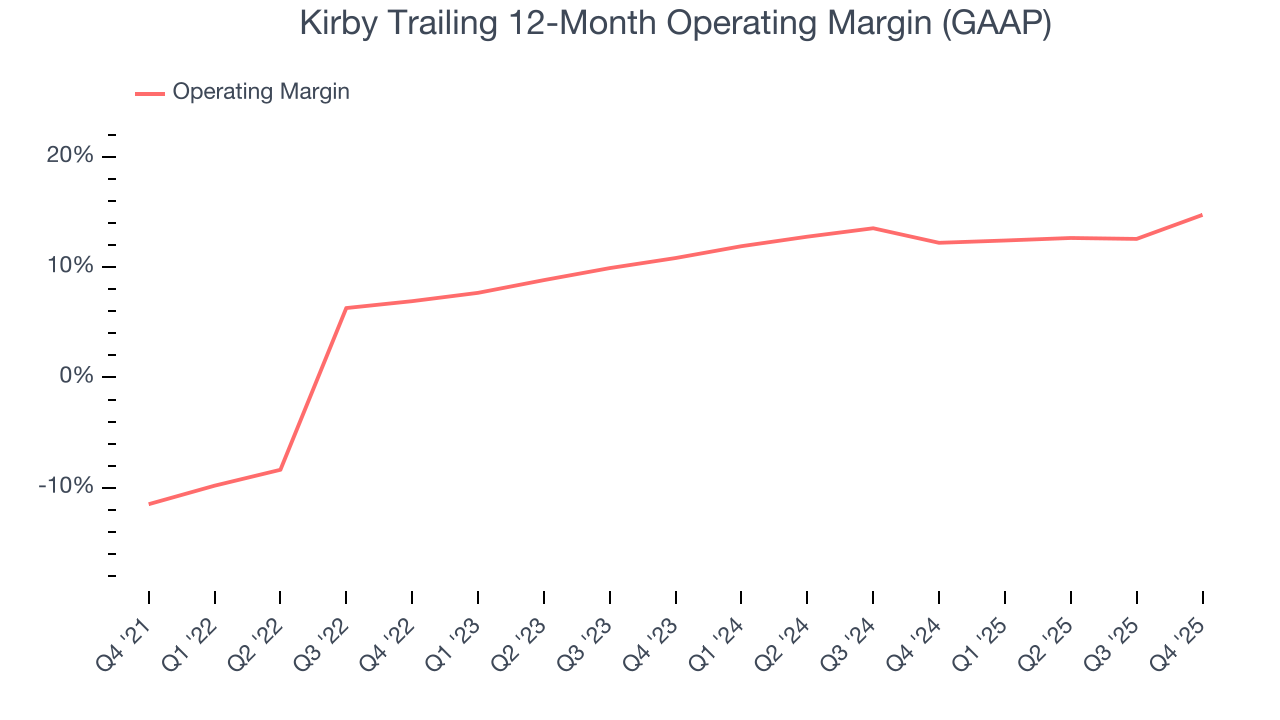
In Q4, Kirby generated an operating margin profit margin of 15.2%, up 9 percentage points year on year. The increase was solid, and because its operating margin rose more than its gross margin, we can infer it was more efficient with expenses such as marketing, R&D, and administrative overhead.
8. Earnings Per Share
Revenue trends explain a company’s historical growth, but the long-term change in earnings per share (EPS) points to the profitability of that growth – for example, a company could inflate its sales through excessive spending on advertising and promotions.
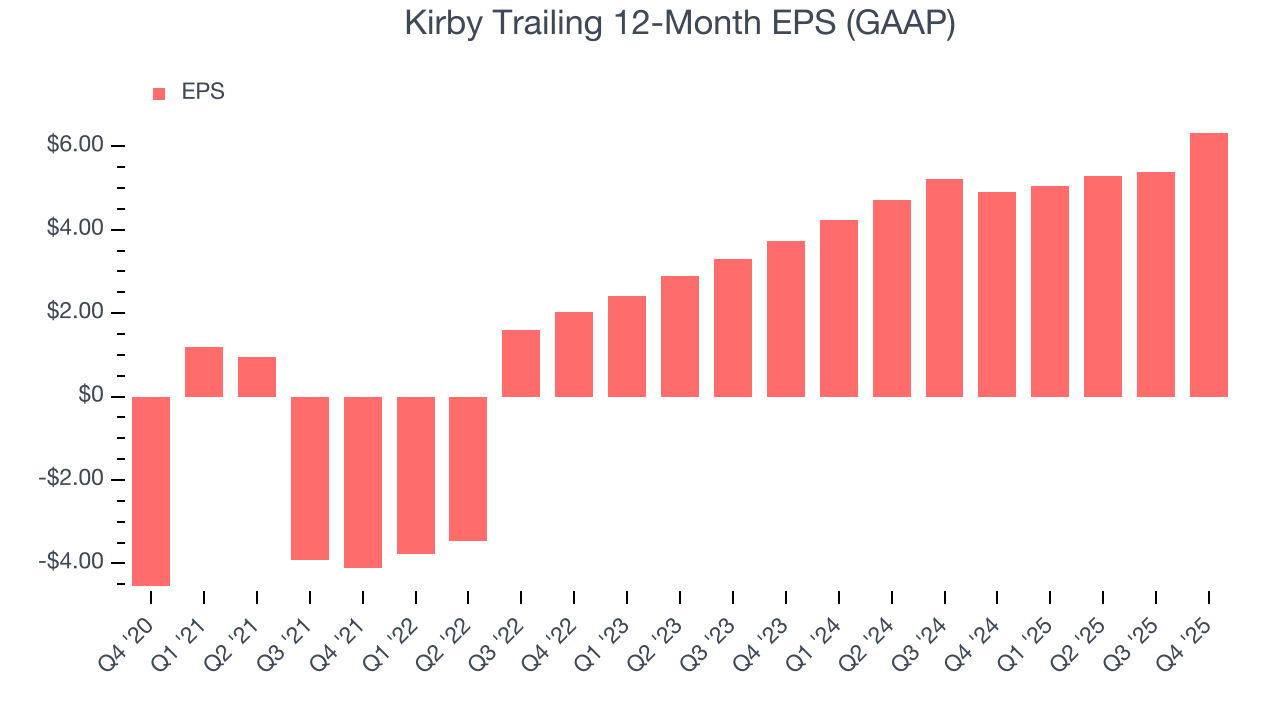
Kirby’s full-year EPS flipped from negative to positive over the last five years. This is a good sign and shows it’s at an inflection point.
Like with revenue, we analyze EPS over a shorter period to see if we are missing a change in the business.
Kirby’s EPS grew at an astounding 30.3% compounded annual growth rate over the last two years, higher than its 4.3% annualized revenue growth. This tells us the company became more profitable on a per-share basis as it expanded.
Diving into the nuances of Kirby’s earnings can give us a better understanding of its performance. Kirby’s operating margin has expanded over the last two yearswhile its share count has shrunk 8.1%. Improving profitability and share buybacks are positive signs for shareholders as they juice EPS growth relative to revenue growth. 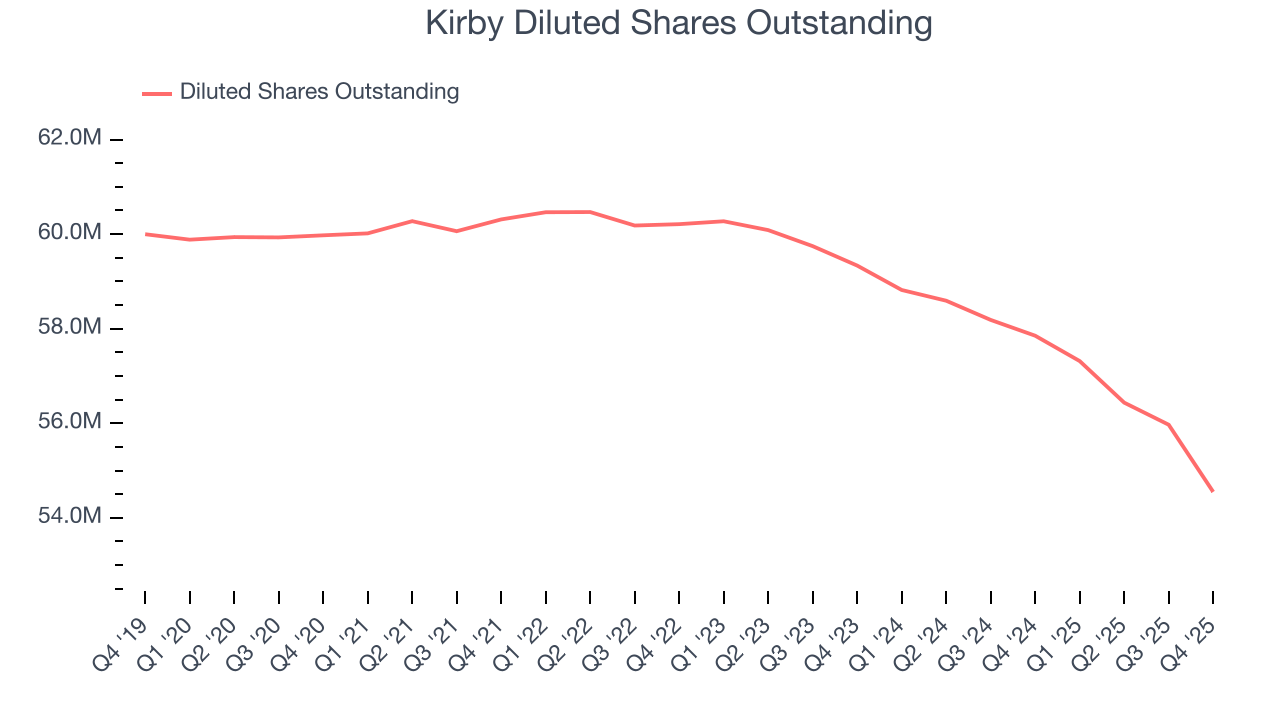
In Q4, Kirby reported EPS of $1.68, up from $0.74 in the same quarter last year. This print beat analysts’ estimates by 3.4%. Over the next 12 months, Wall Street expects Kirby’s full-year EPS of $6.33 to grow 10.9%.
9. Cash Is King
Free cash flow isn't a prominently featured metric in company financials and earnings releases, but we think it's telling because it accounts for all operating and capital expenses, making it tough to manipulate. Cash is king.
Kirby has shown impressive cash profitability, enabling it to ride out cyclical downturns more easily while maintaining its investments in new and existing offerings. The company’s free cash flow margin averaged 8.8% over the last five years, better than the broader industrials sector. The divergence from its underwhelming operating margin stems from the add-back of non-cash charges like depreciation and stock-based compensation. GAAP operating profit expenses these line items, but free cash flow does not.
Taking a step back, we can see that Kirby’s margin expanded by 2.1 percentage points during that time. This is encouraging because it gives the company more optionality.
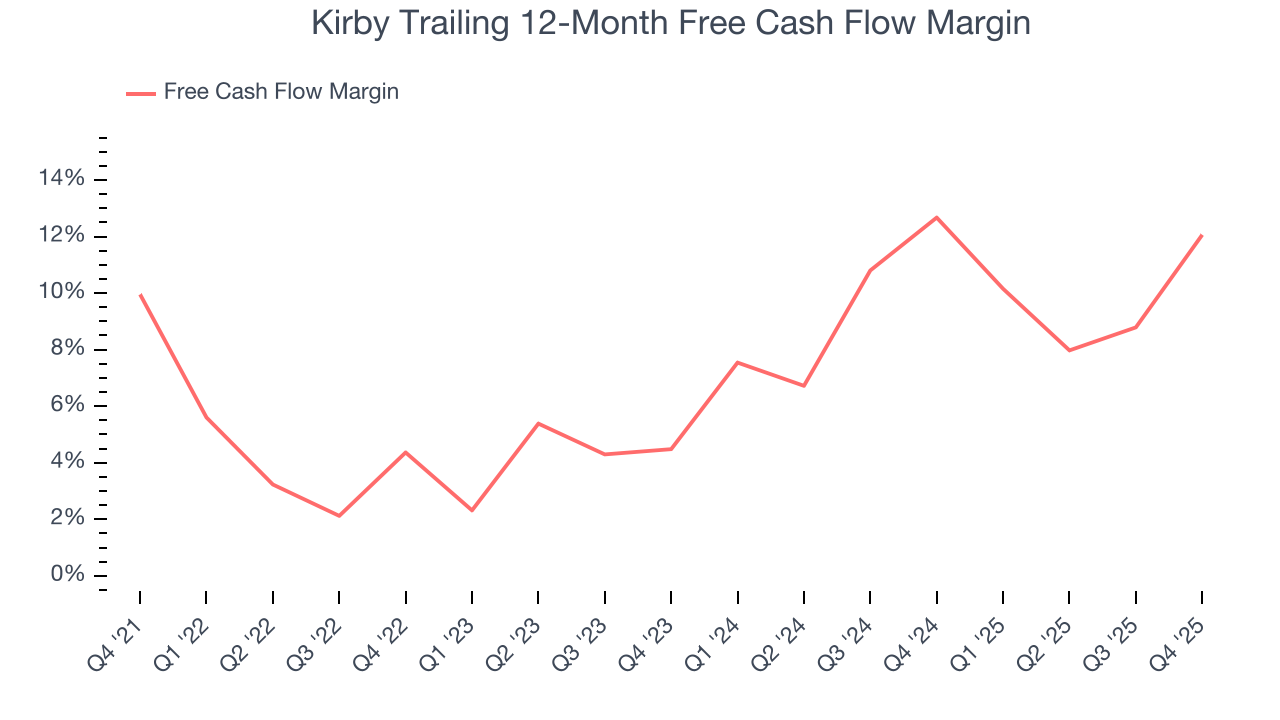
Kirby’s free cash flow clocked in at $265.2 million in Q4, equivalent to a 31.1% margin. This result was good as its margin was 12.4 percentage points higher than in the same quarter last year, building on its favorable historical trend.
10. Return on Invested Capital (ROIC)
EPS and free cash flow tell us whether a company was profitable while growing its revenue. But was it capital-efficient? Enter ROIC, a metric showing how much operating profit a company generates relative to the money it has raised (debt and equity).
Kirby historically did a mediocre job investing in profitable growth initiatives. Its five-year average ROIC was 4.1%, lower than the typical cost of capital (how much it costs to raise money) for industrials companies.
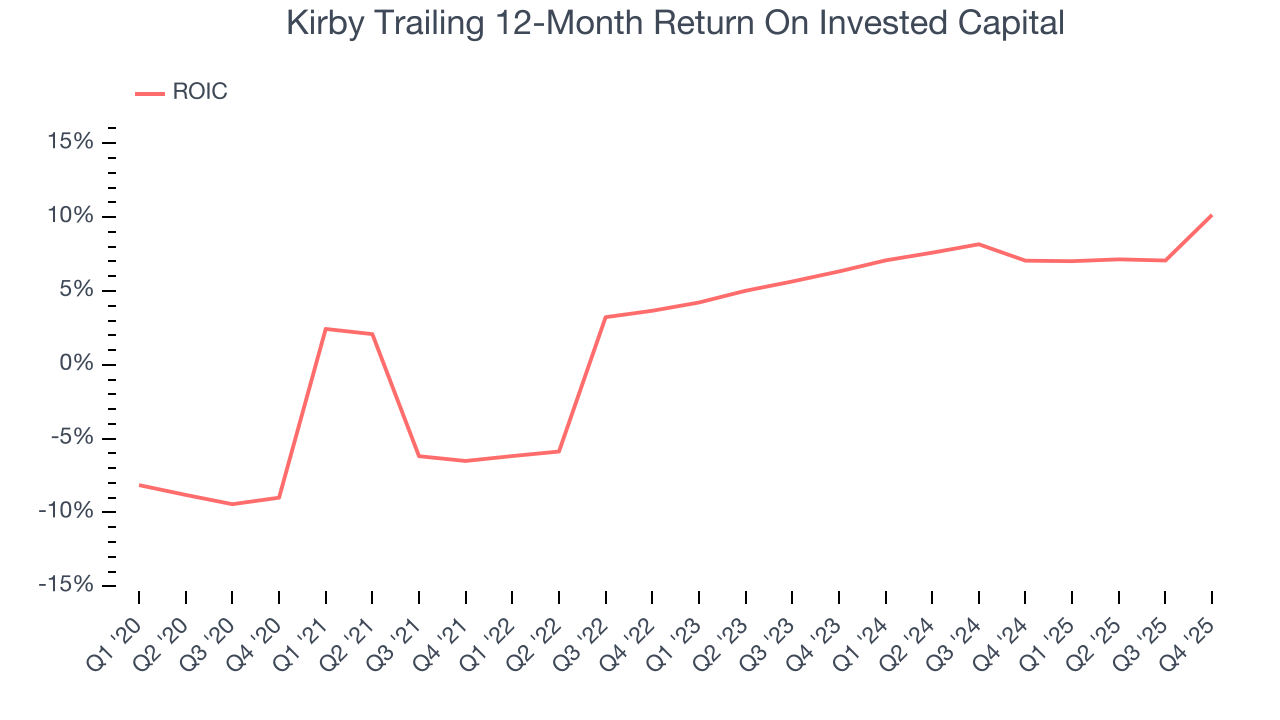
We like to invest in businesses with high returns, but the trend in a company’s ROIC is what often surprises the market and moves the stock price. Over the last few years, Kirby’s ROIC has increased. This is a good sign, but we recognize its lack of profitable growth during the COVID era was the primary reason for the change.
11. Balance Sheet Assessment
Kirby reported $78.78 million of cash and $919.3 million of debt on its balance sheet in the most recent quarter. As investors in high-quality companies, we primarily focus on two things: 1) that a company’s debt level isn’t too high and 2) that its interest payments are not excessively burdening the business.
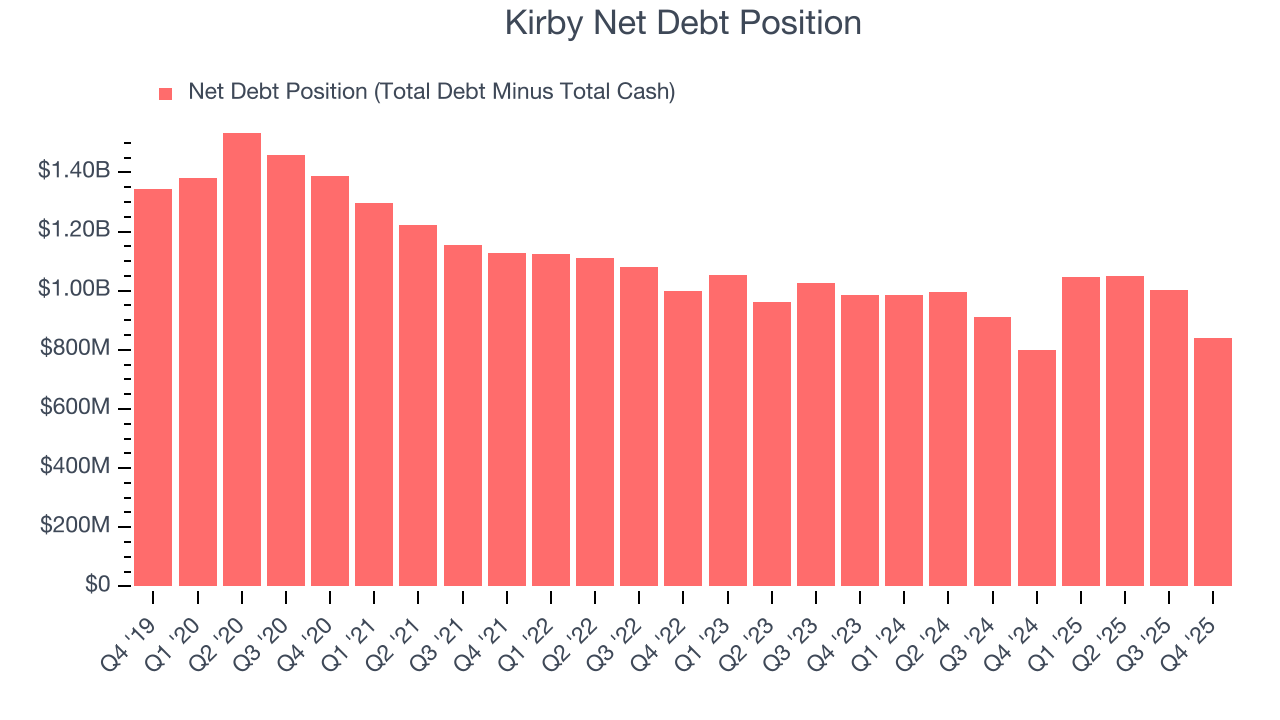
With $774.2 million of EBITDA over the last 12 months, we view Kirby’s 1.1× net-debt-to-EBITDA ratio as safe. We also see its $35.11 million of annual interest expenses as appropriate. The company’s profits give it plenty of breathing room, allowing it to continue investing in growth initiatives.
12. Key Takeaways from Kirby’s Q4 Results
We enjoyed seeing Kirby beat analysts’ EBITDA expectations this quarter. We were also glad its EPS outperformed Wall Street’s estimates. On the other hand, its revenue slightly missed and its Marine Transportation revenue fell short of Wall Street’s estimates. Zooming out, we think this was a mixed quarter. The market seemed to be hoping for more, and the stock traded down 4.1% to $122.85 immediately after reporting.
13. Is Now The Time To Buy Kirby?
Updated: March 14, 2026 at 11:21 PM EDT
We think that the latest earnings result is only one piece of the bigger puzzle. If you’re deciding whether to own Kirby, you should also grasp the company’s longer-term business quality and valuation.
In our opinion, Kirby is a good company. To kick things off, its revenue growth was solid over the last five years. And while its relatively low ROIC suggests management has struggled to find compelling investment opportunities, its expanding operating margin shows the business has become more efficient. On top of that, its astounding EPS growth over the last five years shows its profits are trickling down to shareholders.
Kirby’s P/E ratio based on the next 12 months is 18.3x. When scanning the industrials space, Kirby trades at a fair valuation. For those confident in the business and its management team, this is a good time to invest.
Wall Street analysts have a consensus one-year price target of $139.67 on the company (compared to the current share price of $124.94), implying they see 11.8% upside in buying Kirby in the short term.