Coca-Cola (KO)
Coca-Cola catches our eye. Although its sales growth has been weak, its profitability gives it the flexibility to ride out cycles.― StockStory Analyst Team
1. News


2. Summary
Why Coca-Cola Is Interesting
A pioneer and behemoth in carbonated soft drinks, Coca-Cola (NYSE:KO) is a storied beverage company best known for its flagship soda.
- Differentiated product offerings are difficult to replicate at scale and result in a best-in-class gross margin of 61.3%
- Healthy operating margin shows it’s a well-run company with efficient processes, and its rise over the last year was fueled by some leverage on its fixed costs
- One pitfall is its the company has faced growth challenges as its 3.7% annual revenue increases over the last three years fell short of other consumer staples companies


Coca-Cola has the potential to be a high-quality business. This company has a place on your watchlist.
Why Should You Watch Coca-Cola


At $75.67 per share, Coca-Cola trades at 23.5x forward P/E. This valuation represents a premium to consumer staples peers.
Coca-Cola could improve its business quality by stringing together a few solid quarters. We’d be more open to buying the stock when that time comes.
3. Coca-Cola (KO) Research Report: Q4 CY2025 Update
Beverage company Coca-Cola (NYSE:KO) fell short of the market’s revenue expectations in Q4 CY2025 as sales rose 3.7% year on year to $11.82 billion. Its non-GAAP profit of $0.58 per share was 2.7% above analysts’ consensus estimates.
Coca-Cola (KO) Q4 CY2025 Highlights:
- Revenue: $11.82 billion vs analyst estimates of $12 billion (3.7% year-on-year growth, 1.5% miss)
- Adjusted EPS: $0.58 vs analyst estimates of $0.56 (2.7% beat)
- Adjusted EBITDA: $2.15 billion vs analyst estimates of $3.19 billion (18.2% margin, 32.6% miss)
- Operating Margin: 15.6%, down from 23.8% in the same quarter last year
- Free Cash Flow Margin: 24.3%, down from 27.6% in the same quarter last year
- Organic Revenue rose 5% year on year (beat)
- Sales Volumes rose 1% year on year (2% in the same quarter last year)
- Market Capitalization: $335.4 billion
Company Overview
A pioneer and behemoth in carbonated soft drinks, Coca-Cola (NYSE:KO) is a storied beverage company best known for its flagship soda.
The company was founded in 1886 when the namesake soda was created by pharmacist Dr. John S. Pemberton in Atlanta, Georgia. The original formula was intended as a patent medicine and sold as a medicinal tonic. Pemberton's bookkeeper, Frank Robinson, came up with the name "Coca-Cola" and designed the iconic script logo that is still used today. Coca-Cola is one of the most recognized and powerful brands on earth, period.
Today, Coca-Cola offers a diverse range of beverages including Diet Coke, Sprite, Powerade sports drinks, Minute Maid juices, and Dasani water. Therefore, its core customer is extremely broad.
The company's products are widely available in grocery stores, supermarkets, convenience stores, restaurants, vending machines, and movie theaters globally. Coca-Cola's strong distribution network is a differentiator and ensures its products are easily accessible and visible in terms of shelf placement.
Whether it’s the script logo, “bottle skirt” glass bottle, or Santa Claus association, Coca-Cola is a product embedded in pop culture.
4. Beverages, Alcohol, and Tobacco
These companies' performance is influenced by brand strength, marketing strategies, and shifts in consumer preferences. Changing consumption patterns are particularly relevant and can be seen in the rise of cannabis, craft beer, and vaping or the steady decline of soda and cigarettes. Companies that spend on innovation to meet consumers where they are with regards to trends can reap huge demand benefits while those who ignore trends can see stagnant volumes. Finally, with the advent of the social media, the cost of starting a brand from scratch is much lower, meaning that new entrants can chip away at the market shares of established players.
Competitors that offer sodas and other beverages include PepsiCo (NASDAQ:PEP), Keurig Dr. Pepper (NASDAQ:KDP), Nestle (SWX:NESN), and Monster Beverage (NASDAQ:MNST).
5. Revenue Growth
A company’s long-term performance is an indicator of its overall quality. Any business can have short-term success, but a top-tier one grows for years.
With $48.07 billion in revenue over the past 12 months, Coca-Cola is one of the most widely recognized consumer staples companies. Its influence over consumers gives it negotiating leverage with distributors, enabling it to pick and choose where it sells its products (a luxury many don’t have). However, its scale is a double-edged sword because there are only a finite number of major retail partners, placing a ceiling on its growth. To accelerate sales, Coca-Cola likely needs to optimize its pricing or lean into new products and international expansion.
As you can see below, Coca-Cola’s 3.7% annualized revenue growth over the last three years was sluggish, but to its credit, consumers bought more of its products.
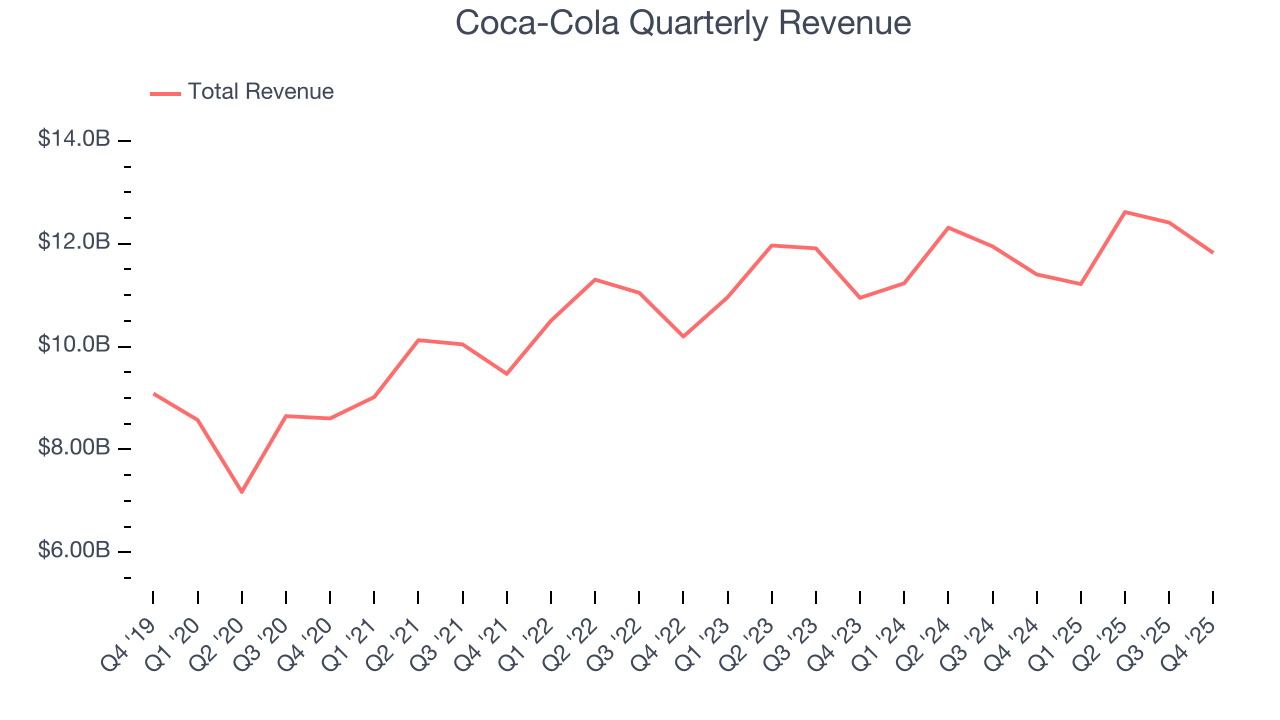
This quarter, Coca-Cola’s revenue grew by 3.7% year on year to $11.82 billion, falling short of Wall Street’s estimates.
Looking ahead, sell-side analysts expect revenue to grow 6% over the next 12 months, an acceleration versus the last three years. This projection is above the sector average and implies its newer products will spur better top-line performance.
6. Volume Growth
Revenue growth can be broken down into changes in price and volume (the number of units sold). While both are important, volume is the lifeblood of a successful staples business as there’s a ceiling to what consumers will pay for everyday goods; they can always trade down to non-branded products if the branded versions are too expensive.
To analyze whether Coca-Cola generated its growth from changes in price or volume, we can compare its volume growth to its organic revenue growth, which excludes non-fundamental impacts on company financials like mergers and currency fluctuations.
Over the last two years, Coca-Cola’s quarterly sales volumes have, on average, stayed about the same. This stability is normal as the quantity demanded for consumer staples products typically doesn’t see much volatility. The company’s flat volumes also indicate its average organic revenue growth of 8.9% was generated from price increases.
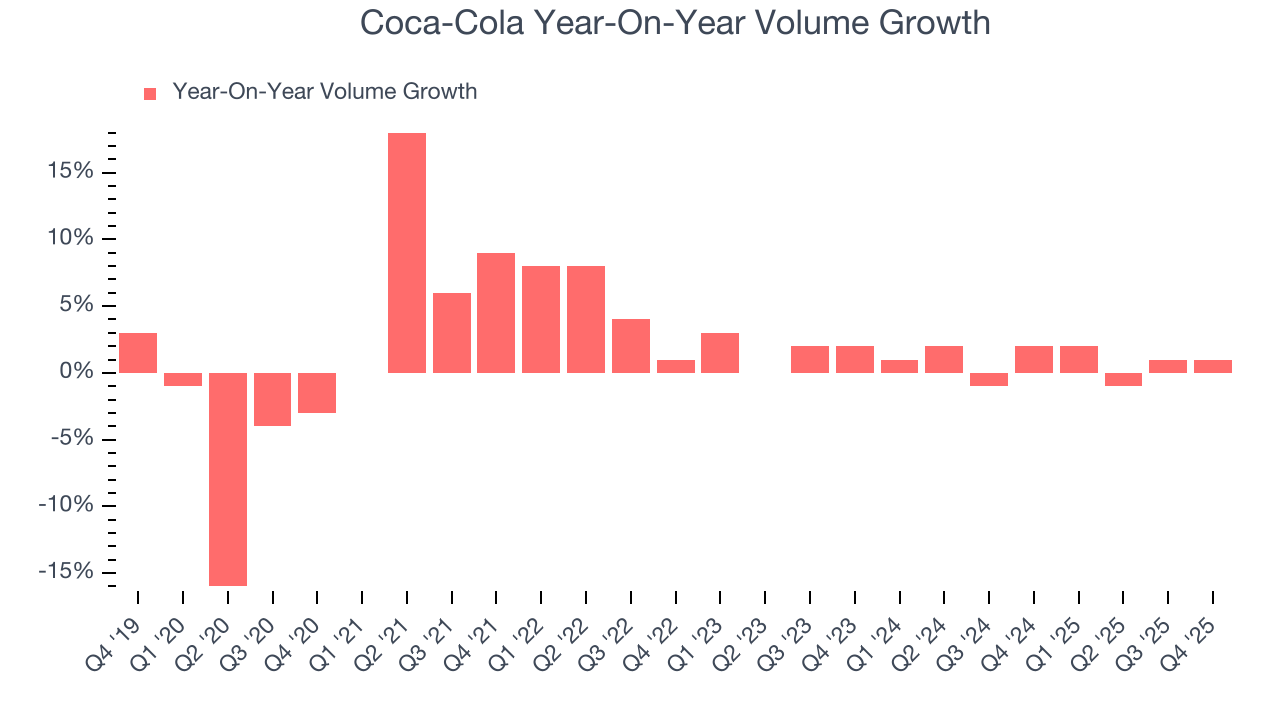
In Coca-Cola’s Q4 2025, sales volumes jumped 1% year on year. This result was an acceleration from its historical levels, certainly a positive signal.
7. Gross Margin & Pricing Power
Coca-Cola has best-in-class unit economics for a consumer staples company, enabling it to invest in areas such as marketing and talent to grow its brand. As you can see below, it averaged an elite 61.3% gross margin over the last two years. That means for every $100 in revenue, only $38.67 went towards paying for raw materials, production of goods, transportation, and distribution. 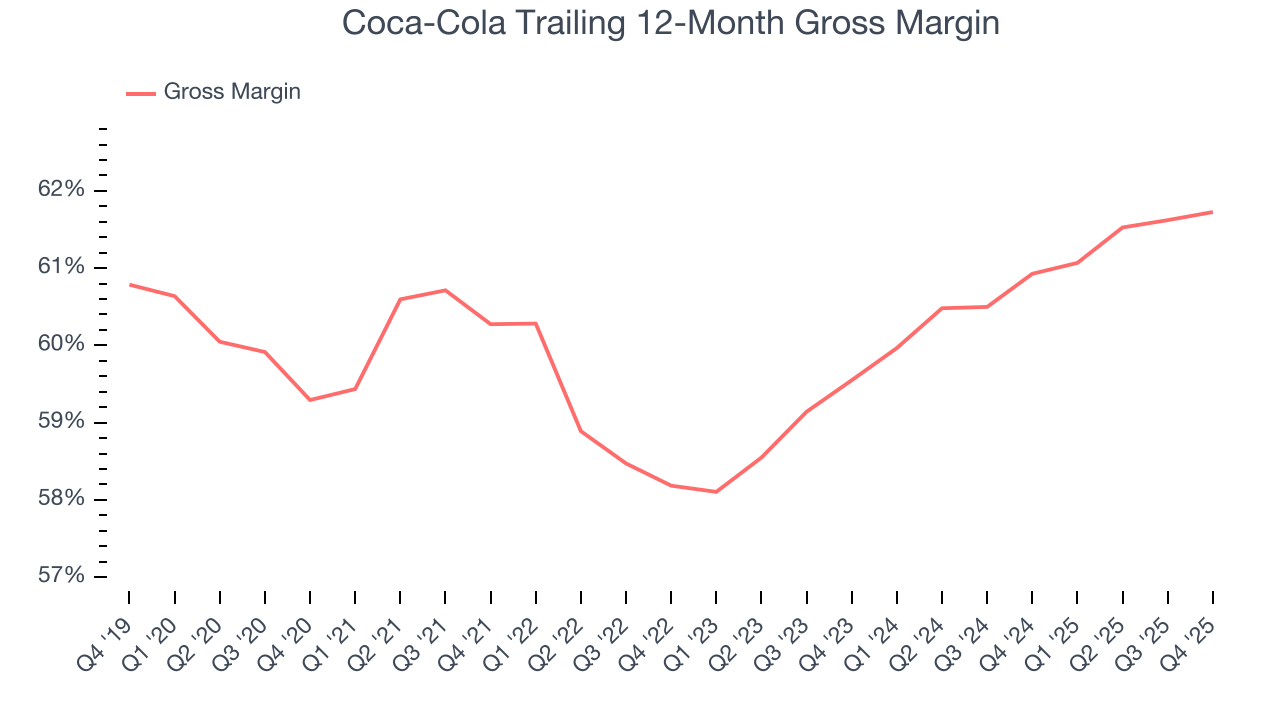
In Q4, Coca-Cola produced a 60% gross profit margin, in line with the same quarter last year. Zooming out, the company’s full-year margin has remained steady over the past 12 months, suggesting its input costs (such as raw materials and manufacturing expenses) have been stable and it isn’t under pressure to lower prices.
8. Operating Margin
Coca-Cola has been a well-oiled machine over the last two years. It demonstrated elite profitability for a consumer staples business, boasting an average operating margin of 25%. This result isn’t surprising as its high gross margin gives it a favorable starting point.
Looking at the trend in its profitability, Coca-Cola’s operating margin rose by 7.3 percentage points over the last year, as its sales growth gave it operating leverage.
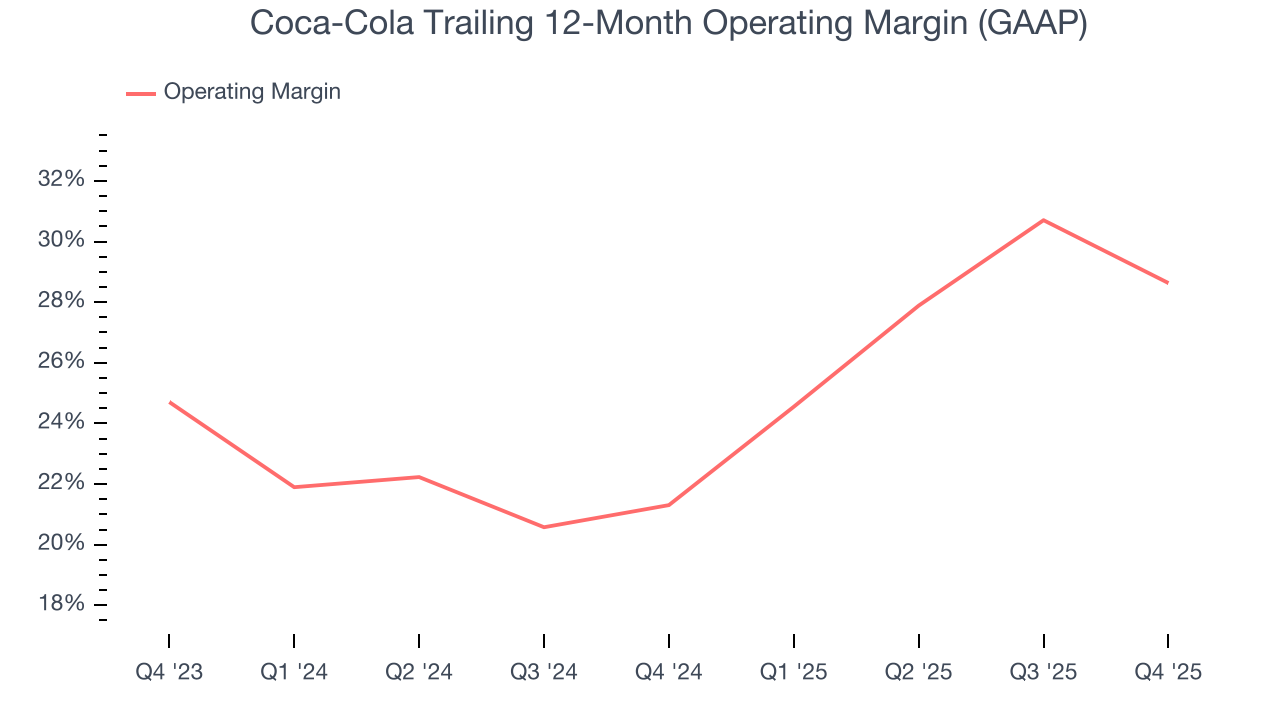
This quarter, Coca-Cola generated an operating margin profit margin of 15.6%, down 8.2 percentage points year on year. Since Coca-Cola’s operating margin decreased more than its gross margin, we can assume it was less efficient because expenses such as marketing, and administrative overhead increased.
9. Earnings Per Share
We track the long-term change in earnings per share (EPS) for the same reason as long-term revenue growth. Compared to revenue, however, EPS highlights whether a company’s growth is profitable.
Coca-Cola’s EPS grew at a decent 6.6% compounded annual growth rate over the last three years, higher than its 3.7% annualized revenue growth. However, we take this with a grain of salt because its operating margin didn’t improve and it didn’t repurchase its shares, meaning the delta came from reduced interest expenses or taxes.
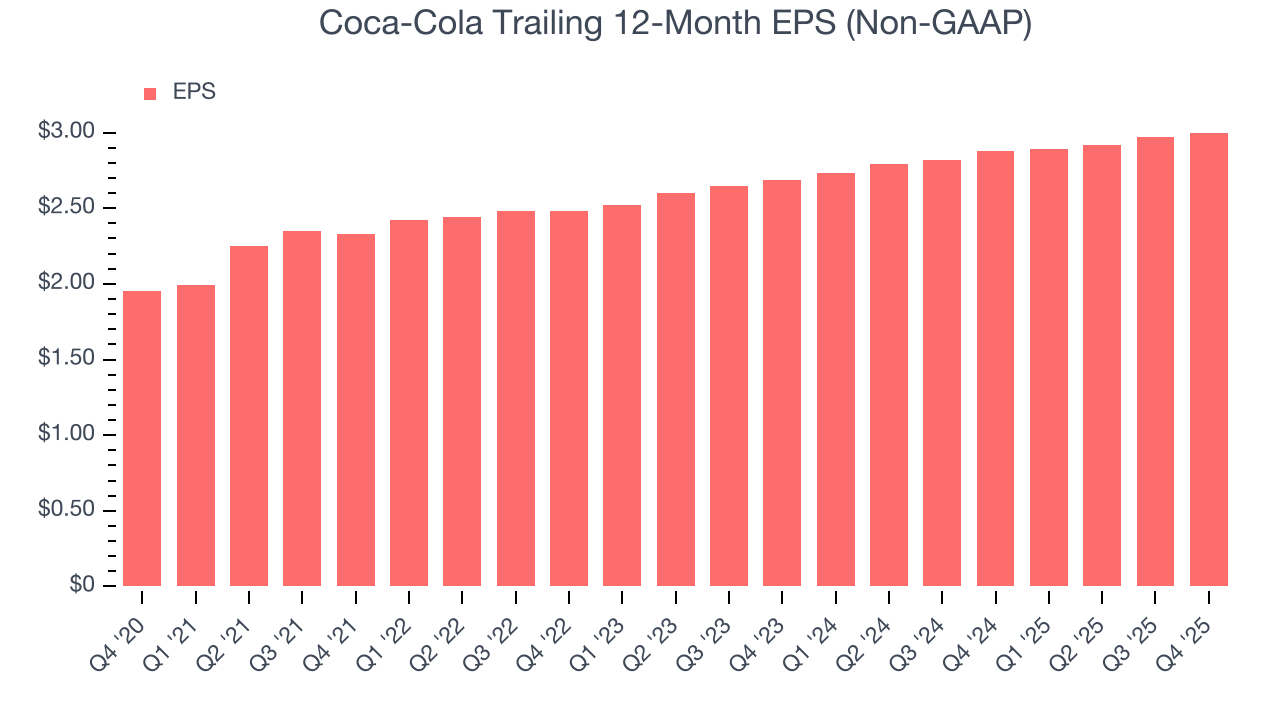
In Q4, Coca-Cola reported adjusted EPS of $0.58, up from $0.55 in the same quarter last year. This print beat analysts’ estimates by 2.7%. Over the next 12 months, Wall Street expects Coca-Cola’s full-year EPS of $3 to grow 7.2%.
10. Cash Is King
If you’ve followed StockStory for a while, you know we emphasize free cash flow. Why, you ask? We believe that in the end, cash is king, and you can’t use accounting profits to pay the bills.
Coca-Cola has shown robust cash profitability, driven by its attractive business model that enables it to reinvest or return capital to investors. The company’s free cash flow margin averaged 10.6% over the last two years, quite impressive for a consumer staples business.
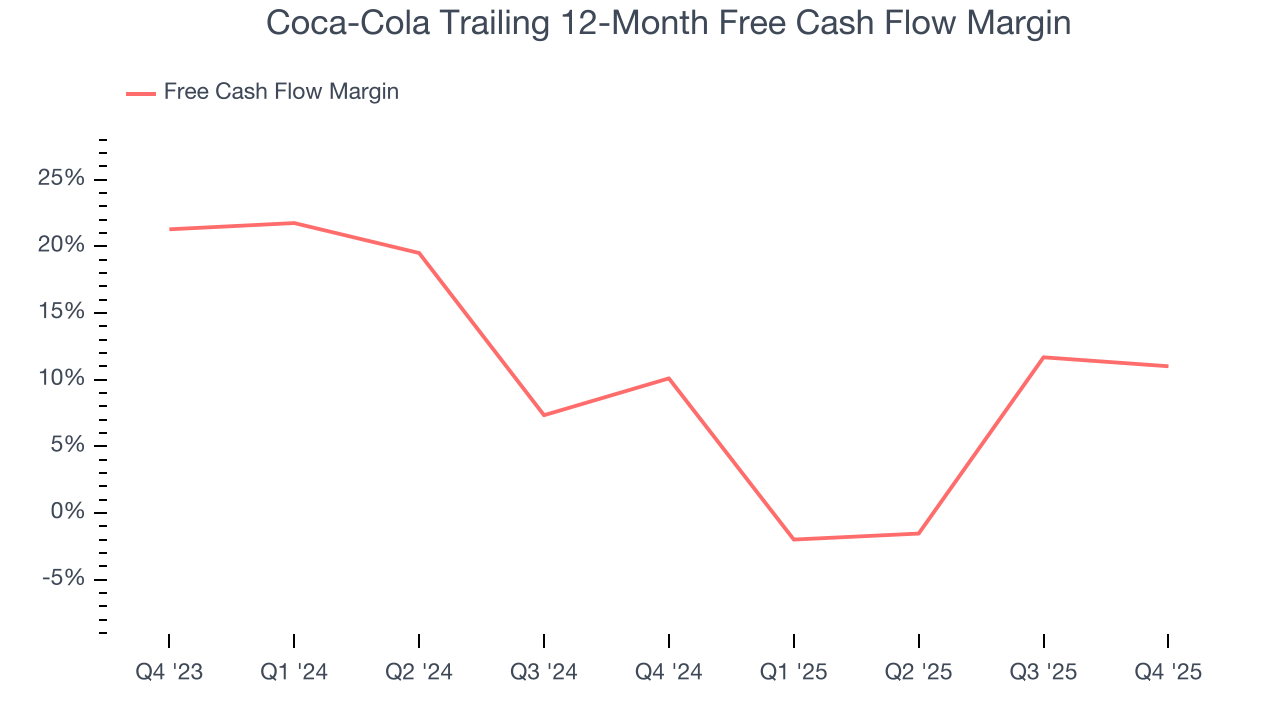
Coca-Cola’s free cash flow clocked in at $2.87 billion in Q4, equivalent to a 24.3% margin. The company’s cash profitability regressed as it was 3.3 percentage points lower than in the same quarter last year, but it’s still above its two-year average. We wouldn’t read too much into this quarter’s decline because capital expenditures can be seasonal and companies often stockpile inventory in anticipation of higher demand, leading to short-term swings. Long-term trends trump temporary fluctuations.
11. Return on Invested Capital (ROIC)
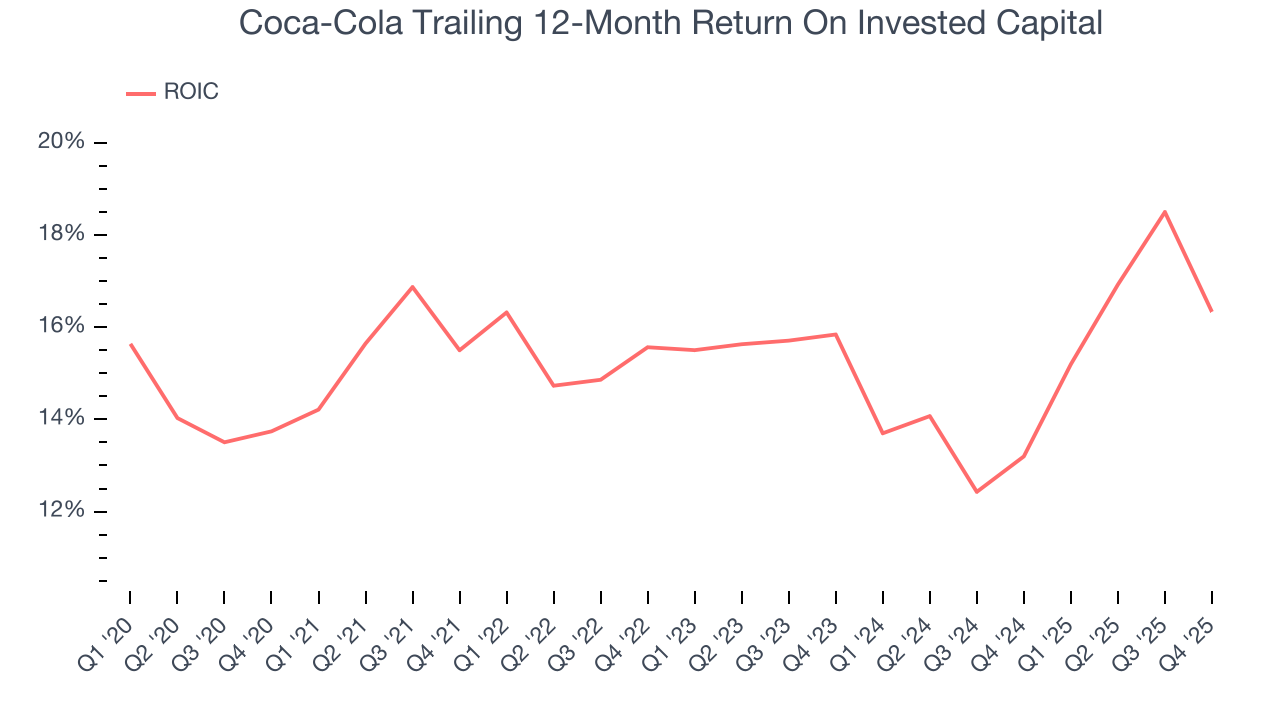
EPS and free cash flow tell us whether a company was profitable while growing its revenue. But was it capital-efficient? Enter ROIC, a metric showing how much operating profit a company generates relative to the money it has raised (debt and equity).
Coca-Cola’s five-year average ROIC was 15.3%, higher than most consumer staples businesses. This illustrates its management team’s ability to invest in profitable growth opportunities and generate value for shareholders.
12. Balance Sheet Assessment
Coca-Cola reported $15.81 billion of cash and $45.49 billion of debt on its balance sheet in the most recent quarter. As investors in high-quality companies, we primarily focus on two things: 1) that a company’s debt level isn’t too high and 2) that its interest payments are not excessively burdening the business.
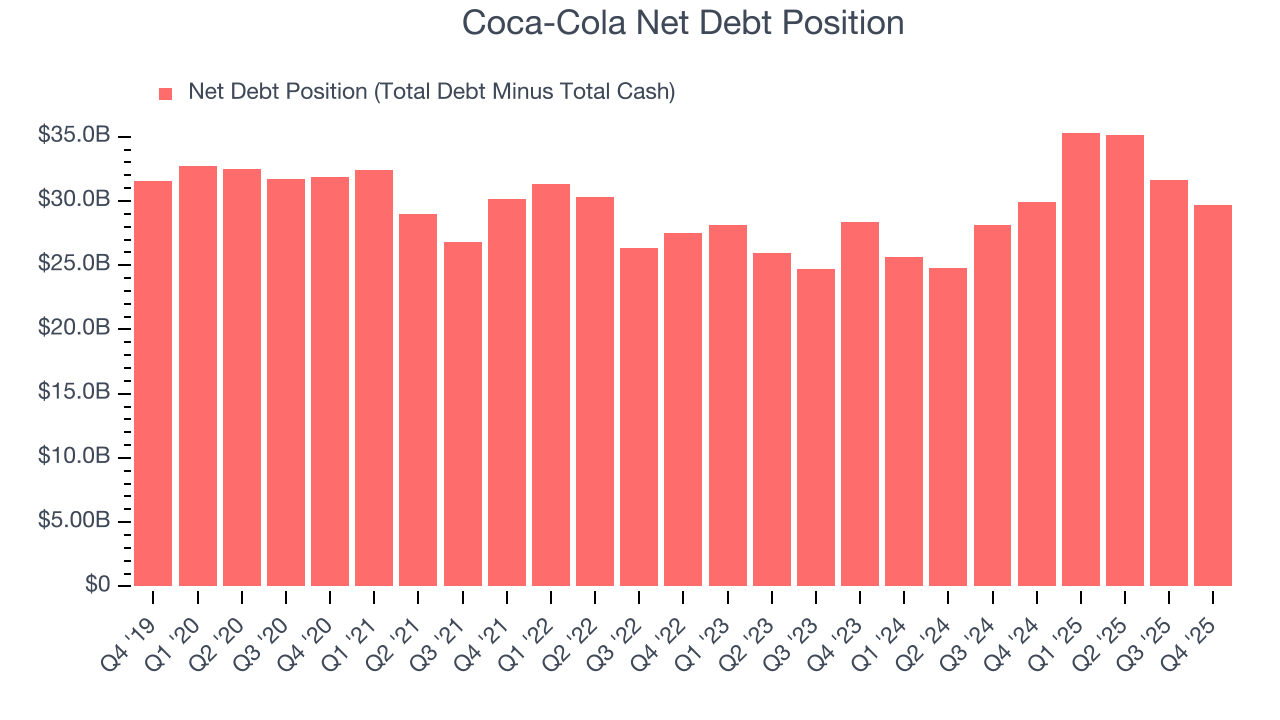
With $15.09 billion of EBITDA over the last 12 months, we view Coca-Cola’s 2.0× net-debt-to-EBITDA ratio as safe. We also see its $345 million of annual interest expenses as appropriate. The company’s profits give it plenty of breathing room, allowing it to continue investing in growth initiatives.
13. Key Takeaways from Coca-Cola’s Q4 Results
It was good to see Coca-Cola meet analysts’ organic revenue expectations this quarter. We were also happy its gross margin narrowly outperformed Wall Street’s estimates. On the other hand, its EBITDA missed and its revenue fell slightly short of Wall Street’s estimates. Overall, this was a softer quarter. The stock traded down 3.8% to $75.01 immediately after reporting.
14. Is Now The Time To Buy Coca-Cola?
Updated: March 19, 2026 at 10:50 PM EDT
When considering an investment in Coca-Cola, investors should account for its valuation and business qualities as well as what’s happened in the latest quarter.
There are a lot of things to like about Coca-Cola. Although its revenue growth was a little slower over the last three years and analysts expect growth to slow over the next 12 months, its admirable gross margins are a wonderful starting point for the overall profitability of the business. And while its projected EPS for the next year is lacking, its impressive operating margins show it has a highly efficient business model.
Coca-Cola’s P/E ratio based on the next 12 months is 23.5x. This valuation tells us it’s a bit of a market darling with a lot of good news priced in. Coca-Cola is a good one to add to your watchlist - there are companies featuring superior fundamentals at the moment.
Wall Street analysts have a consensus one-year price target of $83.49 on the company (compared to the current share price of $75.67).