Post (POST)
Post doesn’t excite us. Its underwhelming returns on capital show it struggled to generate meaningful profits for shareholders.― StockStory Analyst Team
1. News


2. Summary
Why We Think Post Will Underperform
Founded in 1895, Post (NYSE:POST) is a packaged food company known for its namesake breakfast cereal and healthier-for-you snacks.
- Sales are projected to remain flat over the next 12 months as demand decelerates from its three-year trend
- Shrinking unit sales over the past two years imply it may need to invest in product improvements to get back on track
- One positive is that its earnings growth has beaten its peers over the last three years as its EPS has compounded at 38.9% annually


Post falls short of our expectations. You should search for better opportunities.
Why There Are Better Opportunities Than Post


At $98.42 per share, Post trades at 13.1x forward P/E. Post’s valuation may seem like a bargain, especially when stacked up against other consumer staples companies. We remind you that you often get what you pay for, though.
Cheap stocks can look like a great deal at first glance, but they can be value traps. They often have less earnings power, meaning there is more reliance on a re-rating to generate good returns - an unlikely scenario for low-quality companies.
3. Post (POST) Research Report: Q4 CY2025 Update
Packaged foods company Post (NYSE:POST) met Wall Street’s revenue expectations in Q4 CY2025, with sales up 10.1% year on year to $2.17 billion. Its non-GAAP profit of $2.13 per share was 27.7% above analysts’ consensus estimates.
Post (POST) Q4 CY2025 Highlights:
- Revenue: $2.17 billion vs analyst estimates of $2.18 billion (10.1% year-on-year growth, in line)
- Adjusted EPS: $2.13 vs analyst estimates of $1.67 (27.7% beat)
- Adjusted EBITDA: $418.2 million vs analyst estimates of $386.1 million (19.2% margin, 8.3% beat)
- EBITDA guidance for the full year is $1.57 billion at the midpoint, above analyst estimates of $1.54 billion
- Operating Margin: 11%, in line with the same quarter last year
- Free Cash Flow Margin: 5.5%, down from 8.7% in the same quarter last year
- Market Capitalization: $5.39 billion
Company Overview
Founded in 1895, Post (NYSE:POST) is a packaged food company known for its namesake breakfast cereal and healthier-for-you snacks.
Within the Post cereal umbrella, brands such as Honey Bunches of Oats, Grape-Nuts, Pebbles, and Shredded Wheat have made the company a mainstay in the cereal category. Weetabix, Bob Evans Farms, and Peter Pan Peanut Butter are other popular brands in the Post portfolio, and the company has even expanded into quality pet food.
Post’s core customer is an individual or family seeking convenient and nutritious packaged food. The company therefore shapes its branding and messaging to speak to those who are health-conscious or who lead active lifestyles that prioritize nutrition. On Post’s website, the brand portfolio is introduced with “Tasty and delicious. Wholesome and nutritious. We’ve got food brands the whole family will love.”
Post’s brands and products can be found in a wide range of stores and retailers, with major grocery stores and supermarkets being the main channels. Additionally, convenience stores, health food stores, and online food retailers also carry Post products. Wide distribution and prominent shelf placement over time have cemented Post as a bellwether staples company and leader in breakfast cereals.
4. Shelf-Stable Food
As America industrialized and moved away from an agricultural economy, people faced more demands on their time. Packaged foods emerged as a solution offering convenience to the evolving American family, whether it be canned goods or snacks. Today, Americans seek brands that are high in quality, reliable, and reasonably priced. Furthermore, there's a growing emphasis on health-conscious and sustainable food options. Packaged food stocks are considered resilient investments. People always need to eat, so these companies can enjoy consistent demand as long as they stay on top of changing consumer preferences. The industry spans from multinational corporations to smaller specialized firms and is subject to food safety and labeling regulations.
Competitors in the packaged food space and specifically in breakfast cereals include General Mills (NYSE:GIS), Kellogg (NYSE:K), and Kraft Heinz (NASDAQ:KHC).
5. Revenue Growth
Examining a company’s long-term performance can provide clues about its quality. Any business can put up a good quarter or two, but many enduring ones grow for years.
With $8.36 billion in revenue over the past 12 months, Post is one of the larger consumer staples companies and benefits from a well-known brand that influences purchasing decisions.
As you can see below, Post’s sales grew at a decent 11.2% compounded annual growth rate over the last three years despite consumers buying less of its products. We’ll explore what this means in the "Volume Growth" section.
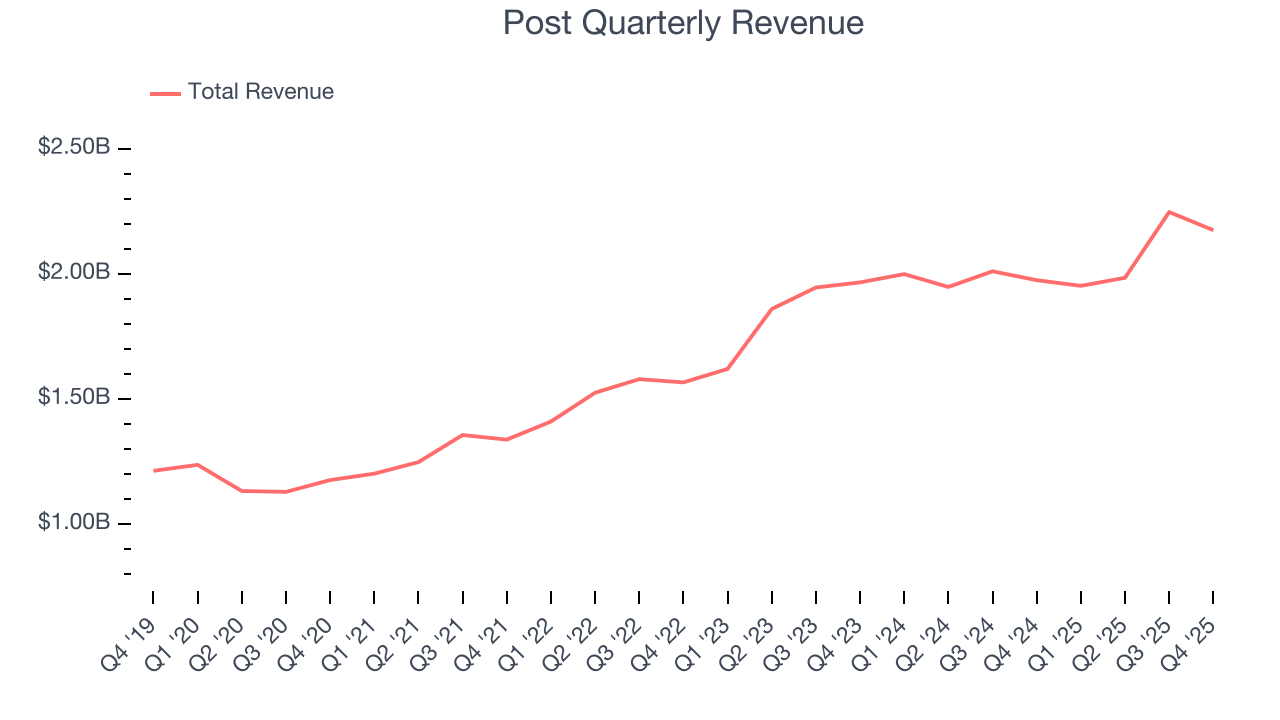
This quarter, Post’s year-on-year revenue growth was 10.1%, and its $2.17 billion of revenue was in line with Wall Street’s estimates.
Looking ahead, sell-side analysts expect revenue to remain flat over the next 12 months, a deceleration versus the last three years. This projection doesn't excite us and implies its products will see some demand headwinds.
6. Gross Margin & Pricing Power
Post’s gross margin is slightly below the average consumer staples company, giving it less room to invest in areas such as marketing and talent to grow its brand. As you can see below, it averaged a 28.9% gross margin over the last two years. Said differently, for every $100 in revenue, a chunky $71.08 went towards paying for raw materials, production of goods, transportation, and distribution. 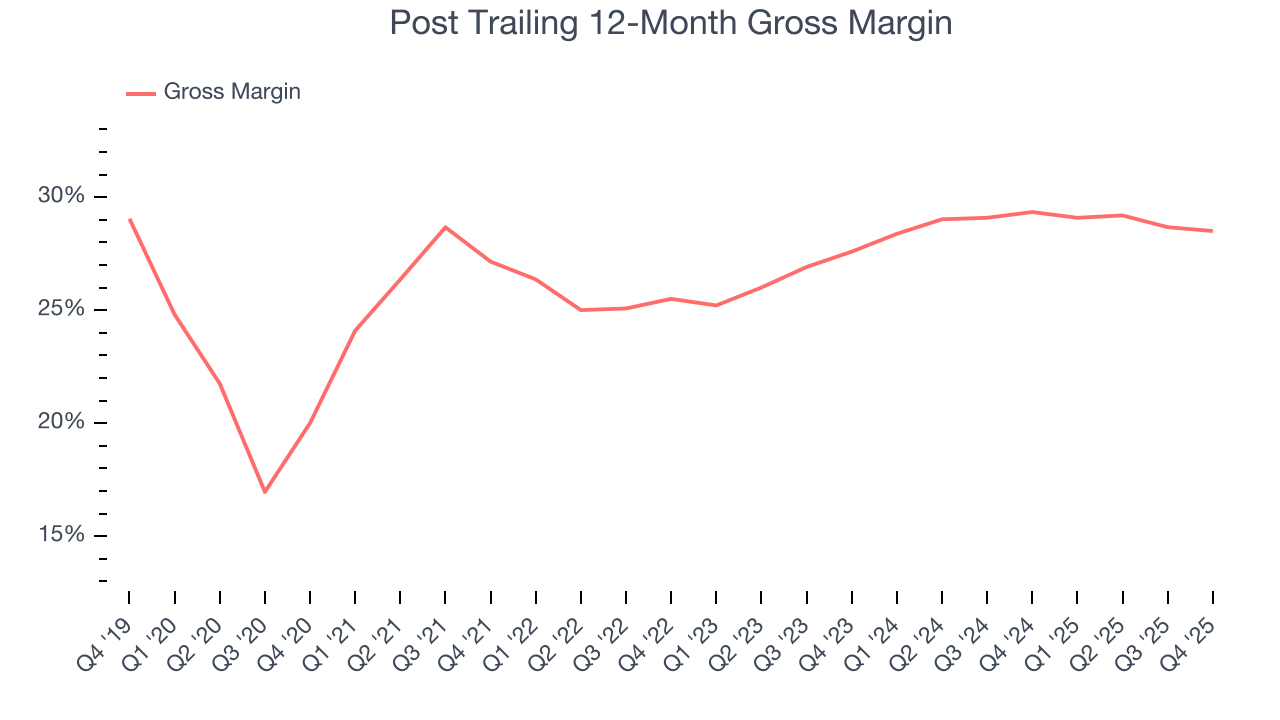
This quarter, Post’s gross profit margin was 29.4%, in line with the same quarter last year. On a wider time horizon, the company’s full-year margin has remained steady over the past four quarters, suggesting its input costs (such as raw materials and manufacturing expenses) have been stable and it isn’t under pressure to lower prices.
7. Operating Margin
Operating margin is an important measure of profitability accounting for key expenses such as marketing and advertising, IT systems, wages, and other administrative costs.
Post’s operating margin might fluctuated slightly over the last 12 months but has generally stayed the same, averaging 10% over the last two years. This profitability was higher than the broader consumer staples sector, showing it did a decent job managing its expenses.
Analyzing the trend in its profitability, Post’s operating margin might fluctuated slightly but has generally stayed the same over the last year. This raises questions about the company’s expense base because its revenue growth should have given it leverage on its fixed costs, resulting in better economies of scale and profitability.
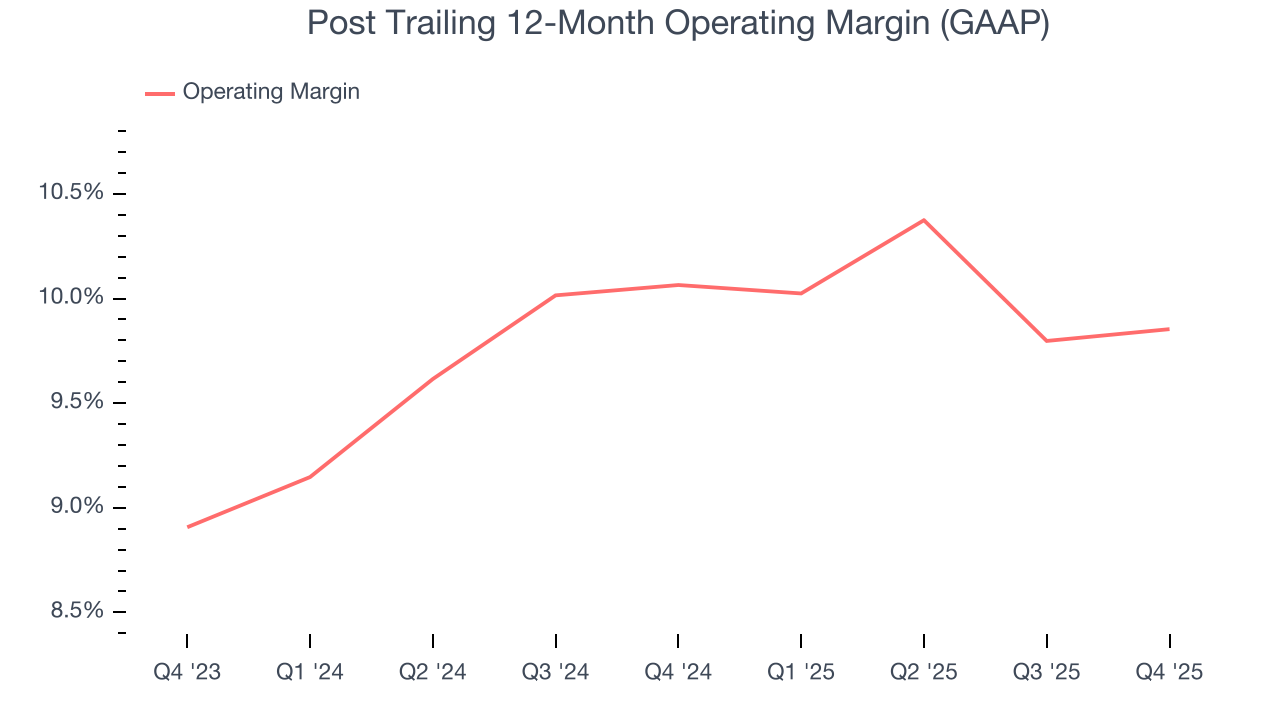
This quarter, Post generated an operating margin profit margin of 11%, in line with the same quarter last year. This indicates the company’s cost structure has recently been stable.
8. Earnings Per Share
We track the long-term change in earnings per share (EPS) for the same reason as long-term revenue growth. Compared to revenue, however, EPS highlights whether a company’s growth is profitable.
Post’s EPS grew at an astounding 38.9% compounded annual growth rate over the last three years, higher than its 11.2% annualized revenue growth. This tells us the company became more profitable on a per-share basis as it expanded.
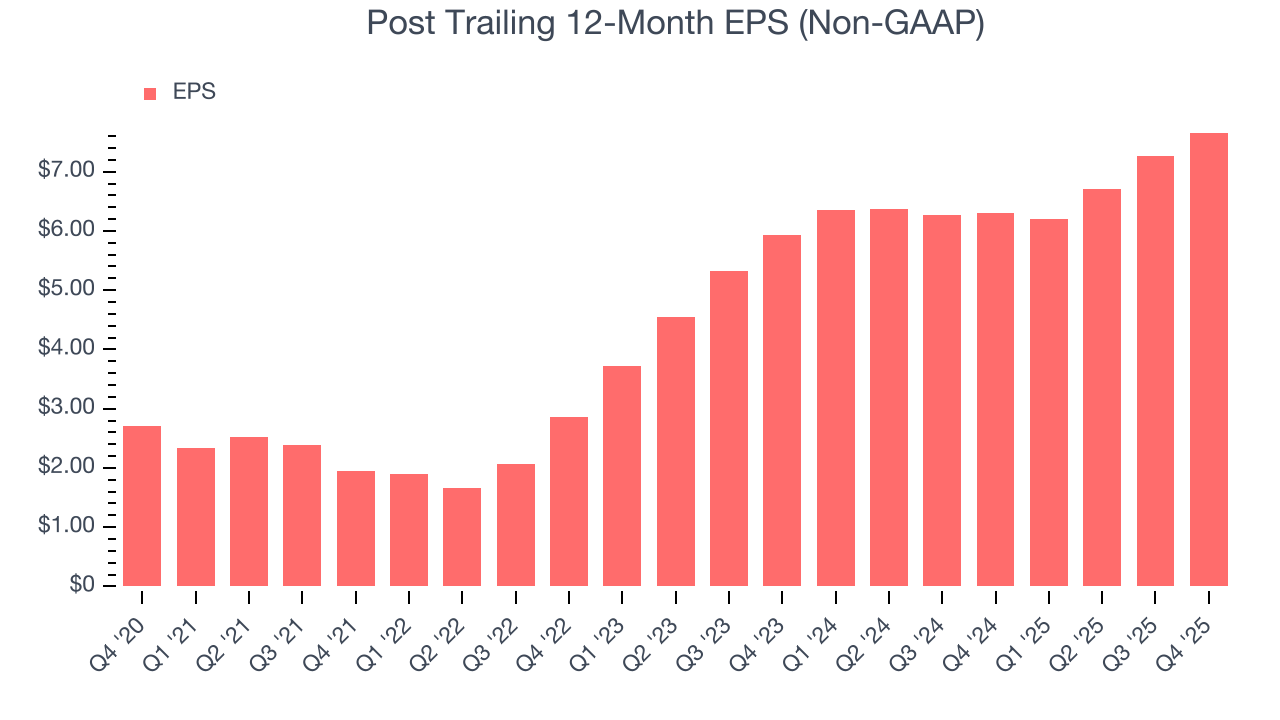
In Q4, Post reported adjusted EPS of $2.13, up from $1.73 in the same quarter last year. This print easily cleared analysts’ estimates, and shareholders should be content with the results. Over the next 12 months, Wall Street expects Post’s full-year EPS of $7.66 to shrink by 1.9%.
9. Cash Is King
Although earnings are undoubtedly valuable for assessing company performance, we believe cash is king because you can’t use accounting profits to pay the bills.
Post has shown decent cash profitability, giving it some flexibility to reinvest or return capital to investors. The company’s free cash flow margin averaged 6.2% over the last two years, slightly better than the broader consumer staples sector.
Taking a step back, we can see that Post’s margin dropped by 2.1 percentage points over the last year. If its declines continue, it could signal increasing investment needs and capital intensity.
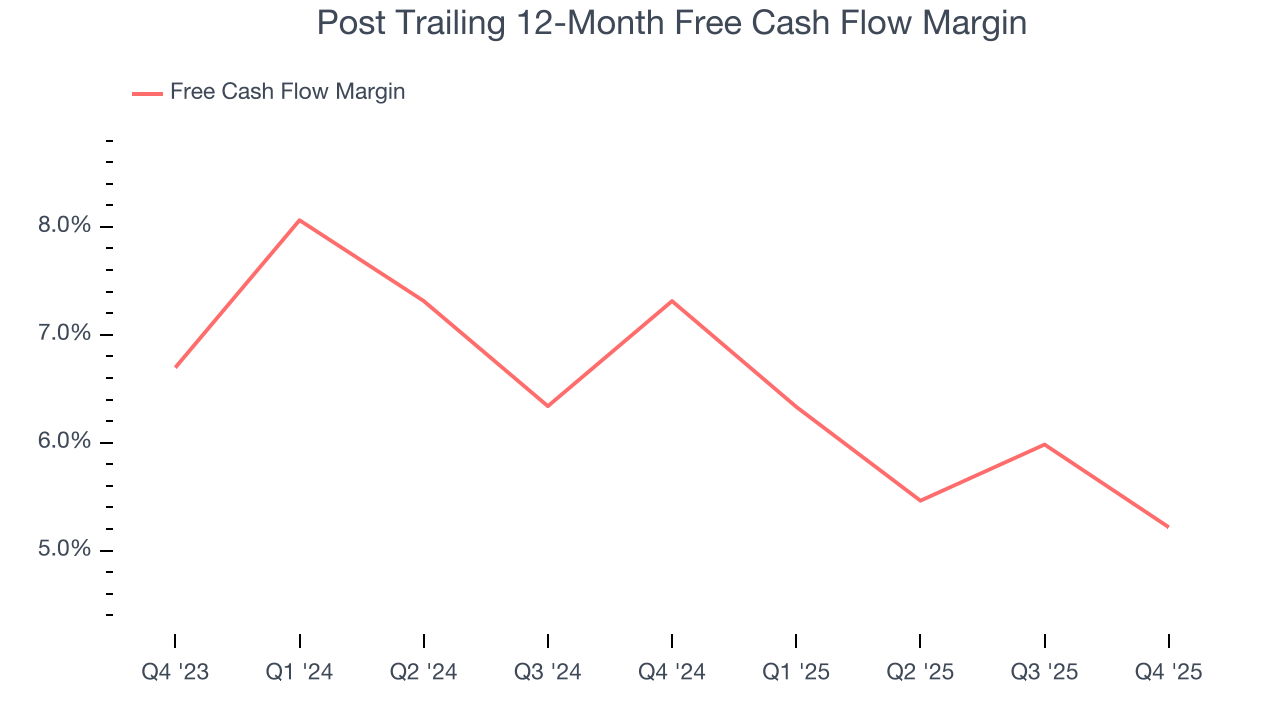
Post’s free cash flow clocked in at $119.3 million in Q4, equivalent to a 5.5% margin. The company’s cash profitability regressed as it was 3.2 percentage points lower than in the same quarter last year, suggesting its historical struggles have dragged on.
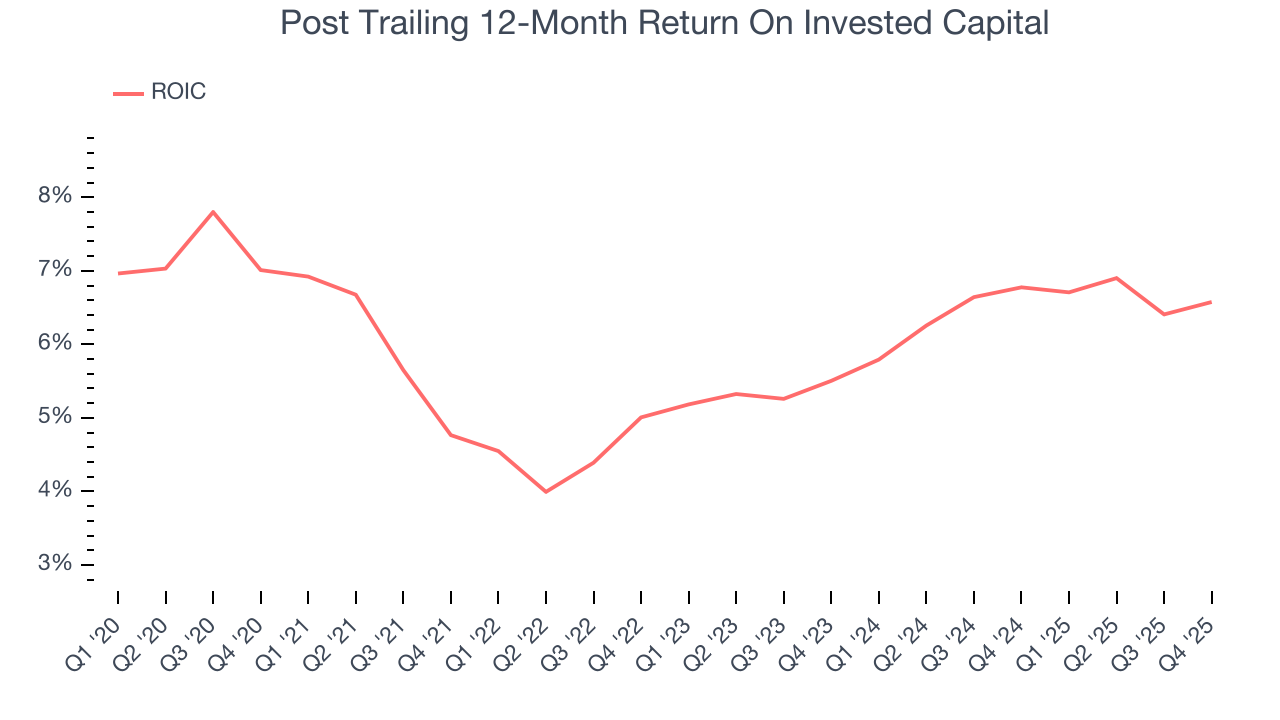
10. Return on Invested Capital (ROIC)
EPS and free cash flow tell us whether a company was profitable while growing its revenue. But was it capital-efficient? Enter ROIC, a metric showing how much operating profit a company generates relative to the money it has raised (debt and equity).
Post historically did a mediocre job investing in profitable growth initiatives. Its five-year average ROIC was 5.7%, somewhat low compared to the best consumer staples companies that consistently pump out 20%+.
11. Balance Sheet Assessment
Post reported $284.7 million of cash and $7.46 billion of debt on its balance sheet in the most recent quarter. As investors in high-quality companies, we primarily focus on two things: 1) that a company’s debt level isn’t too high and 2) that its interest payments are not excessively burdening the business.
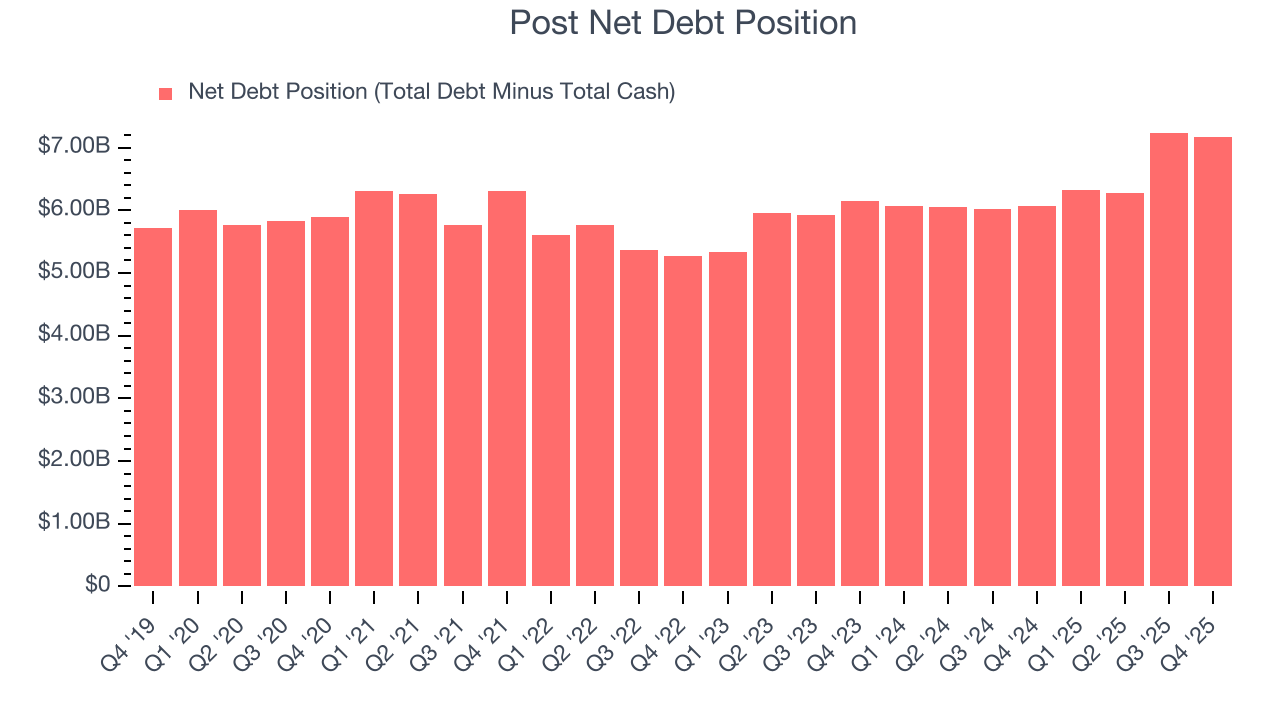
With $1.52 billion of EBITDA over the last 12 months, we view Post’s 4.7× net-debt-to-EBITDA ratio as safe. We also see its $162.6 million of annual interest expenses as appropriate. The company’s profits give it plenty of breathing room, allowing it to continue investing in growth initiatives.
12. Key Takeaways from Post’s Q4 Results
We were impressed by how significantly Post blew past analysts’ EBITDA expectations this quarter. We were also glad its EPS outperformed Wall Street’s estimates. Overall, we think this was a solid quarter with some key areas of upside. The stock traded up 1.5% to $106 immediately following the results.
13. Is Now The Time To Buy Post?
Updated: March 14, 2026 at 10:51 PM EDT
Before investing in or passing on Post, we urge you to understand the company’s business quality (or lack thereof), valuation, and the latest quarterly results - in that order.
Post isn’t a terrible business, but it doesn’t pass our quality test. Although its revenue growth was solid over the last three years, it’s expected to deteriorate over the next 12 months and its projected EPS for the next year is lacking. And while the company’s EPS growth over the last three years has been fantastic, the downside is its shrinking sales volumes suggest it’ll need to change its strategy to succeed.
Post’s P/E ratio based on the next 12 months is 13.1x. While this valuation is fair, the upside isn’t great compared to the potential downside. We're fairly confident there are better stocks to buy right now.
Wall Street analysts have a consensus one-year price target of $130.13 on the company (compared to the current share price of $98.42).
Although the price target is bullish, readers should exercise caution because analysts tend to be overly optimistic. The firms they work for, often big banks, have relationships with companies that extend into fundraising, M&A advisory, and other rewarding business lines. As a result, they typically hesitate to say bad things for fear they will lose out. We at StockStory do not suffer from such conflicts of interest, so we’ll always tell it like it is.