
Molson Coors (TAP)
We wouldn’t recommend Molson Coors. Its weak sales growth and low returns on capital show it struggled to generate demand and profits.― StockStory Analyst Team
1. News


2. Summary
Why We Think Molson Coors Will Underperform
Sporting an impressive roster of iconic beer brands, Molson Coors (NYSE:TAP) is a global brewing giant with a rich history dating back more than two centuries.
- Shrinking unit sales over the past two years indicate demand is soft and that the company may need to revise its product strategy
- Below-average returns on capital indicate management struggled to find compelling investment opportunities, and its shrinking returns suggest its past profit sources are losing steam
- Operating margin has declined over the last year, and when paired with its track record of losses, suggests intense competition and a suboptimal cost structure


Molson Coors doesn’t measure up to our expectations. Better stocks can be found in the market.
Why There Are Better Opportunities Than Molson Coors


Molson Coors is trading at $43.69 per share, or 9.2x forward P/E. This is a cheap valuation multiple, but for good reason. You get what you pay for.
Cheap stocks can look like great bargains at first glance, but you often get what you pay for. These mediocre businesses often have less earnings power, meaning there is more reliance on a re-rating to generate good returns - an unlikely scenario for low-quality companies.
3. Molson Coors (TAP) Research Report: Q4 CY2025 Update
Beer company Molson Coors (NYSE:TAP) missed Wall Street’s revenue expectations in Q4 CY2025, with sales falling 2.7% year on year to $2.66 billion. Its non-GAAP profit of $1.21 per share was 4.9% above analysts’ consensus estimates.
Molson Coors (TAP) Q4 CY2025 Highlights:
- Revenue: $2.66 billion vs analyst estimates of $2.71 billion (2.7% year-on-year decline, 1.7% miss)
- Adjusted EPS: $1.21 vs analyst estimates of $1.15 (4.9% beat)
- Adjusted EBITDA: $532.7 million vs analyst estimates of $517.1 million (20% margin, 3% beat)
- Operating Margin: 12.2%, down from 14.2% in the same quarter last year
- Free Cash Flow Margin: 13.4%, similar to the same quarter last year
- Sales Volumes fell 8.5% year on year (-6.4% in the same quarter last year)
- Market Capitalization: $10.06 billion
Company Overview
Sporting an impressive roster of iconic beer brands, Molson Coors (NYSE:TAP) is a global brewing giant with a rich history dating back more than two centuries.
The company was founded as “Molson” in 1786, and Molson Coors was established in 2005 when it merged with the Adolph Coors Company, another famous brewer.
Molson Coors combines both companies’ deep legacies of brewing excellence and innovation to form a diverse portfolio of beer brands, including Coors Light, Miller Lite, Blue Moon, and Peroni. These brands span various beer styles, from light lagers to craft-style ales, and appeal to a wide range of consumer preferences.
In recent years, Molson Coors has expanded beyond its core beer business to include non-alcoholic and alternative beverage options. This growth reflects the company's commitment to meeting the changing needs of its customers while maintaining the same dedication to quality and craftsmanship.
With a global presence, Molson Coors serves customers in North America, Europe, Asia, and beyond. It leverages its distribution networks and partnerships to ensure its products reach consumers in various countries, and its global reach helps diversify its revenue streams and reduce dependence on specific markets.
Molson Coors’s products are available in various retail channels, including supermarkets, convenience stores, bars, and restaurants. This widespread distribution enables the company to reach consumers where and how they prefer to purchase beverages.
4. Beverages, Alcohol, and Tobacco
These companies' performance is influenced by brand strength, marketing strategies, and shifts in consumer preferences. Changing consumption patterns are particularly relevant and can be seen in the rise of cannabis, craft beer, and vaping or the steady decline of soda and cigarettes. Companies that spend on innovation to meet consumers where they are with regards to trends can reap huge demand benefits while those who ignore trends can see stagnant volumes. Finally, with the advent of the social media, the cost of starting a brand from scratch is much lower, meaning that new entrants can chip away at the market shares of established players.
Competitors include Anheuser-Busch Inbev (NYSE:BUD), Boston Beer (NYSE:SAM), and Constellation Brands (NYSE:STZ) along with international companies such as Asahi, Carlsberg, and Heineken.
5. Revenue Growth
A company’s long-term performance is an indicator of its overall quality. Any business can have short-term success, but a top-tier one grows for years.
With $11.14 billion in revenue over the past 12 months, Molson Coors is one of the larger consumer staples companies and benefits from a well-known brand that influences purchasing decisions. However, its scale is a double-edged sword because there are only a finite number of major retail partners, placing a ceiling on its growth. To expand meaningfully, Molson Coors likely needs to tweak its prices, innovate with new products, or enter new markets.
As you can see below, Molson Coors’s sales grew at a weak 1.4% compounded annual growth rate over the last three years as consumers bought less of its products. We’ll explore what this means in the "Volume Growth" section.
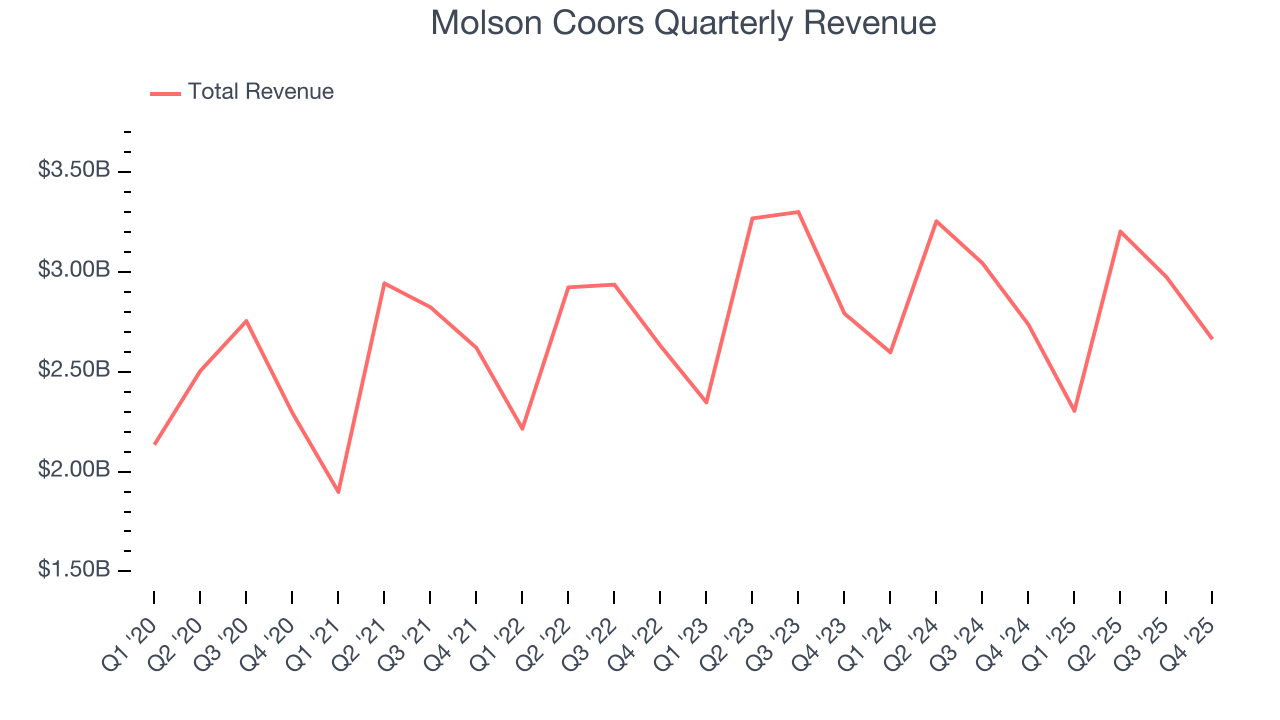
This quarter, Molson Coors missed Wall Street’s estimates and reported a rather uninspiring 2.7% year-on-year revenue decline, generating $2.66 billion of revenue.
Looking ahead, sell-side analysts expect revenue to remain flat over the next 12 months. This projection doesn't excite us and suggests its products will see some demand headwinds.
6. Volume Growth
Revenue growth can be broken down into changes in price and volume (the number of units sold). While both are important, volume is the lifeblood of a successful staples business as there’s a ceiling to what consumers will pay for everyday goods; they can always trade down to non-branded products if the branded versions are too expensive.
Molson Coors’s average quarterly sales volumes have shrunk by 6.8% over the last two years. This decrease isn’t ideal because the quantity demanded for consumer staples products is typically stable. 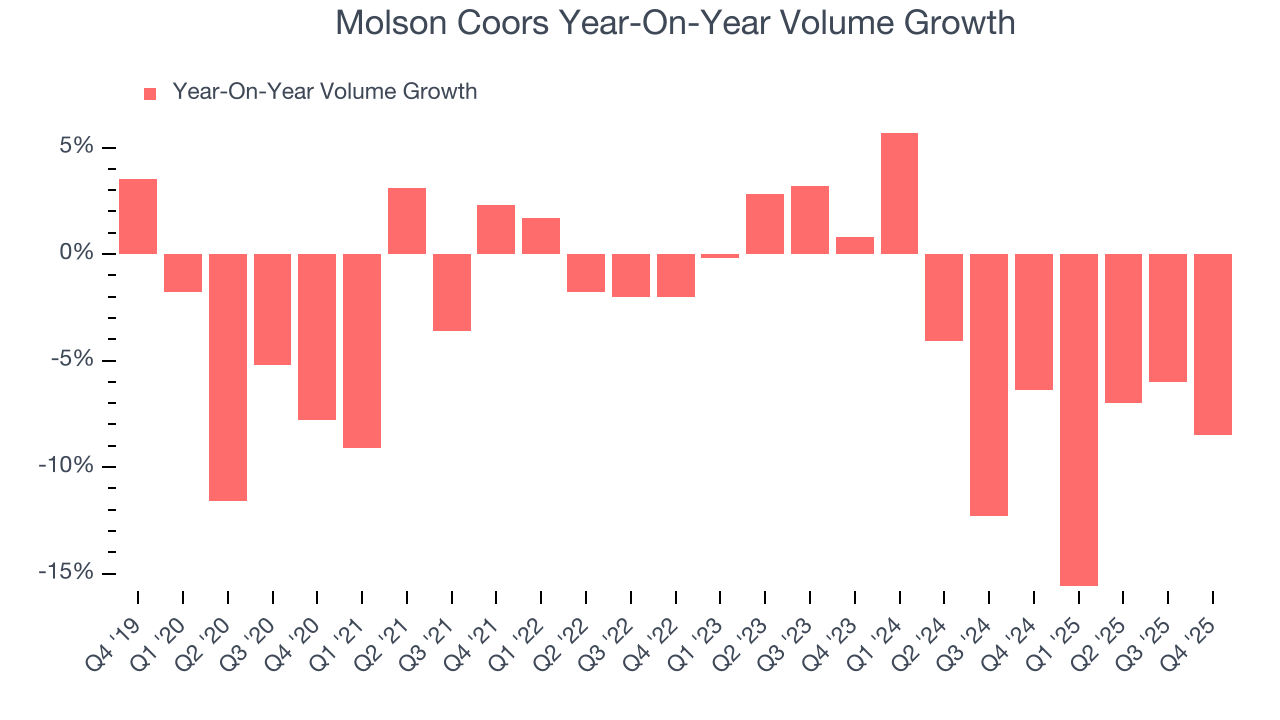
In Molson Coors’s Q4 2025, sales volumes dropped 8.5% year on year. This result represents a further deceleration from its historical levels, showing the business is struggling to move its products.
7. Gross Margin & Pricing Power
At StockStory, we prefer high gross margin businesses because they indicate pricing power or differentiated products, giving the company a chance to generate higher operating profits.
Molson Coors has good unit economics for a consumer staples company, giving it the opportunity to invest in areas such as marketing and talent to stay competitive. As you can see below, it averaged an impressive 38.7% gross margin over the last two years. That means for every $100 in revenue, $61.31 went towards paying for raw materials, production of goods, transportation, and distribution. 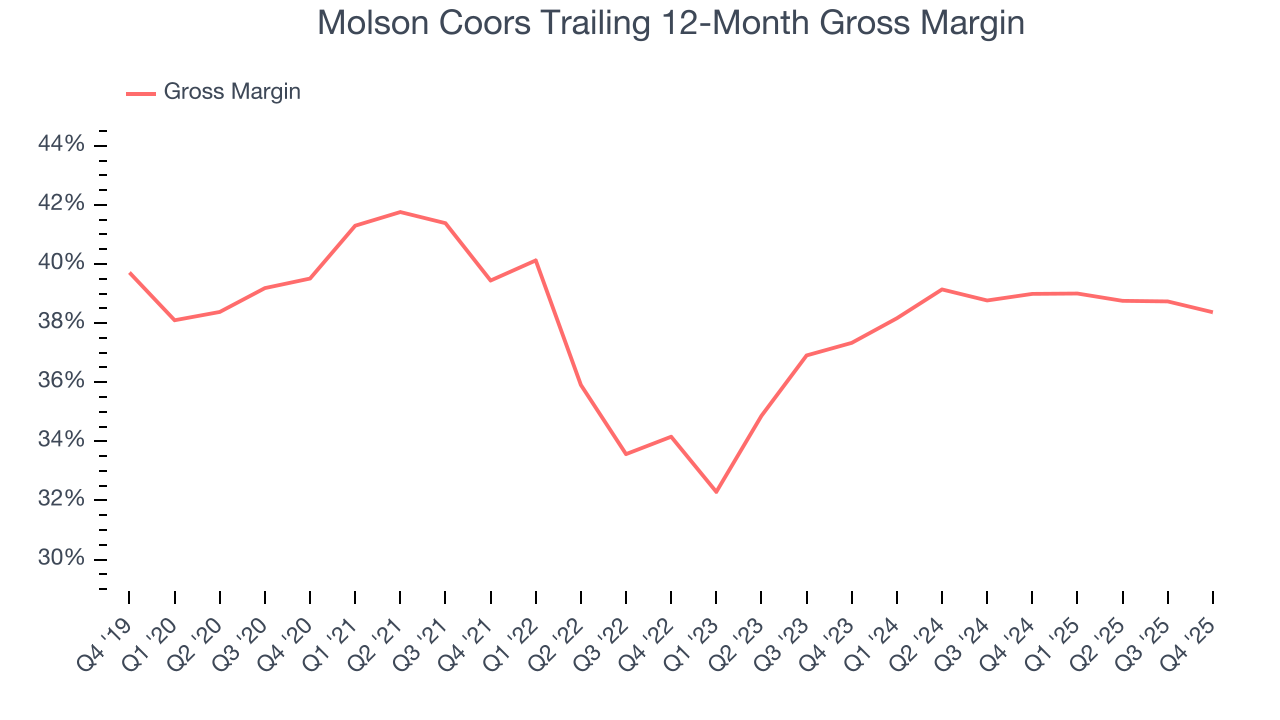
Molson Coors produced a 36.4% gross profit margin in Q4, down 1.6 percentage points year on year. On a wider time horizon, the company’s full-year margin has remained steady over the past four quarters, suggesting its input costs (such as raw materials and manufacturing expenses) have been stable and it isn’t under pressure to lower prices.
8. Operating Margin
Operating margin is an important measure of profitability accounting for key expenses such as marketing and advertising, IT systems, wages, and other administrative costs.
Although Molson Coors was profitable this quarter from an operational perspective, it’s generally struggled over a longer time period. Its expensive cost structure has contributed to an average operating margin of negative 2.6% over the last two years. Unprofitable public companies are rare in the defensive consumer staples industry, so this performance certainly caught our eye.
Looking at the trend in its profitability, Molson Coors’s operating margin decreased by 36.1 percentage points over the last year. This raises questions about the company’s expense base because its revenue growth should have given it leverage on its fixed costs, resulting in better economies of scale and profitability. Molson Coors’s performance was poor no matter how you look at it - it shows that costs were rising and it couldn’t pass them onto its customers.
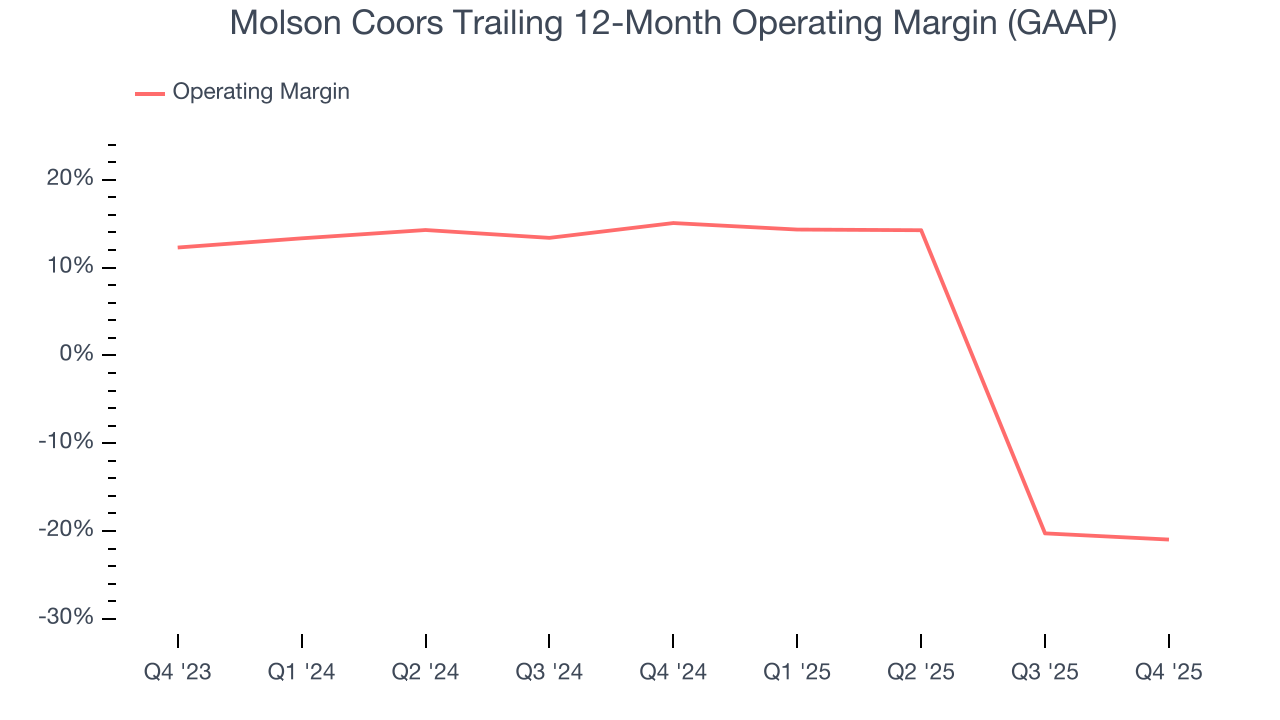
In Q4, Molson Coors generated an operating margin profit margin of 12.2%, down 2 percentage points year on year. Since Molson Coors’s operating margin decreased more than its gross margin, we can assume it was less efficient because expenses such as marketing, and administrative overhead increased.
9. Earnings Per Share
Revenue trends explain a company’s historical growth, but the long-term change in earnings per share (EPS) points to the profitability of that growth – for example, a company could inflate its sales through excessive spending on advertising and promotions.
Molson Coors’s EPS grew at a solid 9.8% compounded annual growth rate over the last three years, higher than its 1.4% annualized revenue growth. This tells us the company became more profitable on a per-share basis as it expanded.
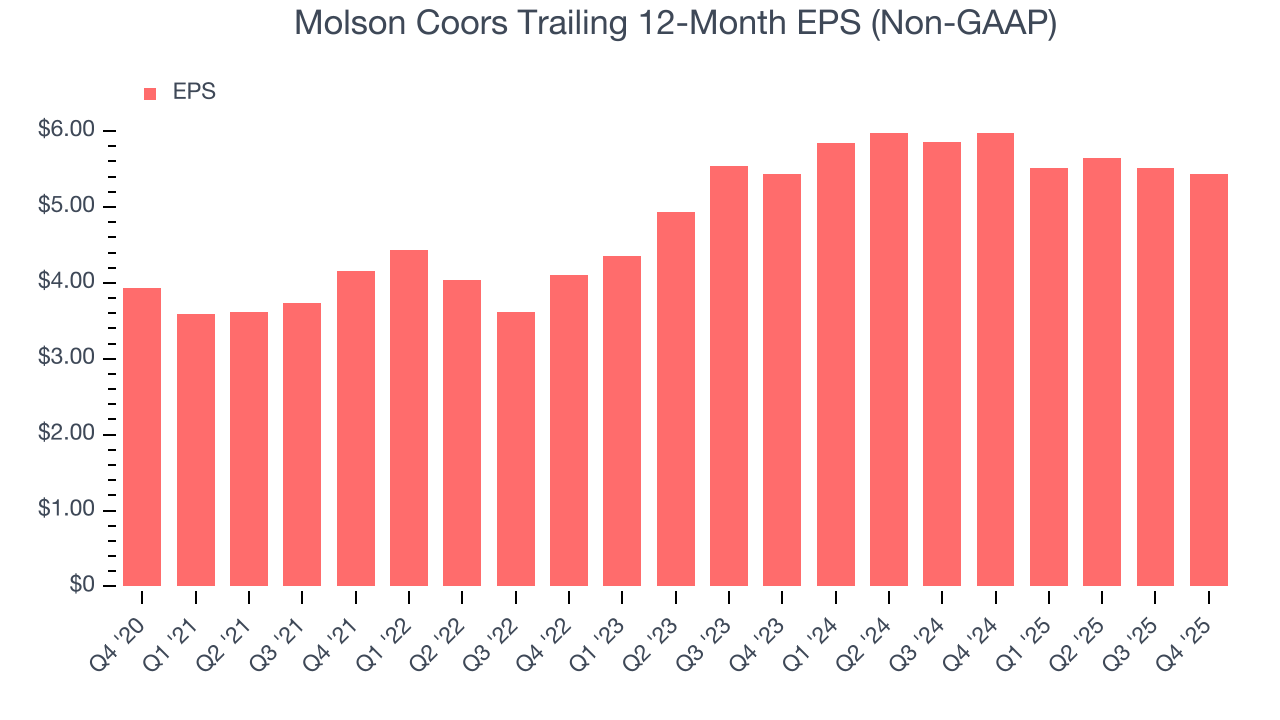
In Q4, Molson Coors reported adjusted EPS of $1.21, down from $1.30 in the same quarter last year. Despite falling year on year, this print beat analysts’ estimates by 4.9%. Over the next 12 months, Wall Street expects Molson Coors’s full-year EPS of $5.43 to grow 1.2%.
10. Cash Is King
Although earnings are undoubtedly valuable for assessing company performance, we believe cash is king because you can’t use accounting profits to pay the bills.
Molson Coors has shown robust cash profitability, driven by its attractive business model that enables it to reinvest or return capital to investors. The company’s free cash flow margin averaged 10.3% over the last two years, quite impressive for a consumer staples business. The divergence from its underwhelming operating margin stems from the add-back of non-cash charges like depreciation and stock-based compensation. GAAP operating profit expenses these line items, but free cash flow does not.
Taking a step back, we can see that Molson Coors’s margin dropped by 1.2 percentage points over the last year. Continued declines could signal it is in the middle of an investment cycle.
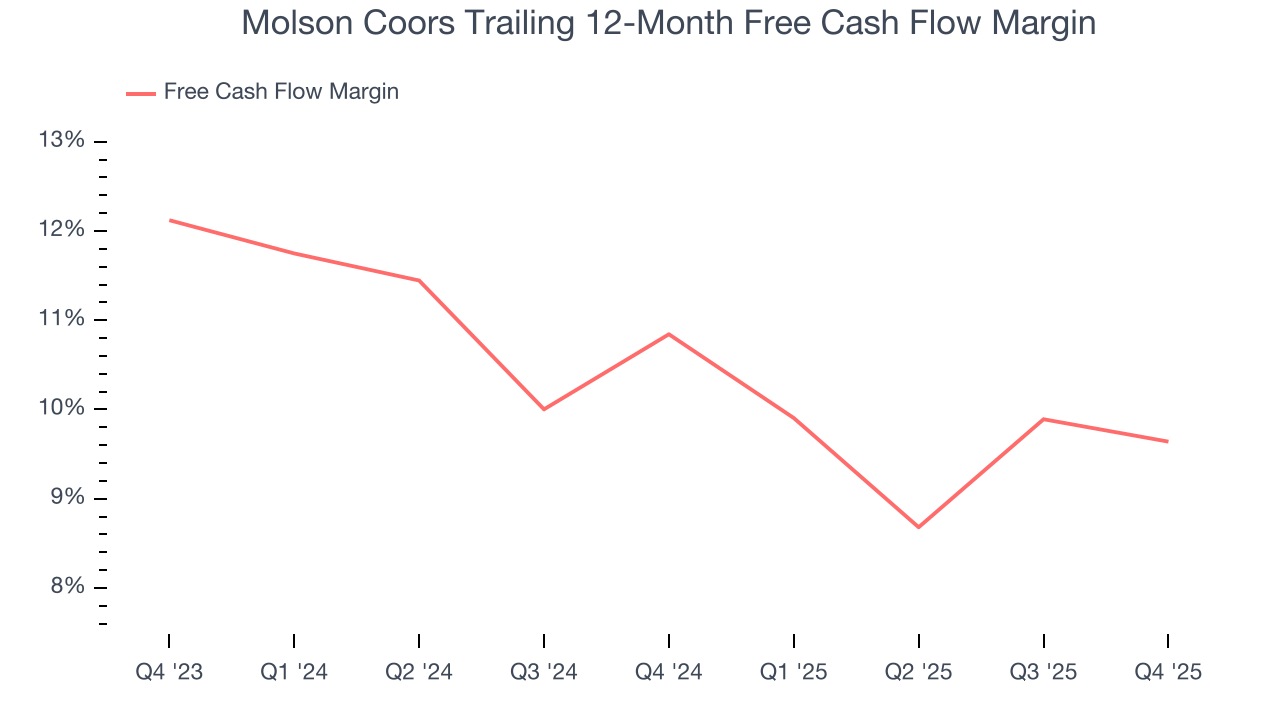
Molson Coors’s free cash flow clocked in at $357.8 million in Q4, equivalent to a 13.4% margin. This cash profitability was in line with the comparable period last year and above its two-year average.
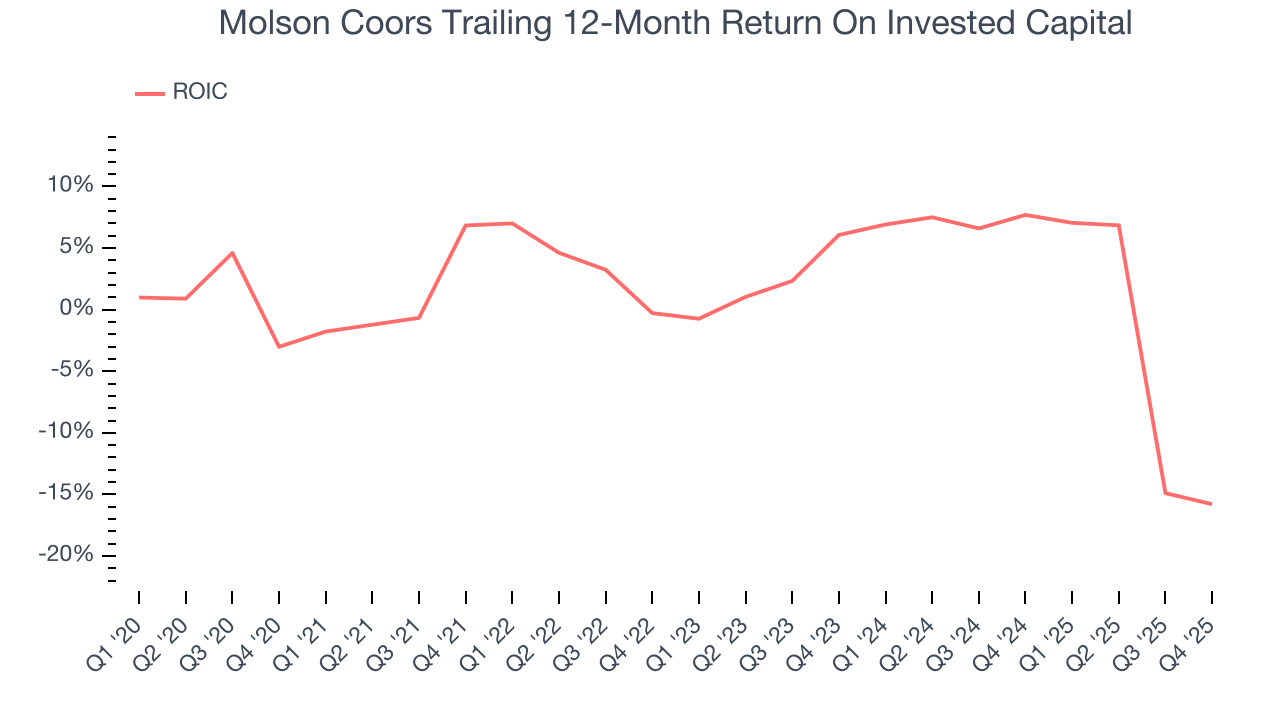
11. Return on Invested Capital (ROIC)
EPS and free cash flow tell us whether a company was profitable while growing its revenue. But was it capital-efficient? A company’s ROIC explains this by showing how much operating profit it makes compared to the money it has raised (debt and equity).
Molson Coors historically did a mediocre job investing in profitable growth initiatives. Its five-year average ROIC was 0.9%, lower than the typical cost of capital (how much it costs to raise money) for consumer staples companies.
12. Balance Sheet Assessment
Molson Coors reported $896.5 million of cash and $6.3 billion of debt on its balance sheet in the most recent quarter. As investors in high-quality companies, we primarily focus on two things: 1) that a company’s debt level isn’t too high and 2) that its interest payments are not excessively burdening the business.
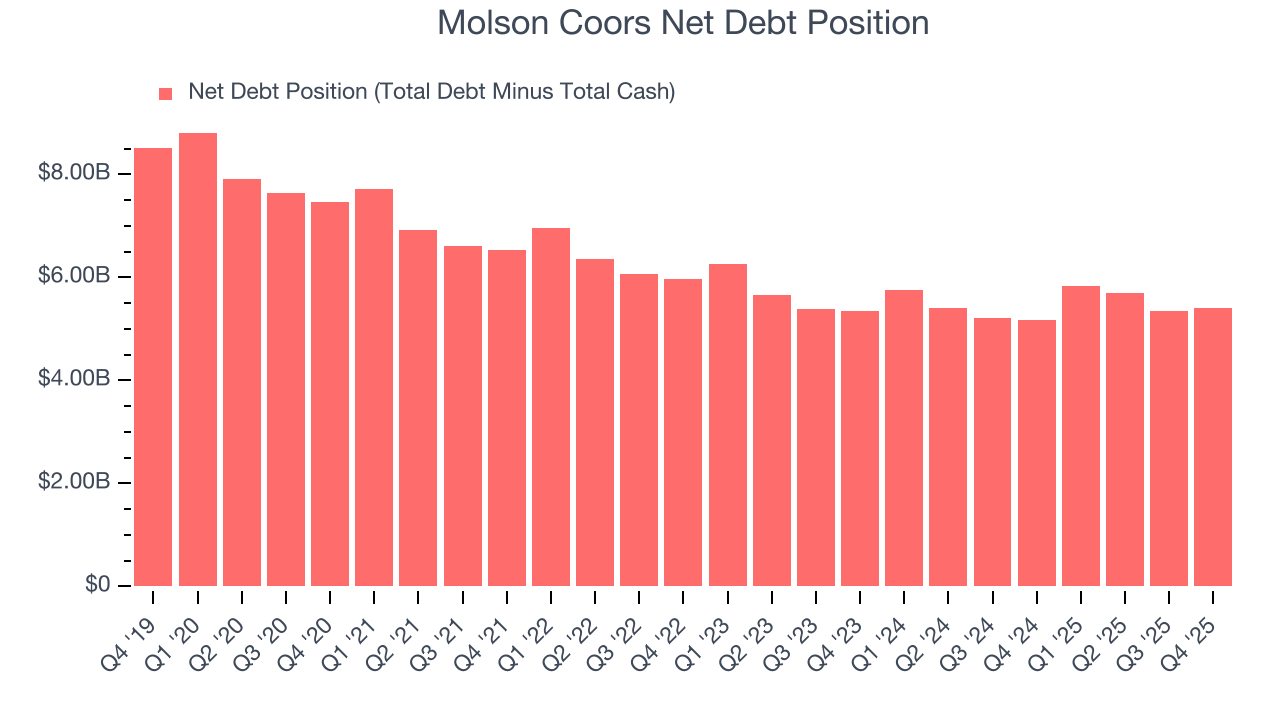
With $2.32 billion of EBITDA over the last 12 months, we view Molson Coors’s 2.3× net-debt-to-EBITDA ratio as safe. We also see its $171.1 million of annual interest expenses as appropriate. The company’s profits give it plenty of breathing room, allowing it to continue investing in growth initiatives.
13. Key Takeaways from Molson Coors’s Q4 Results
It was encouraging to see Molson Coors beat analysts’ EBITDA expectations this quarter. We were also glad its EPS outperformed Wall Street’s estimates. On the other hand, its revenue missed and its gross margin fell slightly short of Wall Street’s estimates. Zooming out, we think this was a mixed quarter. Investors were likely hoping for more, and shares traded down 6.8% to $47.38 immediately after reporting.
14. Is Now The Time To Buy Molson Coors?
Updated: March 15, 2026 at 10:49 PM EDT
A common mistake we notice when investors are deciding whether to buy a stock or not is that they simply look at the latest earnings results. Business quality and valuation matter more, so we urge you to understand these dynamics as well.
We see the value of companies helping consumers, but in the case of Molson Coors, we’re out. To begin with, its revenue growth was weak over the last three years, and analysts expect its demand to deteriorate over the next 12 months. While its strong free cash flow generation allows it to invest in growth initiatives while maintaining an ample cushion, the downside is its declining operating margin shows the business has become less efficient. On top of that, its projected EPS for the next year is lacking.
Molson Coors’s P/E ratio based on the next 12 months is 9.2x. While this valuation is optically cheap, the potential downside is huge given its shaky fundamentals. There are better stocks to buy right now.
Wall Street analysts have a consensus one-year price target of $48 on the company (compared to the current share price of $43.69).