AAON (AAON)
We aren’t fans of AAON. Its poor sales growth and falling returns on capital suggest its growth opportunities are shrinking.― StockStory Analyst Team
1. News


2. Summary
Why AAON Is Not Exciting
Backed by two million square feet of lab testing space, AAON (NASDAQ:AAON) makes heating, ventilation, and air conditioning equipment for different types of buildings.
- Cash-burning history and the downward spiral in its margin profile make us wonder if it has a viable business model
- Incremental sales over the last five years were less profitable as its 6.5% annual earnings per share growth lagged its revenue gains
- A consolation is that its annual revenue growth of 22.9% over the past five years was outstanding, reflecting market share gains this cycle


AAON doesn’t satisfy our quality benchmarks. We see more lucrative opportunities elsewhere.
Why There Are Better Opportunities Than AAON


AAON’s stock price of $78.35 implies a valuation ratio of 39.9x forward P/E. Not only is AAON’s multiple richer than most industrials peers, but it’s also expensive for its fundamentals.
We prefer to invest in similarly-priced but higher-quality companies with superior earnings growth.
3. AAON (AAON) Research Report: Q4 CY2025 Update
Heating and cooling solutions company AAON (NASDAQ:AAON) reported Q4 CY2025 results beating Wall Street’s revenue expectations, with sales up 42.5% year on year to $424.2 million. Its non-GAAP profit of $0.39 per share was 15.2% below analysts’ consensus estimates.
AAON (AAON) Q4 CY2025 Highlights:
- Revenue: $424.2 million vs analyst estimates of $374.1 million (42.5% year-on-year growth, 13.4% beat)
- Adjusted EPS: $0.39 vs analyst expectations of $0.46 (15.2% miss)
- Adjusted EBITDA: $64.44 million vs analyst estimates of $76.3 million (15.2% margin, 15.5% miss)
- Operating Margin: 10.4%, in line with the same quarter last year
- Free Cash Flow was -$43.18 million compared to -$95.44 million in the same quarter last year
- Backlog: $1.83 billion at quarter end, up 111% year on year
- Market Capitalization: $8.25 billion
Company Overview
Backed by two million square feet of lab testing space, AAON (NASDAQ:AAON) makes heating, ventilation, and air conditioning equipment for different types of buildings.
The company offers an extensive range of products, including rooftop HVAC units, chillers, and air handling units. It also has a specific segment that solely designs climate control systems for data centers and other niche fields like hospital surgery rooms. Its products are known for features like energy efficiency and customization, which is what allows it to serve commercial, industrial, and residential markets.
The company generates revenue primarily through the one-off sales of its equipment to American commercial, industrial, and residential builders and contractors. It breaks down its gross sales into three sub-segments: BASX, which makes climate control solutions for niche projects like data centers, and AAON Coil Products and AAON Oklahoma, which makes climate control systems more conventional needs. The BASX segment makes up a small chunk of its revenue, with Coil Products and Oklahoma segment leading the way.
4. HVAC and Water Systems
Many HVAC and water systems companies sell essential, non-discretionary infrastructure for buildings. Since the useful lives of these water heaters and vents are fairly standard, these companies have a portion of predictable replacement revenue. In the last decade, trends in energy efficiency and clean water are driving innovation that is leading to incremental demand. On the other hand, new installations for these companies are at the whim of residential and commercial construction volumes, which tend to be cyclical and can be impacted heavily by economic factors such as interest rates.
Competitors also making HVAC products include Lennox (NYSE:LII), Carrier Global (NYSE:CARR), and Trane (NYSE:TT)
5. Revenue Growth
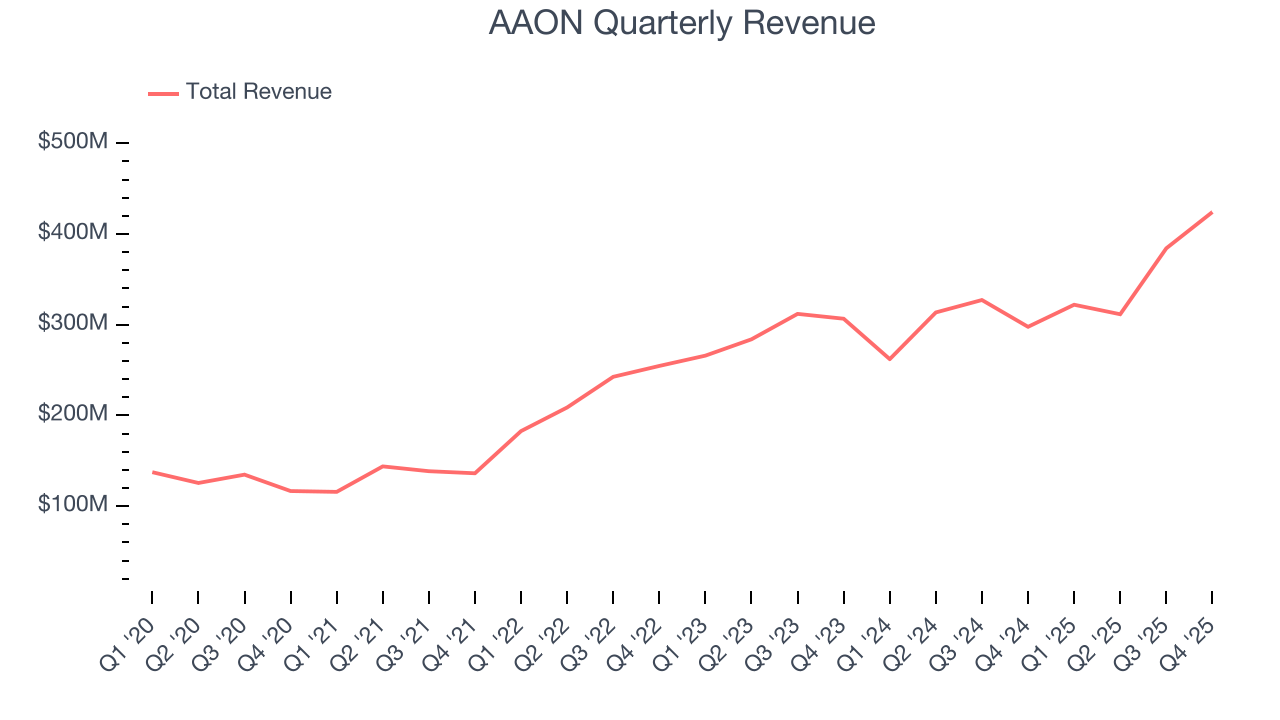
A company’s long-term sales performance can indicate its overall quality. Any business can have short-term success, but a top-tier one grows for years. Luckily, AAON’s sales grew at an incredible 22.9% compounded annual growth rate over the last five years. Its growth beat the average industrials company and shows its offerings resonate with customers.
We at StockStory place the most emphasis on long-term growth, but within industrials, a half-decade historical view may miss cycles, industry trends, or a company capitalizing on catalysts such as a new contract win or a successful product line. AAON’s annualized revenue growth of 11.1% over the last two years is below its five-year trend, but we still think the results suggest healthy demand. 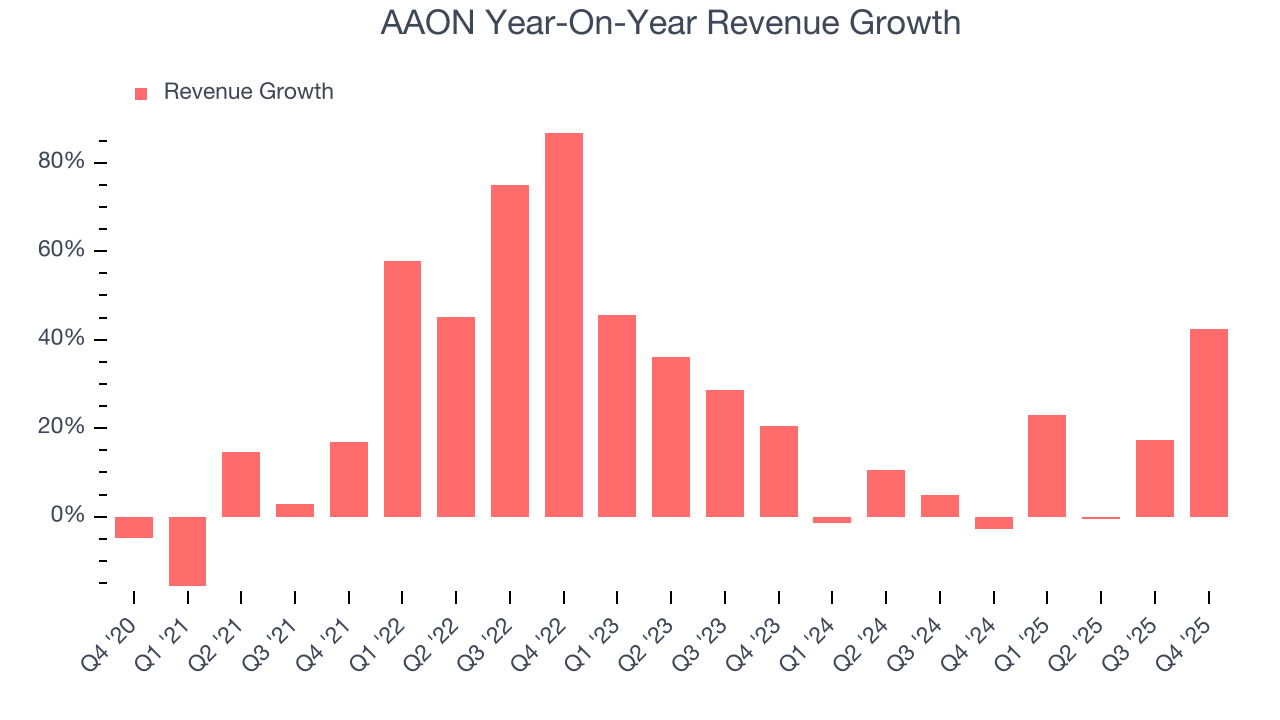
We can better understand the company’s revenue dynamics by analyzing its backlog, or the value of its outstanding orders that have not yet been executed or delivered. AAON’s backlog reached $1.83 billion in the latest quarter and averaged 95.5% year-on-year growth over the last two years. Because this number is better than its revenue growth, we can see the company accumulated more orders than it could fulfill and deferred revenue to the future. This could imply elevated demand for AAON’s products and services but raises concerns about capacity constraints. 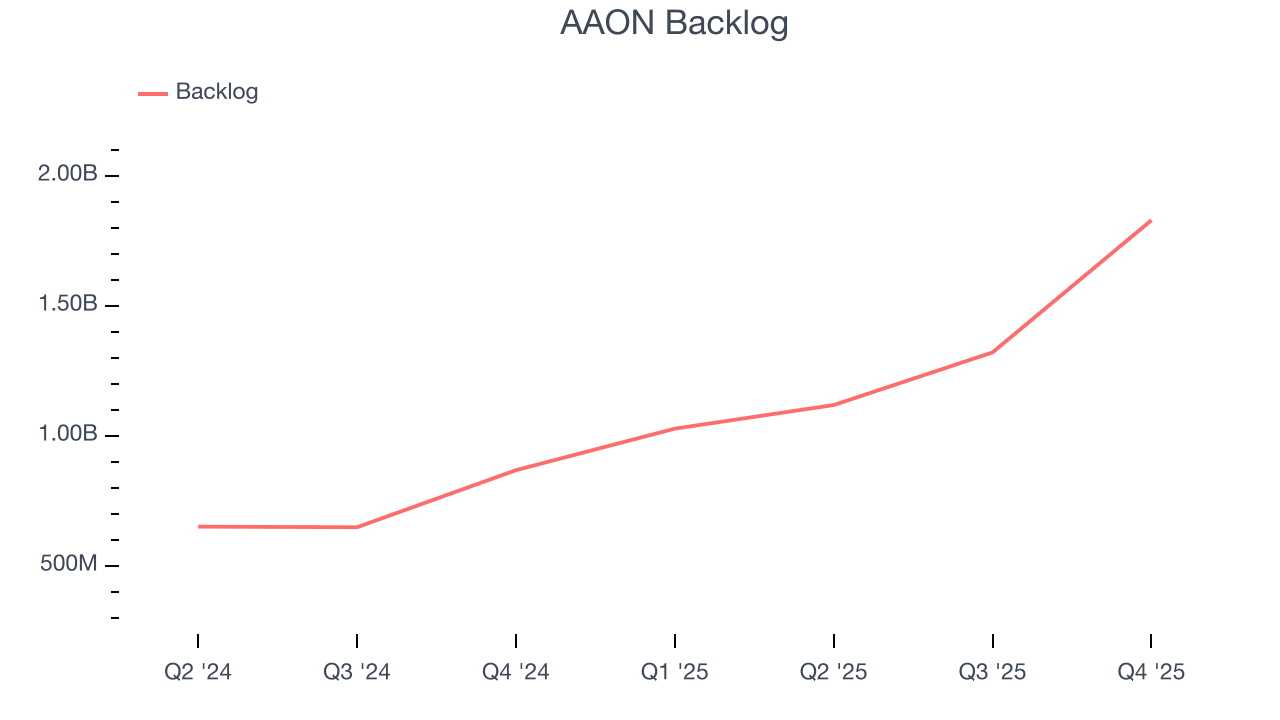
This quarter, AAON reported magnificent year-on-year revenue growth of 42.5%, and its $424.2 million of revenue beat Wall Street’s estimates by 13.4%.
Looking ahead, sell-side analysts expect revenue to grow 8.7% over the next 12 months, a slight deceleration versus the last two years. Despite the slowdown, this projection is above average for the sector and implies the market is forecasting some success for its newer products and services.
6. Gross Margin & Pricing Power
AAON’s gross margin is slightly below the average industrials company, giving it less room to invest in areas such as research and development. As you can see below, it averaged a 29.7% gross margin over the last five years. That means AAON paid its suppliers a lot of money ($70.25 for every $100 in revenue) to run its business. 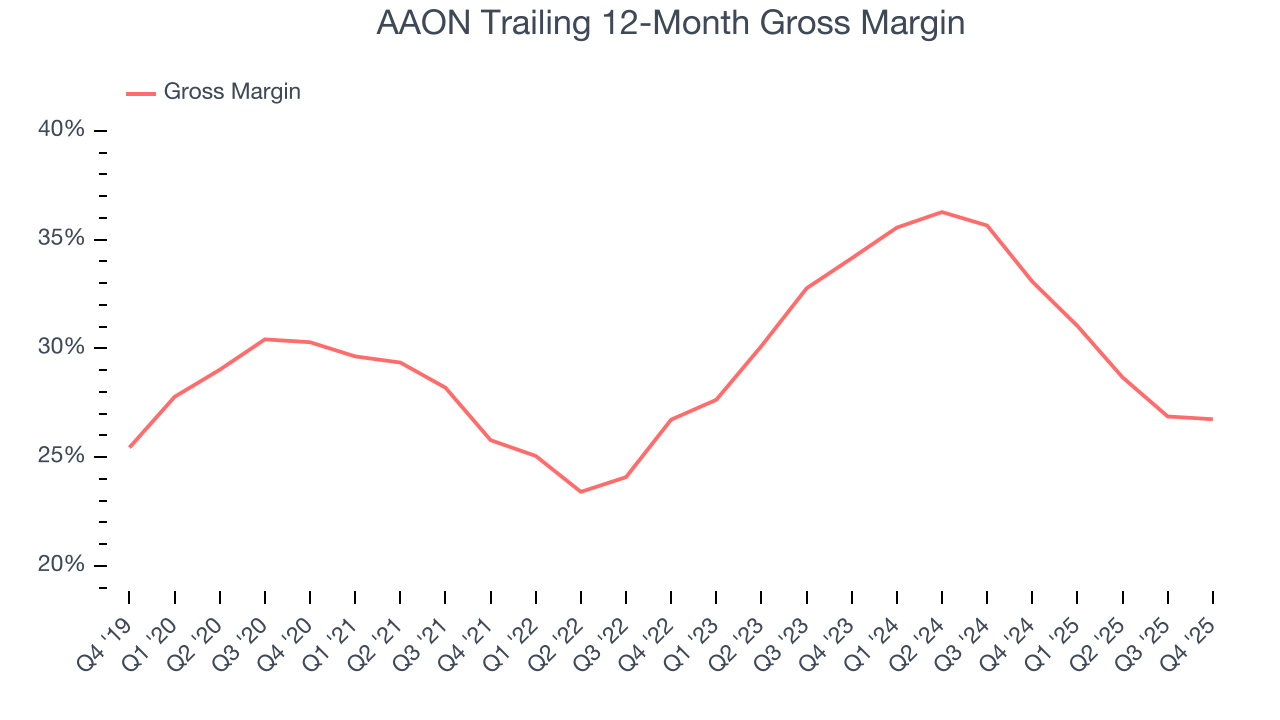
In Q4, AAON produced a 25.9% gross profit margin, in line with the same quarter last year. On a wider time horizon, AAON’s full-year margin has been trending down over the past 12 months, decreasing by 6.3 percentage points. If this move continues, it could suggest deteriorating pricing power and higher input costs (such as raw materials and manufacturing expenses).
7. Operating Margin
Operating margin is one of the best measures of profitability because it tells us how much money a company takes home after procuring and manufacturing its products, marketing and selling those products, and most importantly, keeping them relevant through research and development.
AAON has been an efficient company over the last five years. It was one of the more profitable businesses in the industrials sector, boasting an average operating margin of 15.2%. This result was particularly impressive because of its low gross margin, which is mostly a factor of what it sells and takes huge shifts to move meaningfully. Companies have more control over their operating margins, and it’s a show of well-managed operations if they’re high when gross margins are low.
Analyzing the trend in its profitability, AAON’s operating margin decreased by 3.7 percentage points over the last five years. This raises questions about the company’s expense base because its revenue growth should have given it leverage on its fixed costs, resulting in better economies of scale and profitability.
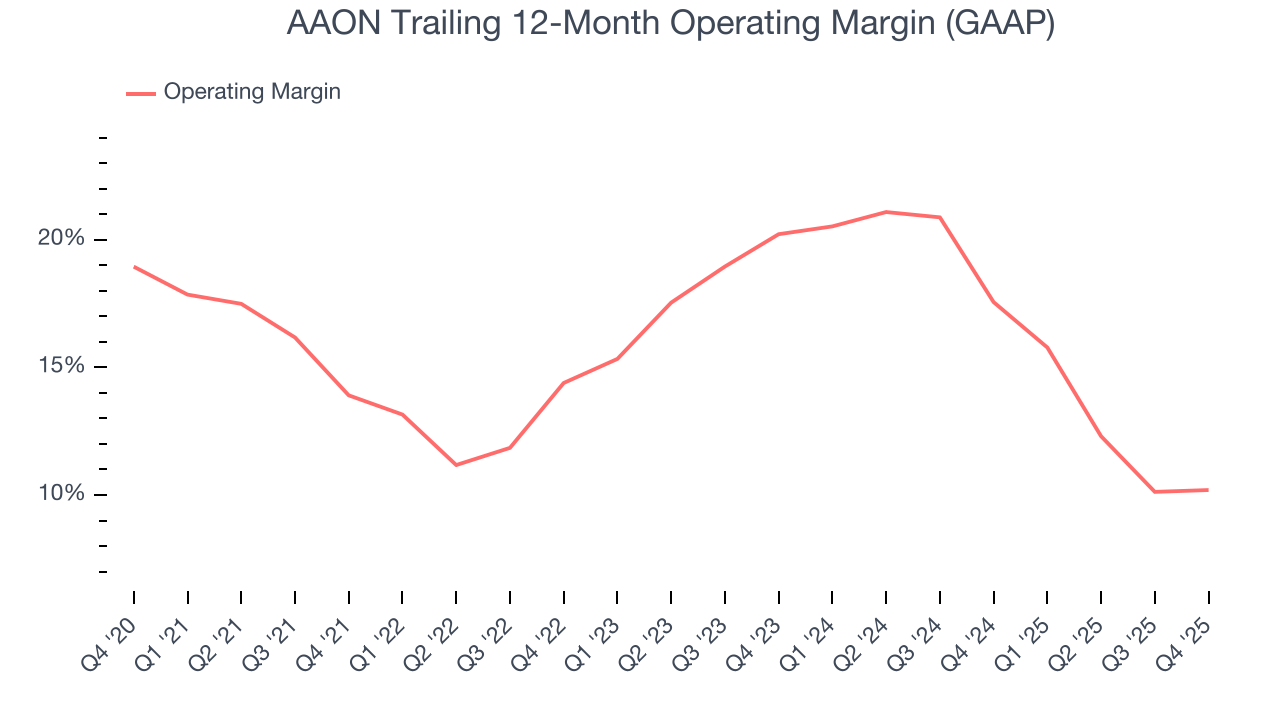
This quarter, AAON generated an operating margin profit margin of 10.4%, in line with the same quarter last year. This indicates the company’s cost structure has recently been stable.
8. Earnings Per Share
We track the long-term change in earnings per share (EPS) for the same reason as long-term revenue growth. Compared to revenue, however, EPS highlights whether a company’s growth is profitable.
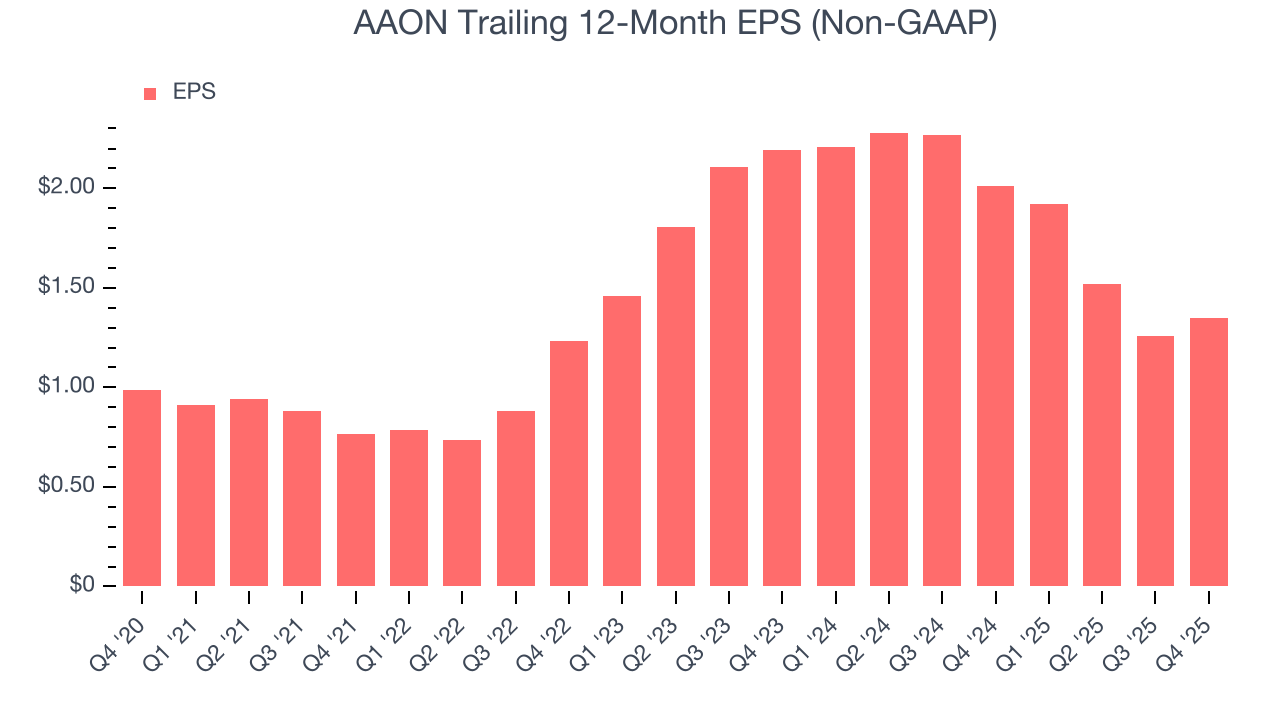
AAON’s EPS grew at an unimpressive 6.5% compounded annual growth rate over the last five years, lower than its 22.9% annualized revenue growth. This tells us the company became less profitable on a per-share basis as it expanded.
Diving into the nuances of AAON’s earnings can give us a better understanding of its performance. As we mentioned earlier, AAON’s operating margin was flat this quarter but declined by 3.7 percentage points over the last five years. Its share count also grew by 3.7%, meaning the company not only became less efficient with its operating expenses but also diluted its shareholders. 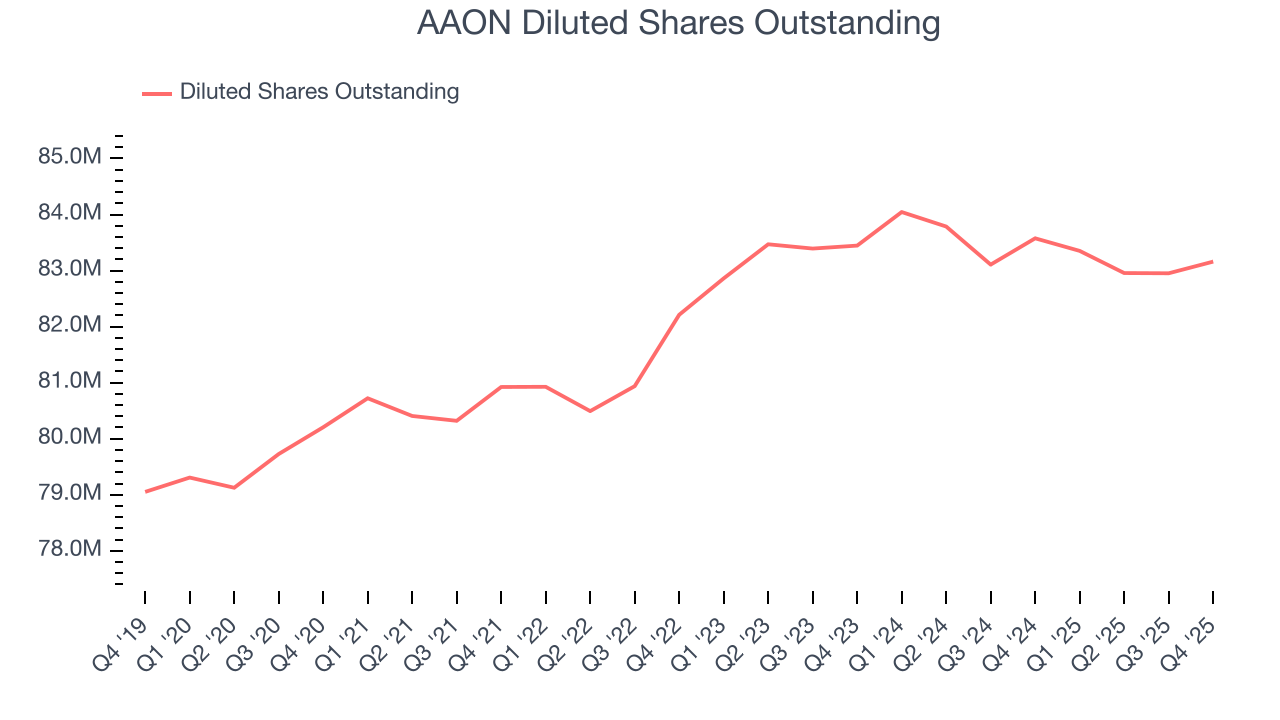
Like with revenue, we analyze EPS over a shorter period to see if we are missing a change in the business.
For AAON, its two-year annual EPS declines of 21.5% show it’s continued to underperform. These results were bad no matter how you slice the data.
In Q4, AAON reported adjusted EPS of $0.39, up from $0.30 in the same quarter last year. Despite growing year on year, this print missed analysts’ estimates. Over the next 12 months, Wall Street expects AAON’s full-year EPS of $1.35 to grow 48%.
9. Cash Is King
If you’ve followed StockStory for a while, you know we emphasize free cash flow. Why, you ask? We believe that in the end, cash is king, and you can’t use accounting profits to pay the bills.
AAON’s demanding reinvestments have drained its resources over the last five years, putting it in a pinch and limiting its ability to return capital to investors. Its free cash flow margin averaged negative 2.4%, meaning it lit $2.40 of cash on fire for every $100 in revenue. This is a stark contrast from its operating margin, and its investments in working capital/capital expenditures are the primary culprit.
Taking a step back, we can see that AAON’s margin dropped by 14.3 percentage points during that time. Almost any movement in the wrong direction is undesirable because it is already burning cash. If the trend continues, it could signal it’s becoming a more capital-intensive business.
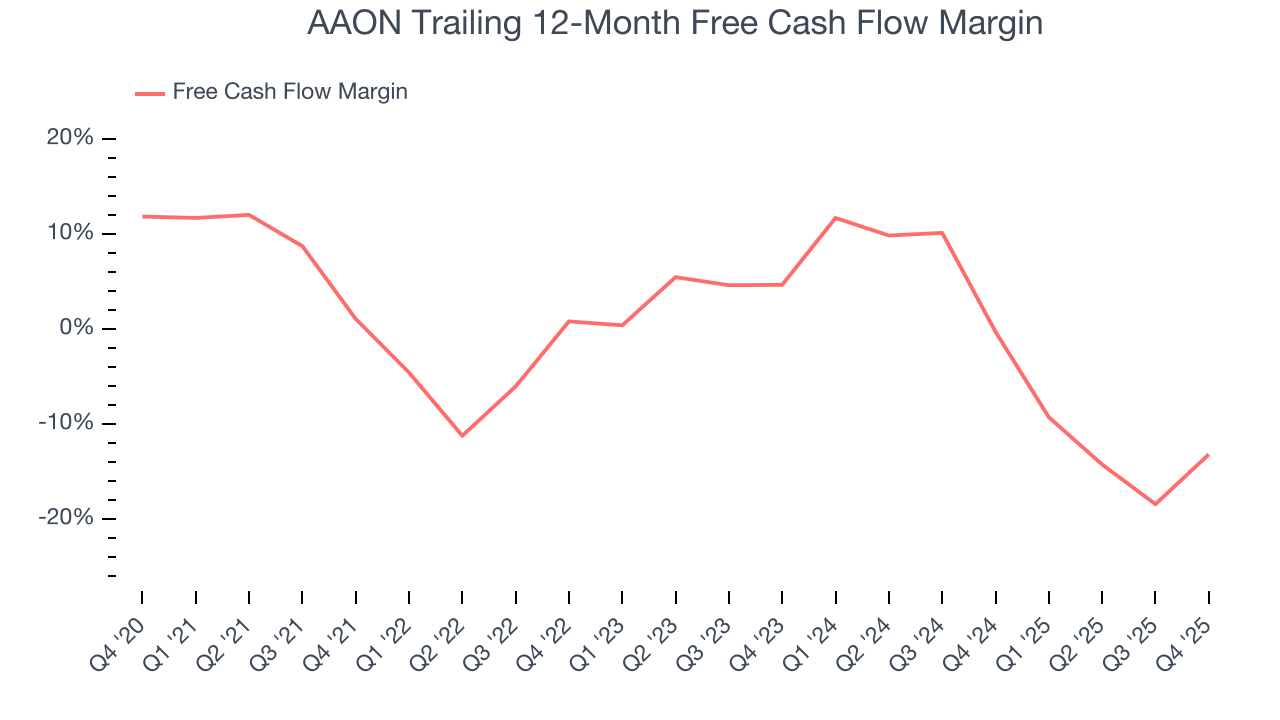
AAON burned through $43.18 million of cash in Q4, equivalent to a negative 10.2% margin. The company’s cash burn slowed from $95.44 million of lost cash in the same quarter last year.
10. Return on Invested Capital (ROIC)
EPS and free cash flow tell us whether a company was profitable while growing its revenue. But was it capital-efficient? Enter ROIC, a metric showing how much operating profit a company generates relative to the money it has raised (debt and equity).
Although AAON hasn’t been the highest-quality company lately, it found a few growth initiatives in the past that worked out wonderfully. Its five-year average ROIC was 18.4%, splendid for an industrials business.
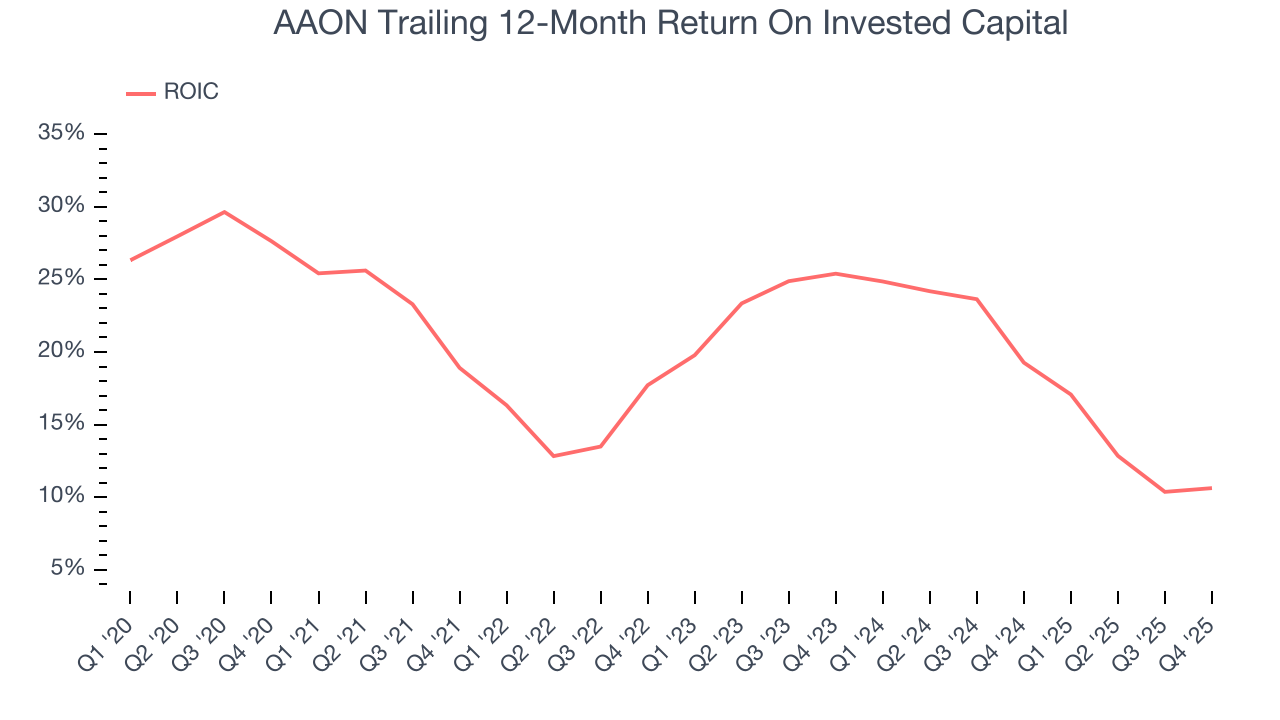
We like to invest in businesses with high returns, but the trend in a company’s ROIC is what often surprises the market and moves the stock price. On average, AAON’s ROIC decreased by 3.4 percentage points annually each year over the last few years. We like what management has done in the past, but its declining returns are perhaps a symptom of fewer profitable growth opportunities.
11. Balance Sheet Assessment
AAON reported $1.24 million of cash and $398.3 million of debt on its balance sheet in the most recent quarter. As investors in high-quality companies, we primarily focus on two things: 1) that a company’s debt level isn’t too high and 2) that its interest payments are not excessively burdening the business.
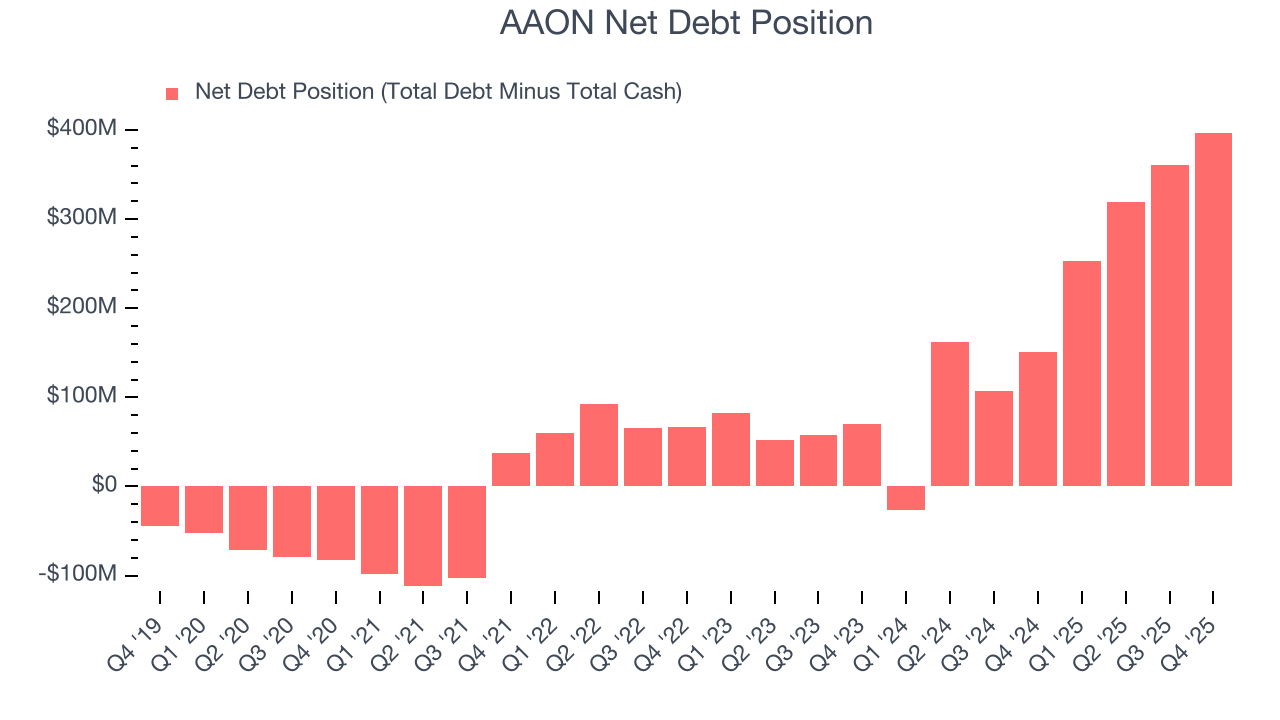
With $231.3 million of EBITDA over the last 12 months, we view AAON’s 1.7× net-debt-to-EBITDA ratio as safe. We also see its $6.20 million of annual interest expenses as appropriate. The company’s profits give it plenty of breathing room, allowing it to continue investing in growth initiatives.
12. Key Takeaways from AAON’s Q4 Results
We were impressed by how significantly AAON blew past analysts’ revenue expectations this quarter. On the other hand, its EBITDA missed and its EPS fell short of Wall Street’s estimates. Overall, this was a weaker quarter. The stock traded down 2.7% to $98.41 immediately after reporting.
13. Is Now The Time To Buy AAON?
Updated: March 18, 2026 at 11:23 PM EDT
Before investing in or passing on AAON, we urge you to understand the company’s business quality (or lack thereof), valuation, and the latest quarterly results - in that order.
AAON isn’t a terrible business, but it doesn’t pass our bar. Although its revenue growth was exceptional over the last five years, it’s expected to deteriorate over the next 12 months and its cash profitability fell over the last five years. And while the company’s backlog growth has been marvelous, the downside is its cash burn raises the question of whether it can sustainably maintain growth.
AAON’s P/E ratio based on the next 12 months is 39.9x. This valuation tells us a lot of optimism is priced in - we think there are better opportunities elsewhere.
Wall Street analysts have a consensus one-year price target of $122.75 on the company (compared to the current share price of $78.35).
Although the price target is bullish, readers should exercise caution because analysts tend to be overly optimistic. The firms they work for, often big banks, have relationships with companies that extend into fundraising, M&A advisory, and other rewarding business lines. As a result, they typically hesitate to say bad things for fear they will lose out. We at StockStory do not suffer from such conflicts of interest, so we’ll always tell it like it is.