
Amazon (AMZN)
We see potential in Amazon. Its revenue and EPS are soaring, showing it can grow quickly and become more profitable as it scales.― StockStory Analyst Team
1. News


2. Summary
Why Amazon Is Interesting
Founded by Jeff Bezos after quitting his stock-picking job at D.E. Shaw, Amazon (NASDAQ:AMZN) is the world’s largest online retailer and provider of cloud computing services.
- Amazon revolutionized the way consumers shop. This isn’t the only tailwind to its impressive revenue growth, as its highly profitable AWS segment has also driven top-line momentum.
- The company's best-in-class revenue growth coupled with modest operating leverage on its past infrastructure investments has led to elite EPS growth over a multi-year period.
- Though dominant, Amazon's capital-intensive e-commerce business means its profitability is structurally lower than its pure-play tech peers. Can the company pull it up, or are we reaching a ceiling?


Amazon shows some promise. If you’re a believer, the price looks reasonable.
Why Is Now The Time To Buy Amazon?


Amazon is trading at $207.30 per share, or 27.4x forward price-to-earnings. Compared to other consumer internet companies, we think this multiple is fair for the revenue growth you get.
This could be a good time to invest if you think there are underappreciated aspects of the business.
3. Amazon (AMZN) Research Report: Q4 CY2025 Update
Cloud computing and online retail behemoth Amazon (NASDAQ:AMZN) beat Wall Street’s revenue expectations in Q4 CY2025, with sales up 13.6% year on year to $213.4 billion. The company expects next quarter’s revenue to be around $176 billion, close to analysts’ estimates. Its GAAP profit of $1.95 per share was in line with analysts’ consensus estimates.
Amazon (AMZN) Q4 CY2025 Highlights:
- Revenue: $213.4 billion vs analyst estimates of $211.6 billion (0.9% beat)
- Operating Profit (GAAP): $24.98 billion vs analyst estimates of $25.08 billion (small miss)
- EPS (GAAP): $1.95 vs analyst expectations of $1.96 (in line)
- North America Revenue: $127.1 billion vs analyst estimates of $127 billion (small beat)
- AWS Revenue: $35.58 billion vs analyst estimates of $34.85 billion (2.1% beat)
- North America Operating Profit: $11.47 billion vs analyst estimates of $10.83 billion (6% beat)
- AWS Operating Profit: $12.47 billion vs analyst estimates of $12.06 billion (3.3% beat)
- Operating Margin: 11.7%, in line with the same quarter last year
- Free Cash Flow Margin: 7%, down from 10.4% in the same quarter last year
- Capex guidance: "we expect to invest about $200 billion in capital expenditures across Amazon in 2026" (>50% year-on-year increase)
- Market Capitalization: $2.49 trillion
Key Topics & Areas Of Debate
For many of Amazon’s big tech peers, the key areas of debate center around revenue growth. Amazon is different, as the focus is on profitable growth due to its consistent reinvestment strategy and the structurally lower margins seen in its e-commerce business, where it must hold physical inventory.
Can Amazon leverage its vast logistics investments of the last two-plus decades while automating more of its operations and leaning into advertising to increase profitability? If so, its North America segment, which consists of its consumer-facing businesses, could see double-digit operating margins in the next few years (it was 11.2% for the last 12 months).
A more profitable North America segment combined with a faster-growing and structurally higher-margin Amazon Web Services (AWS) could mean earnings power that is orders of magnitude larger. Higher earnings typically lead to higher stock prices.
Despite its scale and dominance, Amazon doesn’t operate in a vacuum. Walmart (NYSE:WMT) and Target (NYSE:TGT) - with their improving omnichannel footprints – are competitors to Amazon’s e-commerce and Whole Foods businesses. And while it has a first-mover advantage in the public cloud services market, Alphabet (NASDAQ:GOOGL) and Microsoft (NASDAQ:MSFT) are working hard to catch up.
4. Company Overview
Founded by Jeff Bezos after quitting his stock-picking job at D.E. Shaw, Amazon (NASDAQ:AMZN) is the world’s largest online retailer and provider of cloud computing services.
Amazon is one of the most diverse businesses on earth. It is the largest e-commerce company and facilitates near-unlimited selection for global consumers, all powered by its massive logistics network and Prime membership program. Amazon’s relationship with its over 200 million customers also extends to entertainment, where it produces original content, offers an array of video and audio streaming services, and has a range of hardware from Fire TVs to Kindle tablets.
Although Amazon possesses scale advantages in e-commerce, margins are low, and they’ve been depressed in recent years as it has invested heavily to get that package to your doorstep in just a few days. On the other hand, Amazon Web Services (AWS) and its advertising business have shown robust growth and are tailwinds to overall profitability.
The high-margin AWS is Amazon's crown jewel, offering essential cloud-based services like storage, computing, and database management. It enables businesses to operate online without the need to invest in or maintain their own physical IT infrastructure, and it serves as the backbone for over a million companies, from startups to nearly every Fortune 500 firm like Disney, Netflix, Adobe, and Pfizer. AWS has become indispensable, but this is well known.
The pressing question for investors is: are Amazon's hefty investments in its consumer-facing businesses behind us, or are there more to come?
5. Revenue Growth
Amazon shows that fast growth and massive scale can coexist despite conventional wisdom. The company’s revenue base of $386.1 billion five years ago has increased to $716.9 billion in the last year, translating into an excellent 13.2% annualized growth rate.
Over the same period, Amazon’s big tech peers Alphabet, Microsoft, and Apple put up annualized growth rates of 17.2%, 14.8%, and 8.2%, respectively. Comparing the four is relevant because investors often pit them against each other to derive their valuations. When adjusting for these benchmarks, we think Amazon’s price is fair. 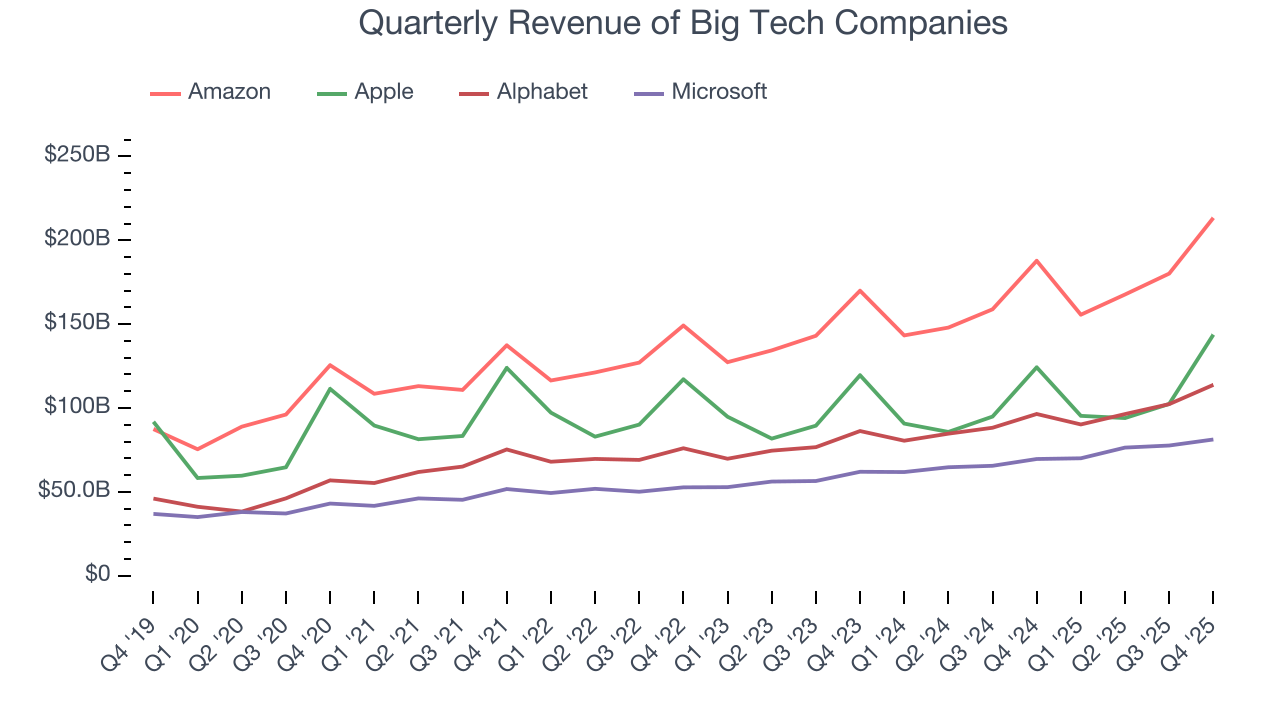
We at StockStory emphasize long-term growth, but for big tech companies, a half-decade historical view may miss emerging trends in AI. Amazon’s annualized revenue growth of 11.7% over the last two years is below its five-year trend, but we still think the results suggest healthy demand. 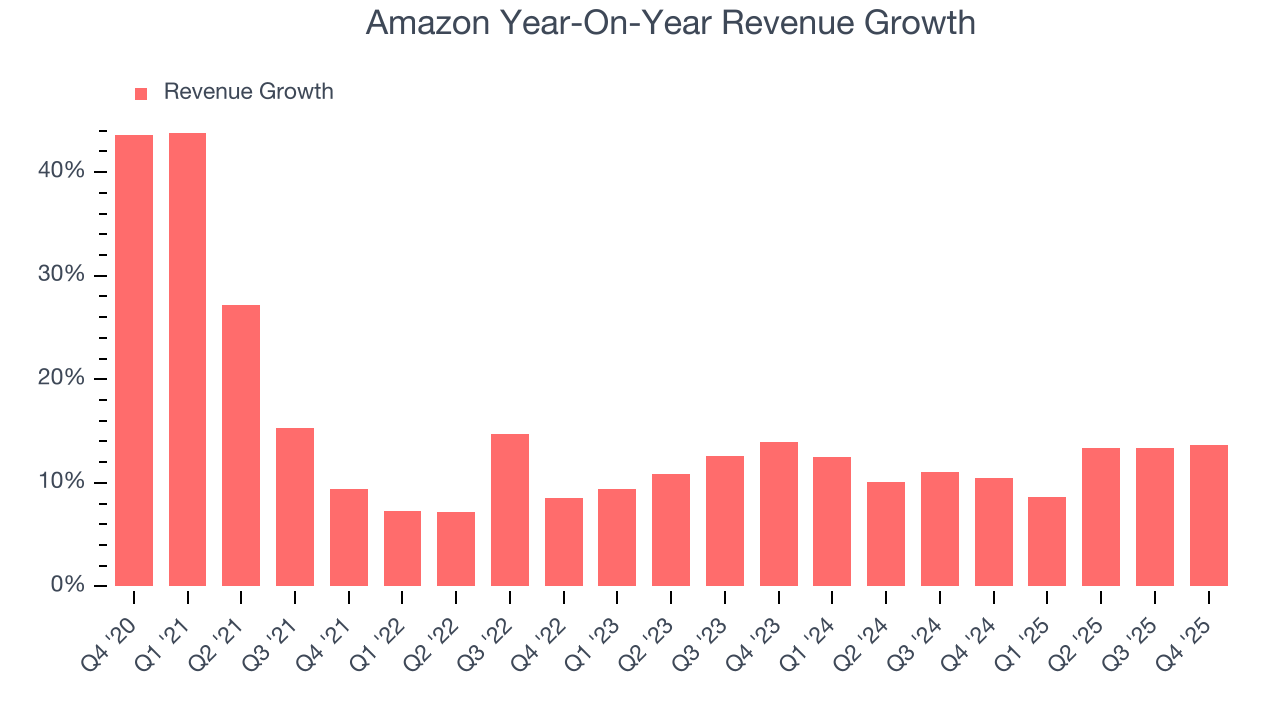
This quarter, Amazon reported year-on-year revenue growth of 13.6%, and its $213.4 billion of revenue exceeded Wall Street’s estimates by 0.9%. Company management is currently guiding for a 13.1% year-on-year increase in sales next quarter. Looking further ahead, sell-side This projection is admirable for a company of its scale and illustrates the market sees some success for its newer products.
6. Profitability: The Key Debate
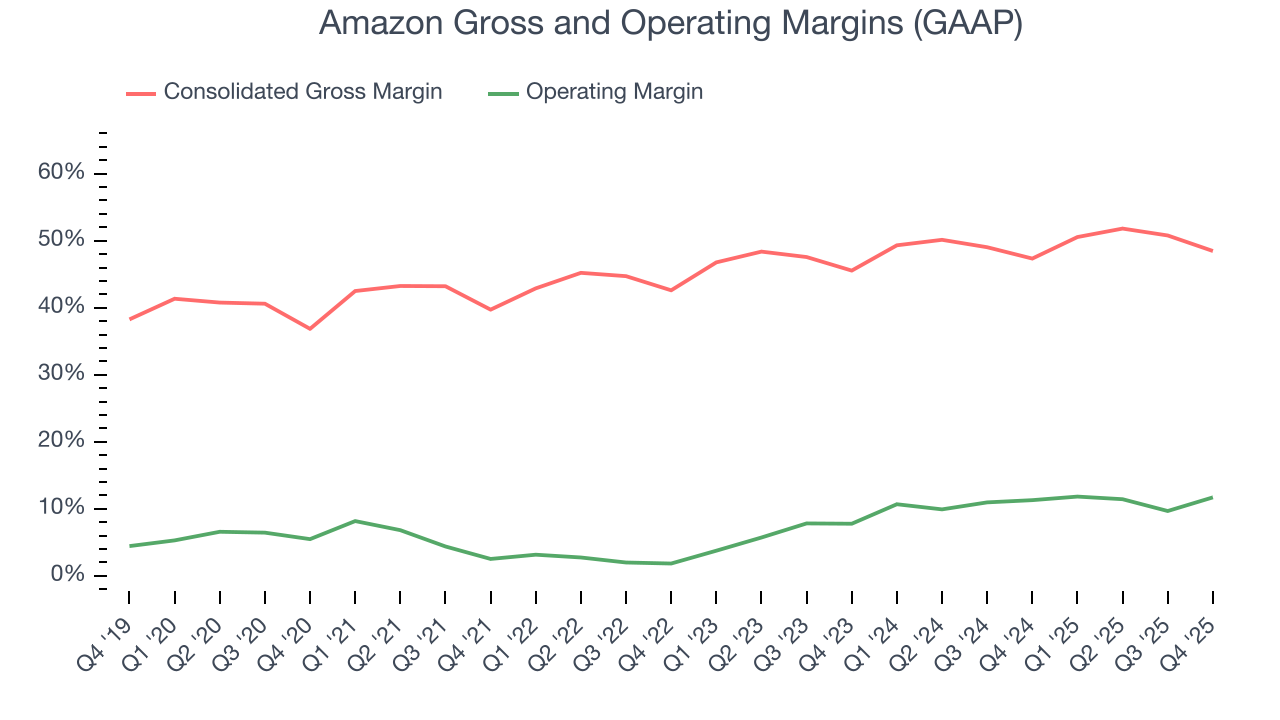
Many investors understand that Amazon’s e-commerce business caps its gross margin, which averaged 46.8% over the last five years. The company lags behind its pure-play tech peers because it sells many commoditized goods online where it must acquire and hold physical inventory.
What the market debates, however, is where Amazon’s long-term operating profitability could ultimately settle. Sure, its five-year margin of 7.6% was mediocre, but it rose by 5.9 percentage points thanks to leverage on the fixed costs in its consumer-facing businesses and the highly profitable AWS segment becoming a larger portion of its revenue. Our question is if Amazon’s momentum can continue and result in a mid-to-high teen percentage margin somewhere down the line.
The company’s North America segment holds the keys to this answer. Throughout the years, Amazon has made huge investments to not only attract hoards of customers into its ecosystem but also retain them. Some areas of focus in this effort included its unmatched delivery network and video streaming content.
Bulls will argue that Amazon can afford to ease up and begin riding its investments of the last two-plus decades. Wall Street seems to agree somewhat and is projecting its trailing 12-month operating margin of 11.2% to reach 12.8% in the coming year. Combined with its performance over the last few years, this suggests Amazon’s long-term profitability could go much higher, potentially leading to earnings and a stock price that follows.
7. North America: The Consumer Business
Revenue: Scale and Dominance
The North America segment operates where Amazon’s fulfillment network is densest: the U.S., Canada, and Mexico. While anchored by the company’s flagship e-commerce business, it also encompasses advertising, third-party seller support services, and Prime memberships.
Specifically, we ask if Amazon can continue scaling e-commerce with its current infrastructure, and whether its emerging, higher-margin businesses like advertising will keep outpacing the broader segment.
All that said, North America’s unprecedented scale makes it the largest part of Amazon’s business at 59.5% of total revenue. It solidified its market leadership over the last five years by growing its sales at a solid 12.5% annualized rate.
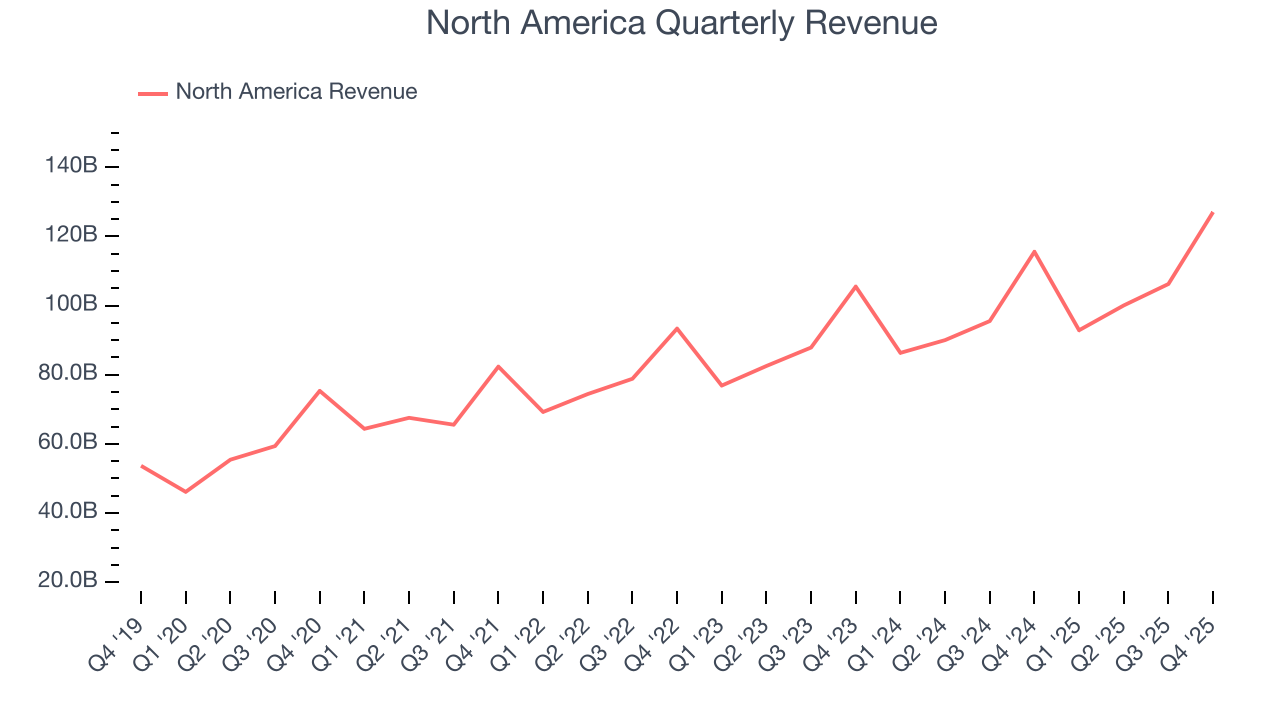
On a two-year basis, growth was 9.9%, a deceleration from its five-year trend. The segment would have decelerated more if it weren’t for advertising, which grew at a higher 21%. 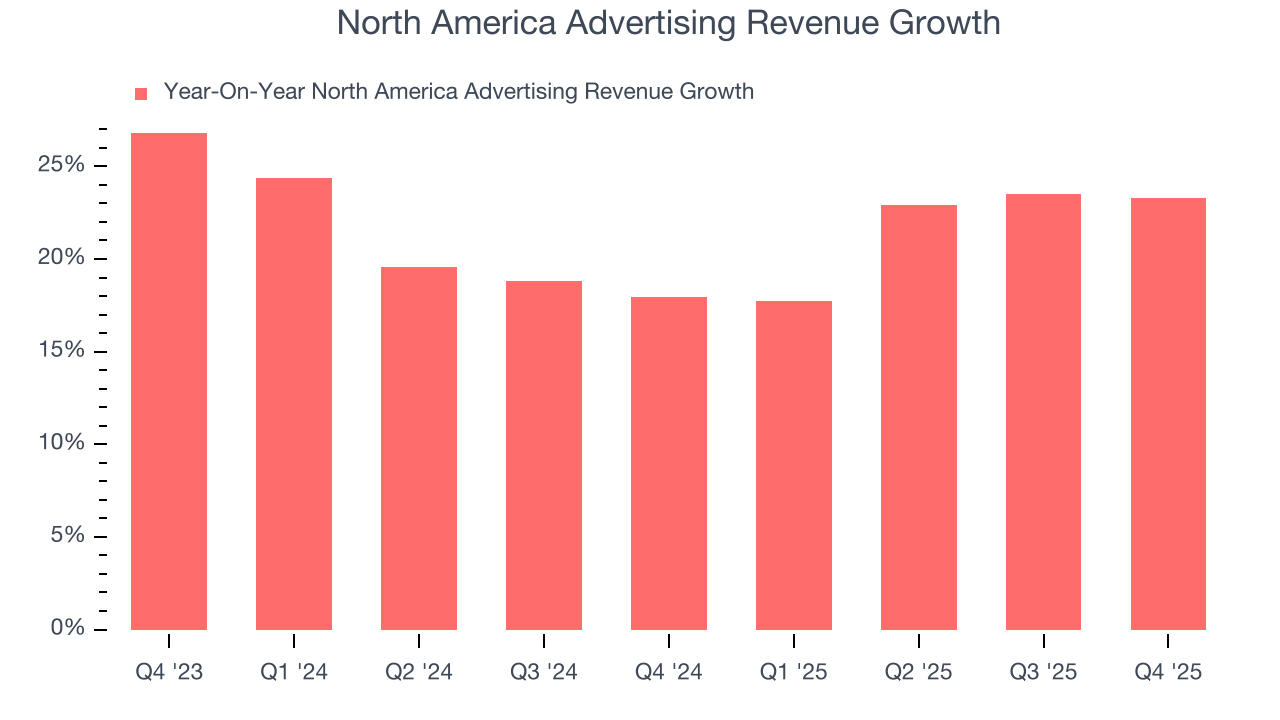
Since 2023, advertising revenue rose from 13.3% of North America’s sales to 16.1%. Its growth beat Google Search’s 13.3% annualized rate, showing it’s taking share from the incumbent. Bulls would argue Amazon is winning because purchasing intent is higher when searching for products on its website versus Google’s. Just mind that it’s harder for Google Search to grow quickly because it’s working off a much higher trailing 12-month revenue base of $224.5 billion (compared to $68.64 billion for Amazon’s advertising business).
Profitability: Optimizing For Efficiency?
The most structural factor limiting Amazon’s margins is its physical operations, a double-edged sword. On one hand, its e-commerce business is the bread-and-butter that paves the way for other revenue streams such as advertising, and its extensive logistics network is a durable advantage that is nearly impossible to replicate. On the other hand, it can never achieve margins like the asset-lite Google Search and Microsoft Office.
This dynamic catalyzes the most important debate for Amazon: will North America ever dial back its investments to improve its margin structure, or must it keep investing to meet ever-higher consumer expectations and hold the competition at bay?
Since 2023, the segment’s annual operating margin rose from 4.2% to 6.9%. Furthermore, its revenue growth shows the expansion was driven by increased utilization of its existing infrastructure. The cherry on top was its mix shift toward advertising. This provides some evidence that Amazon can achieve higher long-term margins.
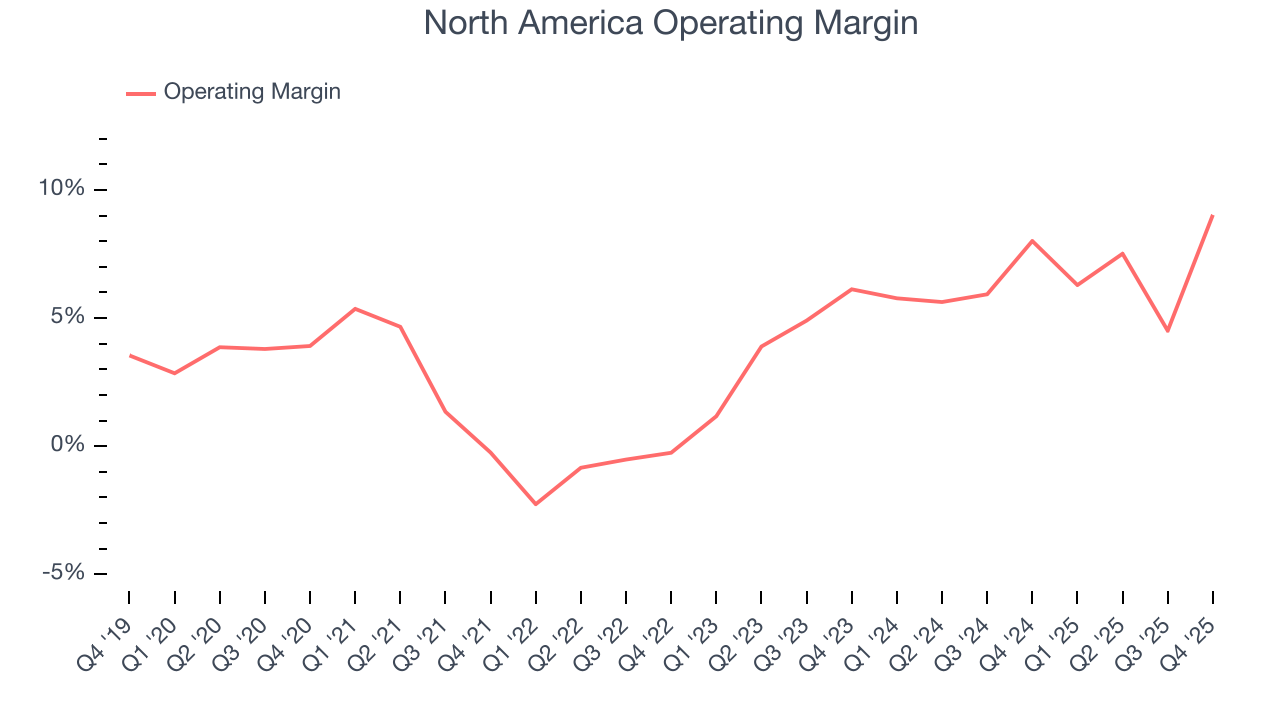
This quarter, North America boasted a 9% operating margin, up from 8% in the same quarter last year. The shorter-term data point along with its two-year trend are supportive of a more profitable Amazon. More quarters like this will make it harder to argue that the company is reinvesting most incremental profits into perpetuity.
8. Amazon Web Services: The Internet’s Infrastructure
Revenue: The First-Mover Advantage
Almost all modern internet applications are built on public cloud infrastructure, and Amazon Web Services (AWS) was the first mover. As a result, it has reaped the scale and vendor lock-in benefits that materialize into sky-high margins. Now, it carries Amazon’s profitability and is the war chest enabling its investments.
AWS is the leader in this market today with its run-rate revenue (current quarter’s sales times four) of around $150 billion. However, Azure (a subset of Microsoft’s Intelligent Cloud segment) is a fast-growing competitor on pace to generate roughly $150 billion while Google Cloud Platform is a distant third at $70 billion. Even though AWS's growth is the lowest of the three, as seen in the chart below, it's still solid given the magnitude of its scale.
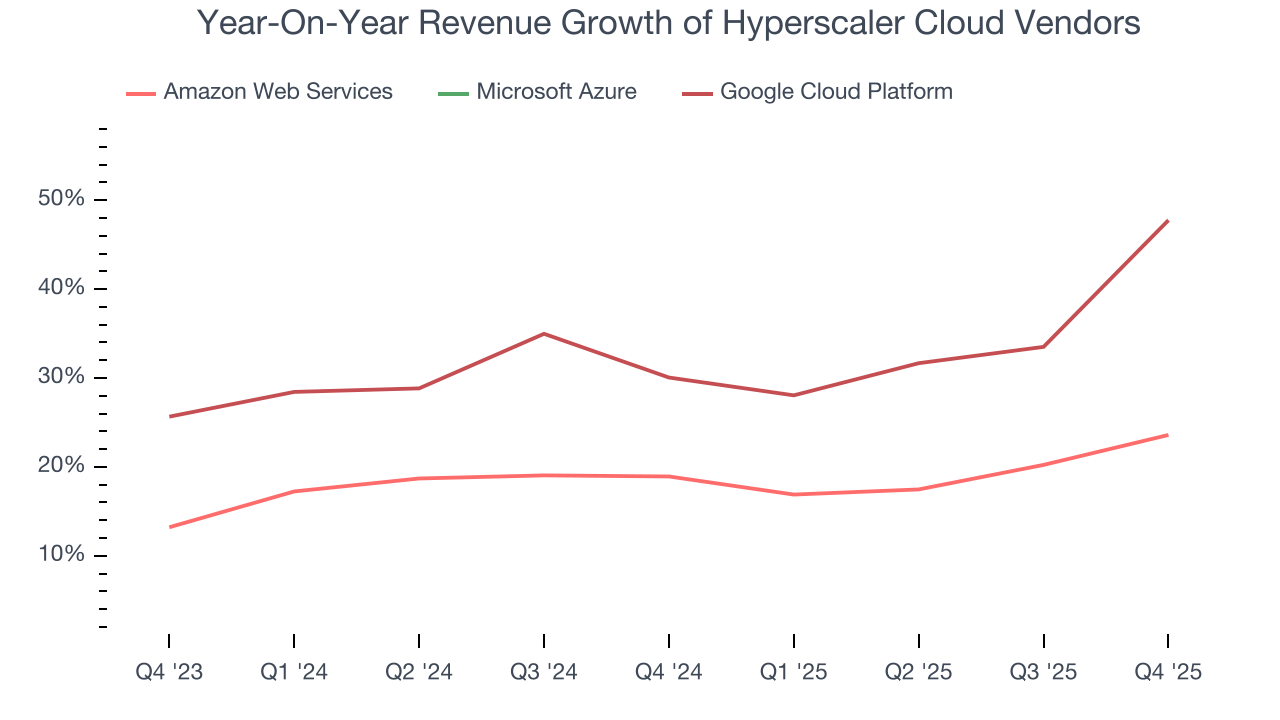
Over the last five years, the segment’s revenue grew at a robust clip, clocking in at 23.2% annualized. This performance was better than its consolidated revenue and boosted the company’s overall unit economics. Sales have recently decelerated to 19.1% annual growth over the last two years, though this isn’t concerning because demand is still high.
With its growth, AWS has increased from 11.8% of total revenue five years ago to 18% today. Its share should continue expanding as it’s forecasted to grow faster than the rest of the business from here on out.
Profitability: The Gold Mine
As AWS becomes a bigger part of Amazon, company-wide profitability should also rise thanks to its software-like margins. The segment is also one to monitor because its profits are a major determinant of future investment firepower.
AWS’s annual operating margin catapulted from 27.1% in 2023 to 35.4% in the last year. This performance along with the higher efficiency in North America contributed to Amazon’s recent margin increases.
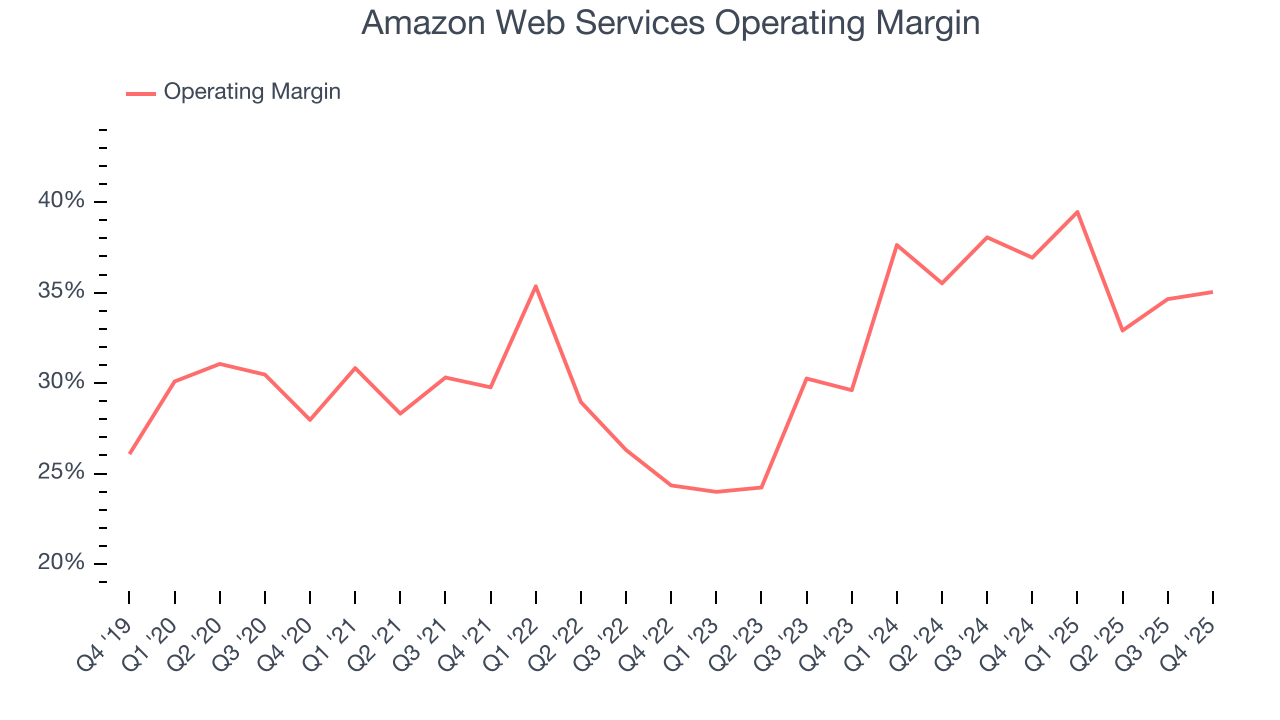
The latest quarter was encouraging as AWS’s 35% margin was around its trailing 12-month result, implying it can maintain high profitability. We wouldn’t jump to any conclusions based on one quarter, but AWS’s margin was lower than its trailing 12-month result. If its profitability maxes out, it will be up to the North America segment’s operating leverage to bail it out.
9. Earnings Per Share
We track the long-term change in earnings per share (EPS) alongside revenue and margins because it shows whether a company’s growth is profitable and what else affects shareholder returns.
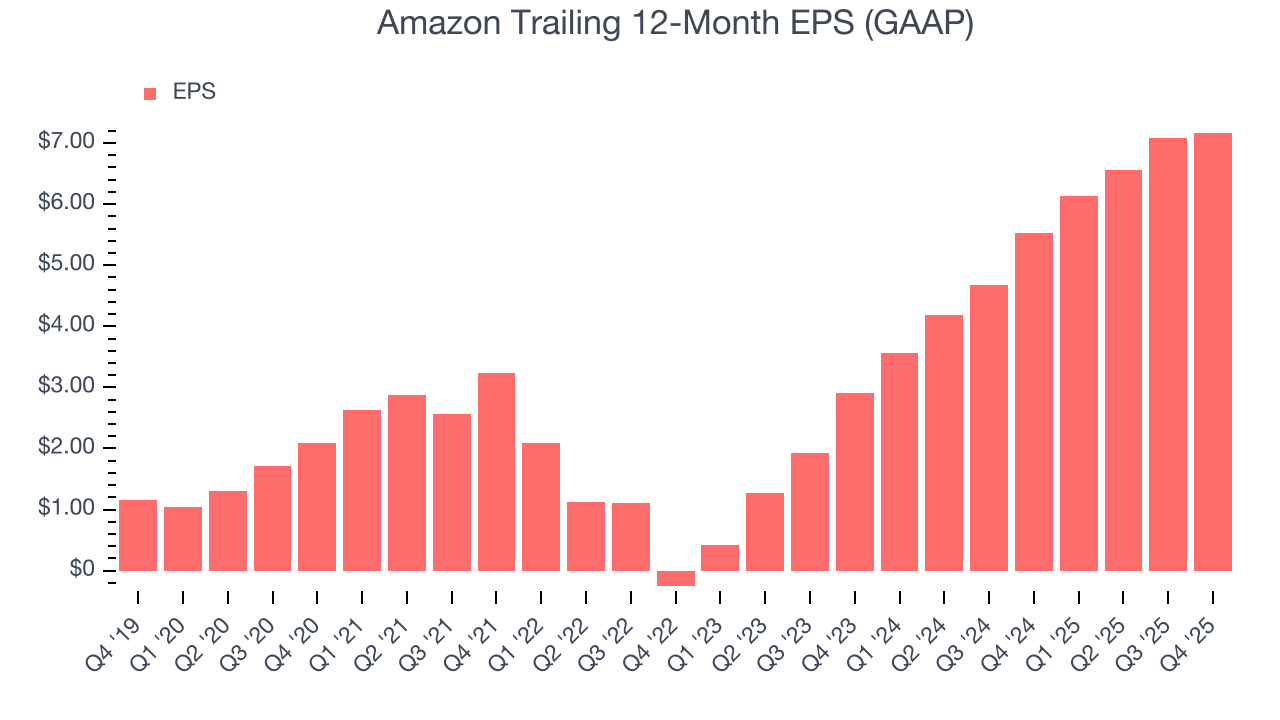
Amazon’s EPS grew at an astounding 28% compounded annual growth rate over the last five years, higher than its 13.2% annualized revenue growth. This tells us the company became more profitable on a per-share basis as it expanded.
We can take a deeper look into Amazon’s earnings to better understand the drivers of its performance. As we mentioned earlier, Amazon’s operating was flat this quarter but expanded by 5.9 percentage points over the last five years. This was the most relevant factor (aside from the revenue impact) behind its higher earnings; interest expenses and taxes can also affect EPS but don’t tell us as much about a company’s fundamentals.
Like with revenue, we analyze EPS over a shorter period to see if we are missing a change in the business.
For Amazon, its two-year annual EPS growth of 57.2% was higher than its five-year trend. We love it when earnings growth accelerates, but a caveat is that this particular figure was helped by a low EPS starting point as the world re-opened post-COVID and people spent less money on e-commerce purchases and more on travel and experiences.
In Q4, Amazon reported EPS of $1.95, up from $1.86 in the same quarter last year. This print was close to analysts’ estimates. Over the next 12 months, Wall Street expects Amazon’s full-year EPS of $7.17 to grow 10.3%.
10. Cash Is King
Although earnings are undoubtedly valuable for assessing company performance, we believe cash is king because you can’t use accounting profits to pay the bills or invest for the future.
Amazon has shown poor cash profitability over the last five years, giving the company limited opportunities to return capital to shareholders. Its free cash flow margin averaged 2.2%, lousy for a consumer internet business.
Taking a step back, an encouraging sign is that Amazon’s margin expanded by 3.3 percentage points over the last five years. We have no doubt shareholders would like to continue seeing its cash conversion rise as it gives the company more optionality.
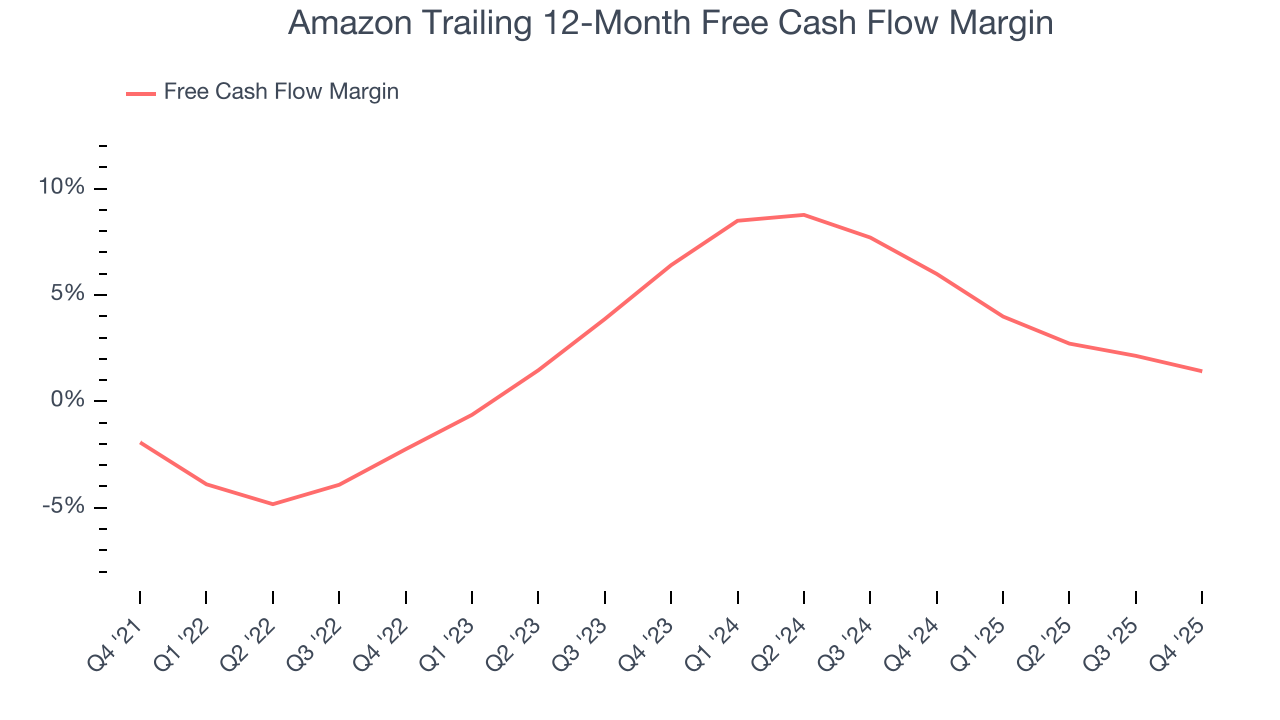
Amazon’s free cash flow clocked in at $14.94 billion in Q4, equivalent to a 7% margin. The company’s cash profitability regressed as it was 3.4 percentage points lower than in the same quarter last year, but it’s still above its five-year average. We wouldn’t read too much into this quarter’s decline because capital expenditures can be seasonal and companies often stockpile inventory in anticipation of higher demand, leading to short-term swings. Long-term trends are more important.
Over the next year, analysts predict Amazon’s cash conversion will improve. Their consensus estimates imply its free cash flow margin of 1.4% for the last 12 months will increase to 5.5%, giving it more flexibility for investments and share buybacks (Amazon has historically refrained from dividends).
11. Return on Invested Capital (ROIC)
EPS and free cash flow tell us whether a company was profitable while growing its revenue. But was it capital-efficient? Enter ROIC, a metric showing how much operating profit a company generates relative to the money it has raised (debt and equity).
Amazon’s management team makes decent investment decisions and generates value for shareholders. Its five-year average ROIC was 16.6%, slightly better than typical consumer internet business.
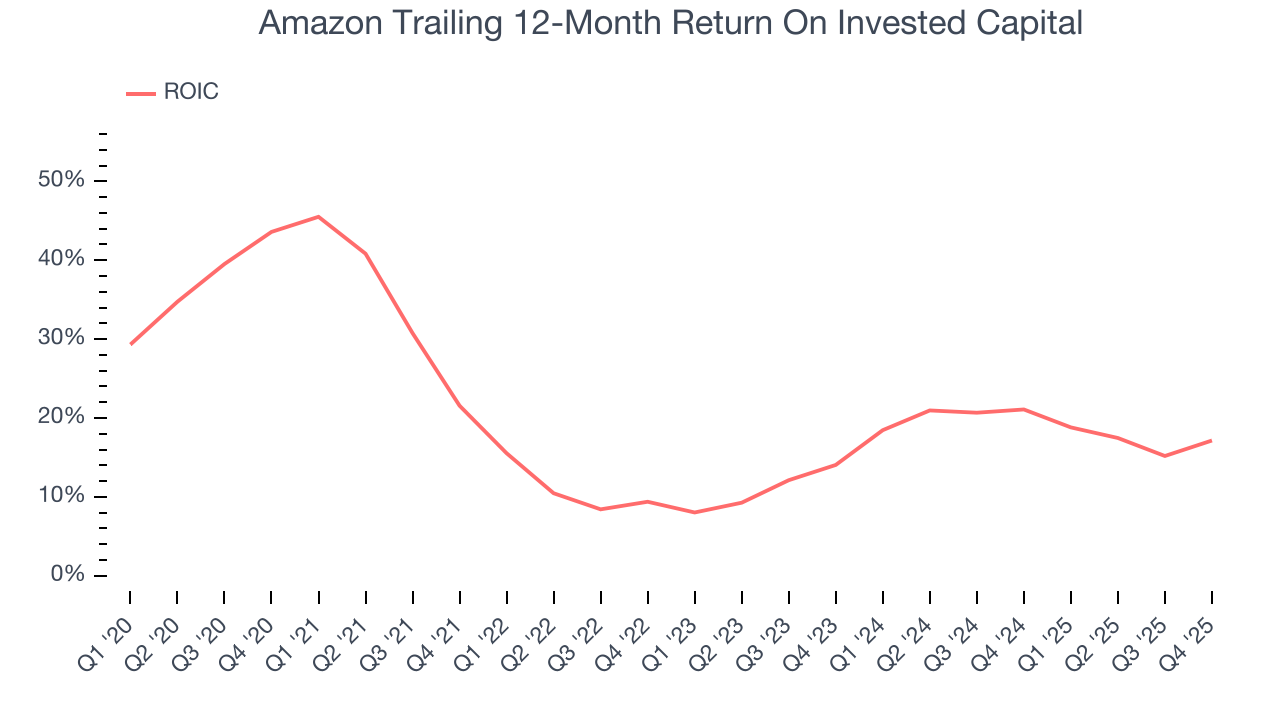
We like to invest in businesses with high returns, but the trend in a company’s ROIC is what often surprises the market and moves the stock price. Over the last few years, Amazon’s ROIC averaged 3.6 percentage point increases each year. This is a great sign when paired with its already strong returns. It could suggest its competitive advantage or profitable growth opportunities are expanding.
12. Balance Sheet Assessment
Amazon reported $123 billion of cash and $153 billion of debt on its balance sheet in the most recent quarter. As investors in high-quality companies, we primarily focus on two things: 1) that a company’s debt level isn’t too high and 2) that its interest payments are not excessively burdening the business.
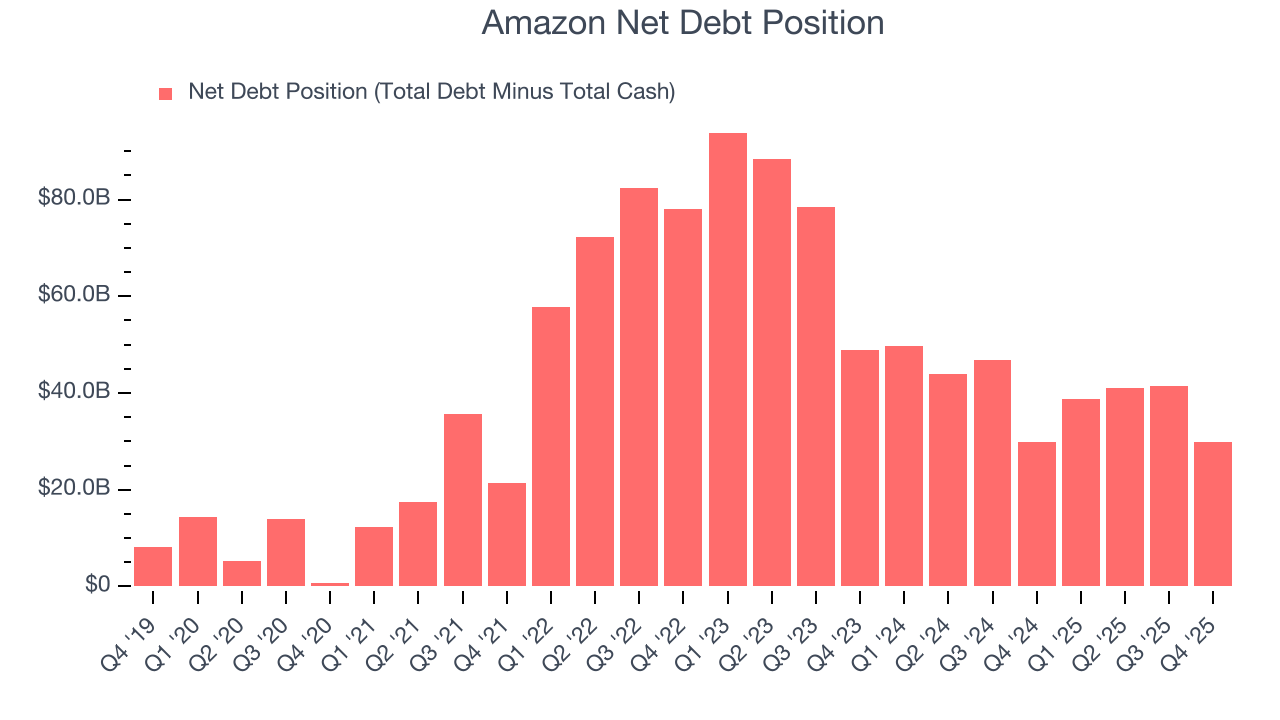
With $168.6 billion of EBITDA over the last 12 months, we view Amazon’s 0.2× net-debt-to-EBITDA ratio as safe. We also see its $1.21 billion of annual interest expenses as appropriate. The company’s profits give it plenty of breathing room, allowing it to continue investing in growth initiatives.
13. Key Takeaways from Amazon’s Q4 Results
It was encouraging to see Amazon narrowly top analysts’ revenue expectations this quarter, and the beat in Amazon Web Services was a bright spot. And while operating profit missed, all-important AWS segment operating profit beat. On the other hand, its operating income guidance for next quarter missed. Additionally, the company guided to $200 billion of capex in 2026, a more than 50% increase compared to 2025. Overall, this was a mixed quarter with the spending forecast spooking the markets. The stock traded down 5.5% to $210.70 immediately after reporting.
14. Is Now The Time To Buy Amazon?
Updated: February 11, 2026 at 9:01 PM EST
Before making an investment decision, investors should account for Amazon’s business fundamentals and valuation in addition to what happened in the latest quarter.
We think Amazon is a solid business. To kick things off, its superb long-term revenue growth driven by AWS has aided margins and indicates that even more companies are leveraging its cloud computing offerings. And while its low free cash flow margin makes investors question whether it will ever harvest profits or keep pushing them to the future, its projected revenue growth for the next year implies its recent momentum will continue. On top of that, its operating leverage and advertising success in the North America segment shows its margins can indeed tick higher.
Amazon’s price-to-earnings ratio based on the next 12 months is 27.2x. When scanning the consumer internet space, Amazon trades at a fair valuation. If you trust the business and its direction, this is an ideal time to buy.
Wall Street analysts have a consensus one-year price target of $283.17 on the company (compared to the current share price of $204.28), implying they see 38.6% upside in buying Amazon in the short term.