Costco (COST)
We see potential in Costco. Its demand is through the roof, as seen by its rapid growth in same-store sales and physical locations.― StockStory Analyst Team
1. News

2. Summary
Why Costco Is Interesting
Designed to be a one-stop shop for the suburban consumer, Costco (NASDAQ:COST) is a membership-only retail chain that sells groceries, apparel, toys, and household items, often in bulk quantities.
- Market-beating returns on capital illustrate that management has a knack for investing in profitable ventures, and its rising returns show it’s making even more lucrative bets
- Enormous revenue base of $286.3 billion compensates for its low gross margin and provides significant leverage in supplier negotiations
- On a dimmer note, its commoditized inventory, bad unit economics, and high competition are reflected in its low gross margin of 12.8%


Costco is close to becoming a high-quality business. This company has a place on your watchlist.
Why Should You Watch Costco


At $975.06 per share, Costco trades at 45.8x forward P/E. The market has high expectations, which are reflected in the premium multiple. This can result in short-term volatility if anything (e.g. a quarterly earnings miss) remotely dampens those hopes.
Costco can improve its fundamentals over time by putting up good numbers quarter after quarter, year after year. Once that happens, we’ll be happy to recommend the stock.
3. Costco (COST) Research Report: Q1 CY2026 Update
Membership-only discount retailer Costco (NASDAQ:COST) reported Q1 CY2026 results beating Wall Street’s revenue expectations, with sales up 9.2% year on year to $69.6 billion. Its GAAP profit of $4.58 per share was 0.8% above analysts’ consensus estimates.
Costco (COST) Q1 CY2026 Highlights:
- Revenue: $69.6 billion vs analyst estimates of $69.06 billion (9.2% year-on-year growth, 0.8% beat)
- EPS (GAAP): $4.58 vs analyst estimates of $4.54 (0.8% beat)
- Adjusted EBITDA: $2.72 billion vs analyst estimates of $3.23 billion (3.9% margin, 15.9% miss)
- Operating Margin: 3.7%, in line with the same quarter last year
- Free Cash Flow Margin: 2.5%, similar to the same quarter last year
- Locations: 924 at quarter end, up from 897 in the same quarter last year
- Same-Store Sales rose 7.4% year on year, in line with the same quarter last year
- Market Capitalization: $446.9 billion
Company Overview
Designed to be a one-stop shop for the suburban consumer, Costco (NASDAQ:COST) is a membership-only retail chain that sells groceries, apparel, toys, and household items, often in bulk quantities.
The company is well known for offering these products at lower prices than most of its competitors. Costco is able to offer low prices due to its lean operating model that prioritizes low overhead costs and high inventory turnover. If you walk into a Costco store, the products are presented in a warehouse format, stacked high and with many products still sitting in their original boxes and palettes, rather than neatly presented as individual packages on shelves. This reduces store labor costs.
Costco's core customer is the value-conscious suburban shopper who is willing to buy in bulk to save money. These customers must pay for an annual membership, as non-members are not allowed to enter Costco locations. On the other hand, consumers living in cities often do not frequent Costco because their smaller homes or apartments cannot accommodate that 64-roll package of toilet paper.
In addition to groceries, electronics, and apparel, Costco also offers other consumer services so their customers don’t have to go elsewhere. Pharmacies, photo centers, and vision services/eyeglass retailers are common in their roughly 150,000 square foot stores. Outside the majority of Costco stores, there is also a gas station for quick and convenient fill ups.
4. Large-format Grocery & General Merchandise Retailer
Big-box retailers operate large stores that sell groceries and general merchandise at highly competitive prices. Because of their scale and resulting purchasing power, these big-box retailers–with annual sales in the tens to hundreds of billions of dollars–are able to get attractive volume discounts and sell at often the lowest prices. While e-commerce is a threat, these retailers have been able to weather the storm by either providing a unique in-store shopping experience or by reinvesting their hefty profits into omnichannel investments.
Competitors that offer groceries and/or other general merchandise in large-format stores include BJ’s Wholesale Club, Walmart (NYSE:WMT), and Kroger (NYSE:KR).
5. Revenue Growth
A company’s long-term sales performance can indicate its overall quality. Even a bad business can shine for one or two quarters, but a top-tier one grows for years.
With $286.3 billion in revenue over the past 12 months, Costco is a behemoth in the consumer retail sector and benefits from economies of scale, giving it an edge in distribution. This also enables it to gain more leverage on its fixed costs than smaller competitors and the flexibility to offer lower prices. However, its scale is a double-edged sword because there are only a finite number of places to build new stores, making it harder to find incremental growth. To expand meaningfully, Costco likely needs to tweak its prices or enter new markets.
As you can see below, Costco’s sales grew at a tepid 6.9% compounded annual growth rate over the last three years, but to its credit, it opened new stores and increased sales at existing, established locations.
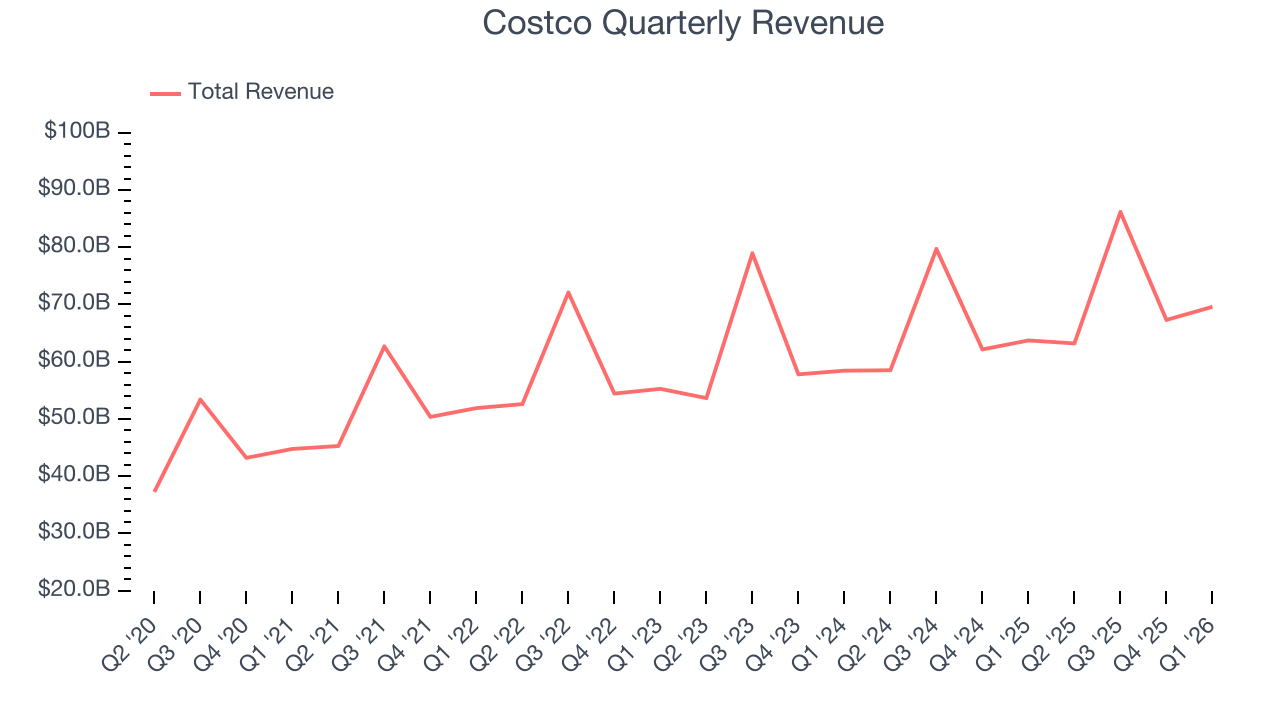
This quarter, Costco reported year-on-year revenue growth of 9.2%, and its $69.6 billion of revenue exceeded Wall Street’s estimates by 0.8%.
Looking ahead, sell-side analysts expect revenue to grow 7.1% over the next 12 months, similar to its three-year rate. This projection is particularly noteworthy for a company of its scale and suggests the market sees success for its products.
6. Store Performance
Number of Stores
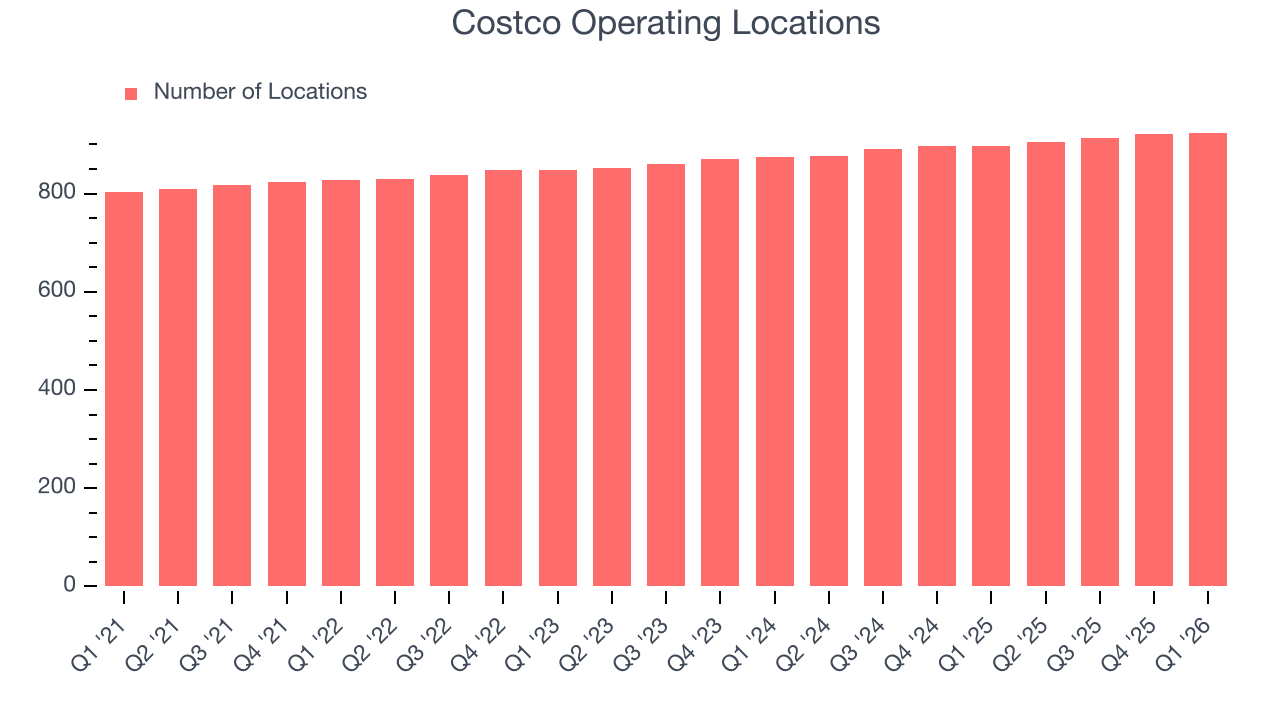
A retailer’s store count influences how much it can sell and how quickly revenue can grow.
Costco operated 924 locations in the latest quarter. It has opened new stores quickly over the last two years, averaging 2.9% annual growth, faster than the broader consumer retail sector.
When a retailer opens new stores, it usually means it’s investing for growth because demand is greater than supply, especially in areas where consumers may not have a store within reasonable driving distance.
Same-Store Sales
A company's store base only paints one part of the picture. When demand is high, it makes sense to open more. But when demand is low, it’s prudent to close some locations and use the money in other ways. Same-store sales is an industry measure of whether revenue is growing at those existing stores and is driven by customer visits (often called traffic) and the average spending per customer (ticket).
Costco has been one of the most successful retailers over the last two years thanks to skyrocketing demand within its existing locations. On average, the company has posted exceptional year-on-year same-store sales growth of 6.2%. This performance suggests its rollout of new stores is beneficial for shareholders. We like this backdrop because it gives Costco multiple ways to win: revenue growth can come from new stores, e-commerce, or increased foot traffic and higher sales per customer at existing locations.
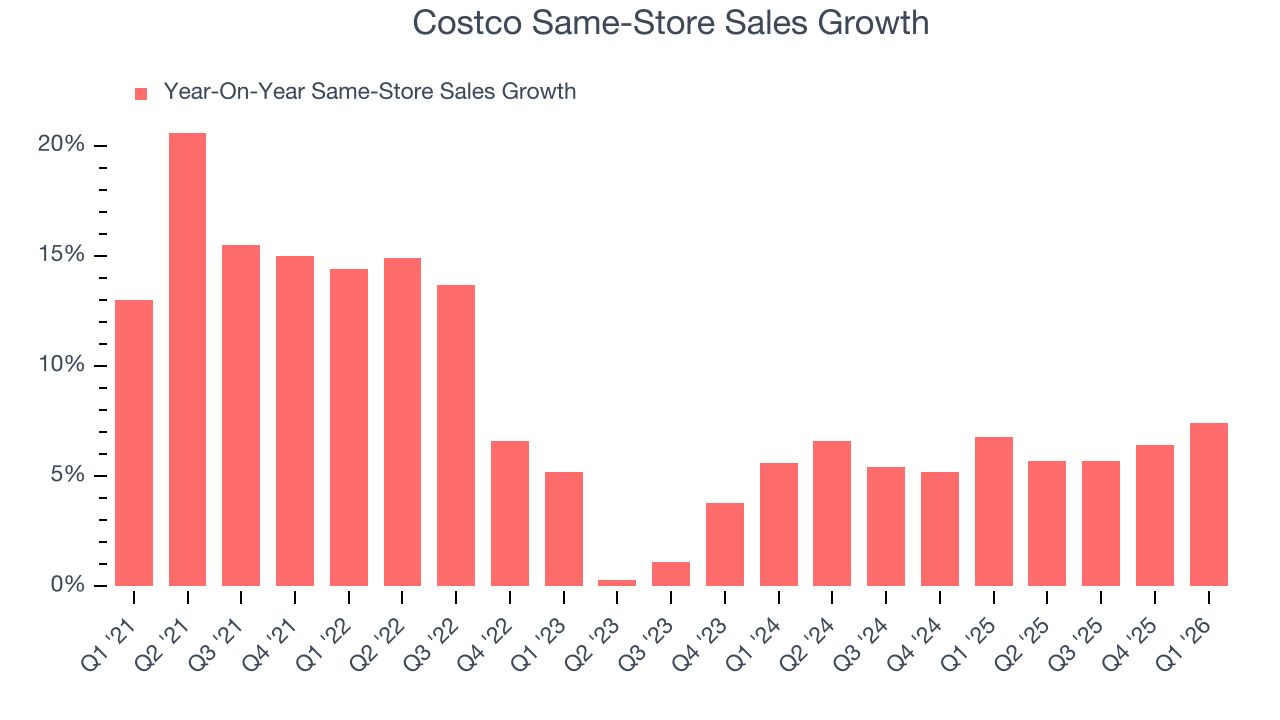
In the latest quarter, Costco’s same-store sales rose 7.4% year on year. This growth was an acceleration from its historical levels, which is always an encouraging sign.
7. Gross Margin & Pricing Power
Gross profit margins are an important measure of a retailer’s pricing power, product differentiation, and negotiating leverage.
Costco has bad unit economics for a retailer, signaling it operates in a competitive market and lacks pricing power because its inventory is sold in many places. As you can see below, it averaged a 12.8% gross margin over the last two years.
Non-discretionary retailers, however, must be viewed through a different lens because they compete on the lowest price, sell products easily found elsewhere, and have high transportation costs to move goods. These dynamics lead to structurally lower gross margins, so the best metrics to assess them are free cash flow margin, operating leverage, and profit volatility, which account for their scale advantages and non-cyclical demand.
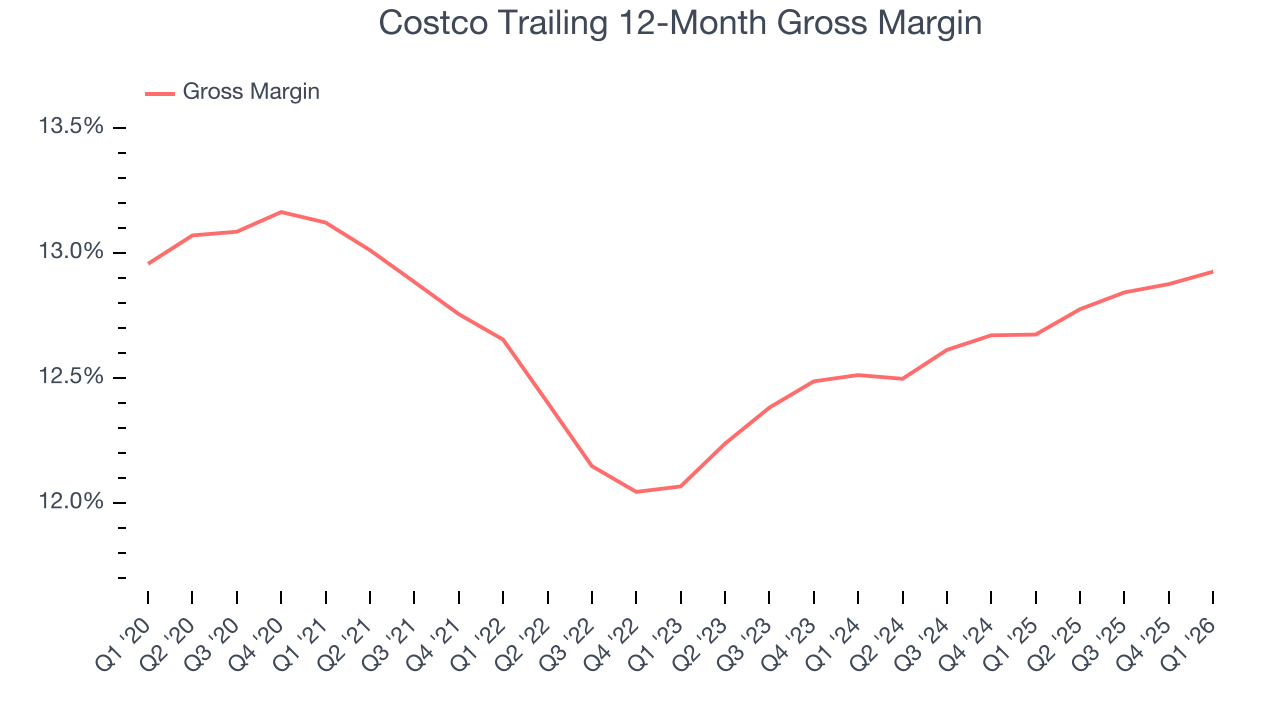
Costco produced a 12.8% gross profit margin in Q1, in line with the same quarter last year. On a wider time horizon, the company’s full-year margin has remained steady over the past four quarters, suggesting it strives to keep prices low for customers and has stable input costs (such as labor and freight expenses to transport goods).
8. Operating Margin
Operating margin is an important measure of profitability for retailers as it accounts for all expenses necessary to run a store, including wages, inventory, rent, advertising, and other administrative costs.
Costco’s operating margin has generally stayed the same over the last 12 months, averaging 3.8% over the last two years. This profitability was lousy for a consumer retail business and caused by its suboptimal cost structureand low gross margin.
Analyzing the trend in its profitability, Costco’s operating margin might fluctuated slightly but has generally stayed the same over the last year. This raises questions about the company’s expense base because its revenue growth should have given it leverage on its fixed costs, resulting in better economies of scale and profitability.
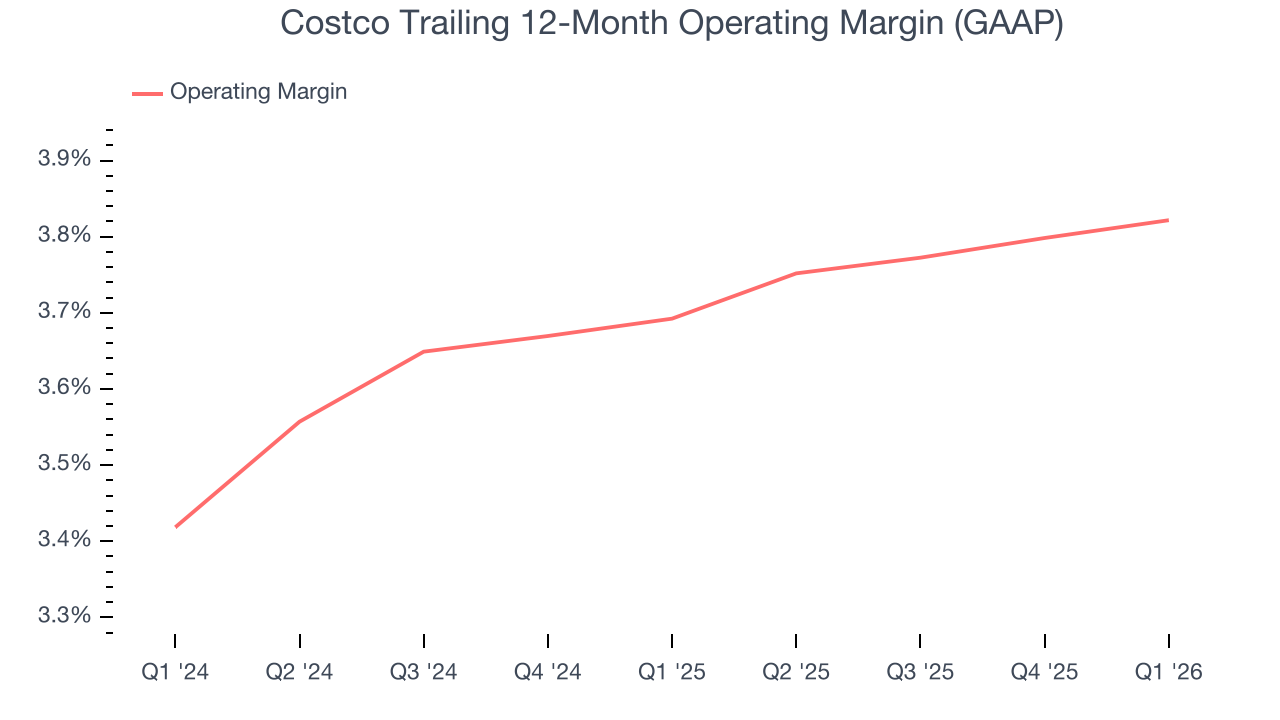
In Q1, Costco generated an operating margin profit margin of 3.7%, in line with the same quarter last year. This indicates the company’s cost structure has recently been stable.
9. Earnings Per Share
Revenue trends explain a company’s historical growth, but the long-term change in earnings per share (EPS) points to the profitability of that growth – for example, a company could inflate its sales through excessive spending on advertising and promotions.
Costco’s EPS grew at 12.2% compounded annual growth rate over the last three years, higher than its 6.9% annualized revenue growth. However, we take this with a grain of salt because its operating margin didn’t improve and it didn’t repurchase its shares, meaning the delta came from reduced interest expenses or taxes.

In Q1, Costco reported EPS of $4.58, up from $4.02 in the same quarter last year. This print was close to analysts’ estimates. Over the next 12 months, Wall Street expects Costco’s full-year EPS of $19.23 to grow 9.9%.
10. Cash Is King
Free cash flow isn't a prominently featured metric in company financials and earnings releases, but we think it's telling because it accounts for all operating and capital expenses, making it tough to manipulate. Cash is king.
Costco has shown decent cash profitability, giving it some flexibility to reinvest or return capital to investors. The company’s free cash flow margin averaged 2.9% over the last two years, slightly better than the broader consumer retail sector. Costco has shown decent cash profitability relative to peers over the last two years, giving the company fewer opportunities to return capital to shareholders.
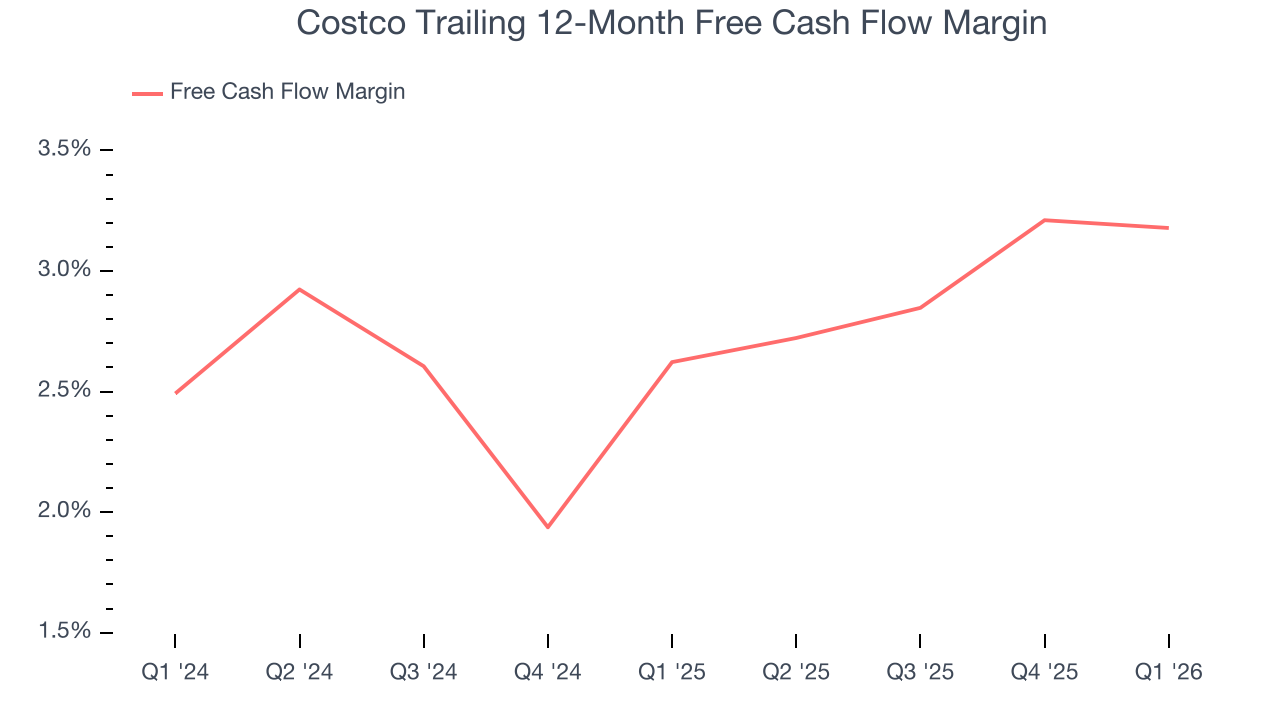
Costco’s free cash flow clocked in at $1.71 billion in Q1, equivalent to a 2.5% margin. This cash profitability was in line with the comparable period last year and its two-year average.
11. Return on Invested Capital (ROIC)
EPS and free cash flow tell us whether a company was profitable while growing its revenue. But was it capital-efficient? A company’s ROIC explains this by showing how much operating profit it makes compared to the money it has raised (debt and equity).
Costco’s five-year average ROIC was 34.8%, placing it among the best consumer retail companies. This illustrates its management team’s ability to invest in highly profitable ventures and produce tangible results for shareholders.
12. Balance Sheet Assessment
Big corporations like Costco are attractive to many investors in times of instability thanks to their fortress balance sheets that buffer pockets of soft demand.
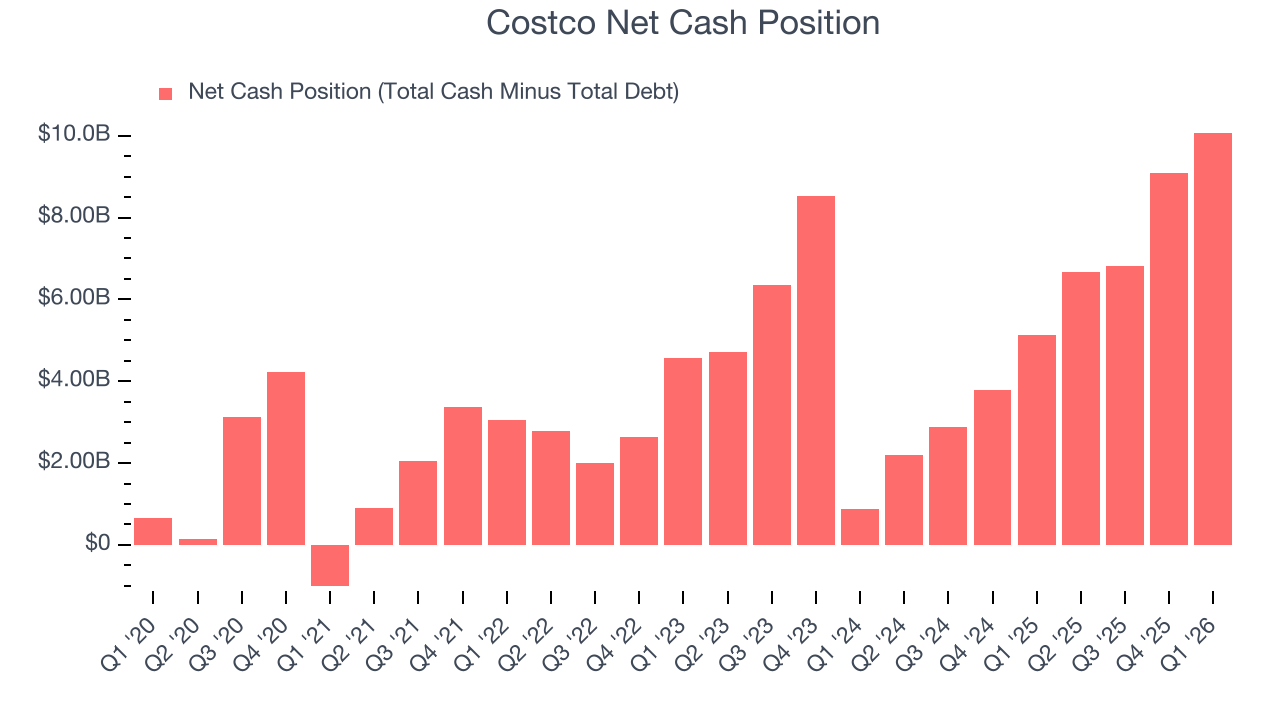
Costco is a profitable, well-capitalized company with $18.24 billion of cash and $8.17 billion of debt on its balance sheet. This $10.08 billion net cash position is 2.3% of its market cap and gives it the freedom to borrow money, return capital to shareholders, or invest in growth initiatives. Leverage is not an issue here.
13. Key Takeaways from Costco’s Q1 Results
We were impressed by how significantly Costco blew past analysts’ gross margin expectations this quarter. We were also happy its revenue narrowly outperformed Wall Street’s estimates. On the other hand, its EBITDA missed. Overall, this was a weaker quarter. The stock remained flat at $982.52 immediately following the results.
14. Is Now The Time To Buy Costco?
Updated: March 20, 2026 at 10:41 PM EDT
When considering an investment in Costco, investors should account for its valuation and business qualities as well as what’s happened in the latest quarter.
There are definitely a lot of things to like about Costco. Although its revenue growth was a little slower over the last three years, its growth over the next 12 months is expected to be higher. And while Costco’s gross margins make it more challenging to reach positive operating profits compared to other consumer retail businesses, its marvelous same-store sales growth is on another level. On top of that, its stellar ROIC suggests it has been a well-run company historically.
Costco’s P/E ratio based on the next 12 months is 45.8x. At this valuation, there’s a lot of good news priced in. Costco is a good one to add to your watchlist - there are companies featuring superior fundamentals at the moment.
Wall Street analysts have a consensus one-year price target of $1,067 on the company (compared to the current share price of $975.06).