
Inspired (INSE)
Inspired is in for a bumpy ride. Its sales have underperformed and its low returns on capital show it has few growth opportunities.― StockStory Analyst Team
1. News


2. Summary
Why We Think Inspired Will Underperform
Specializing in digital casino gaming, Inspired (NASDAQ:INSE) is a provider of gaming hardware, virtual sports platforms, and server-based gaming systems.
- Lackluster 8.8% annual revenue growth over the last five years indicates the company is losing ground to competitors
- Sales are projected to tank by 12% over the next 12 months as its demand continues evaporating
- Subpar operating margin constrains its ability to invest in process improvements or effectively respond to new competitive threats


Inspired lacks the business quality we seek. We believe there are better businesses elsewhere.
Why There Are Better Opportunities Than Inspired


At $6.38 per share, Inspired trades at 22x forward P/E. Not only is Inspired’s multiple richer than most consumer discretionary peers, but it’s also expensive for its revenue characteristics.
There are stocks out there featuring similar valuation multiples with better fundamentals. We prefer to invest in those.
3. Inspired (INSE) Research Report: Q4 CY2025 Update
Gaming company Inspired (NASDAQ:INSE) missed Wall Street’s revenue expectations in Q4 CY2025, with sales falling 4.9% year on year to $77.2 million. Its non-GAAP loss of $0.18 per share was significantly below analysts’ consensus estimates.
Inspired (INSE) Q4 CY2025 Highlights:
- Revenue: $77.2 million vs analyst estimates of $78.1 million (4.9% year-on-year decline, 1.1% miss)
- Adjusted EPS: -$0.18 vs analyst estimates of $0.21 (significant miss)
- Adjusted EBITDA: $32.3 million vs analyst estimates of $31.36 million (41.8% margin, 3% beat)
- Operating Margin: 14.5%, down from 17.2% in the same quarter last year
- Free Cash Flow was -$12.2 million compared to -$1 million in the same quarter last year
- Market Capitalization: $224.6 million
Company Overview
Specializing in digital casino gaming, Inspired (NASDAQ:INSE) is a provider of gaming hardware, virtual sports platforms, and server-based gaming systems.
The company was founded to create advanced digital games with engaging user experiences and realistic graphics. Its products include physical machines like interactive gaming terminals that are placed on casino floors as well as online games.
Inspired generates revenue through the sale and leasing of gaming systems to operators along with service fees. Its customers include casino operators and online casinos.
4. Consumer Discretionary - Gaming Solutions
The Consumer Discretionary sector, by definition, is made up of companies selling non-essential goods and services. When economic conditions deteriorate or tastes shift, consumers can easily cut back or eliminate these purchases. For long-term investors with five-year holding periods, this creates a structural challenge: the sector is inherently hit-driven, with low switching costs and fickle customers. As a result, only a handful of companies can reliably grow demand and compound earnings over long periods, which is why our bar is high and High Quality ratings are rare.
Gaming solutions companies provide the technology infrastructure behind gambling—slot machines, table game systems, lottery terminals, sports-betting platforms, and back-end software for casinos and online operators. Tailwinds include the ongoing legalization of sports betting across U.S. states and international markets, growing adoption of digital and mobile wagering, and casino operators' demand for data-driven player engagement tools. However, headwinds include stringent and evolving regulatory requirements across jurisdictions, high upfront R&D costs to develop next-generation platforms, and customer concentration risk given the limited number of large casino operators. Increasing competition from in-house technology development by major operators also pressures demand.
Competitors in the gaming technology and entertainment sector include Everi (NYSE:EVRI), PlayAGS (NYSE:AGS), and Light & Wonder (NASDAQ:LNW).
5. Revenue Growth
Examining a company’s long-term performance can provide clues about its quality. Even a bad business can shine for one or two quarters, but a top-tier one grows for years. Over the last five years, Inspired grew its sales at a weak 8.8% compounded annual growth rate. This fell short of our benchmark for the consumer discretionary sector and is a rough starting point for our analysis.
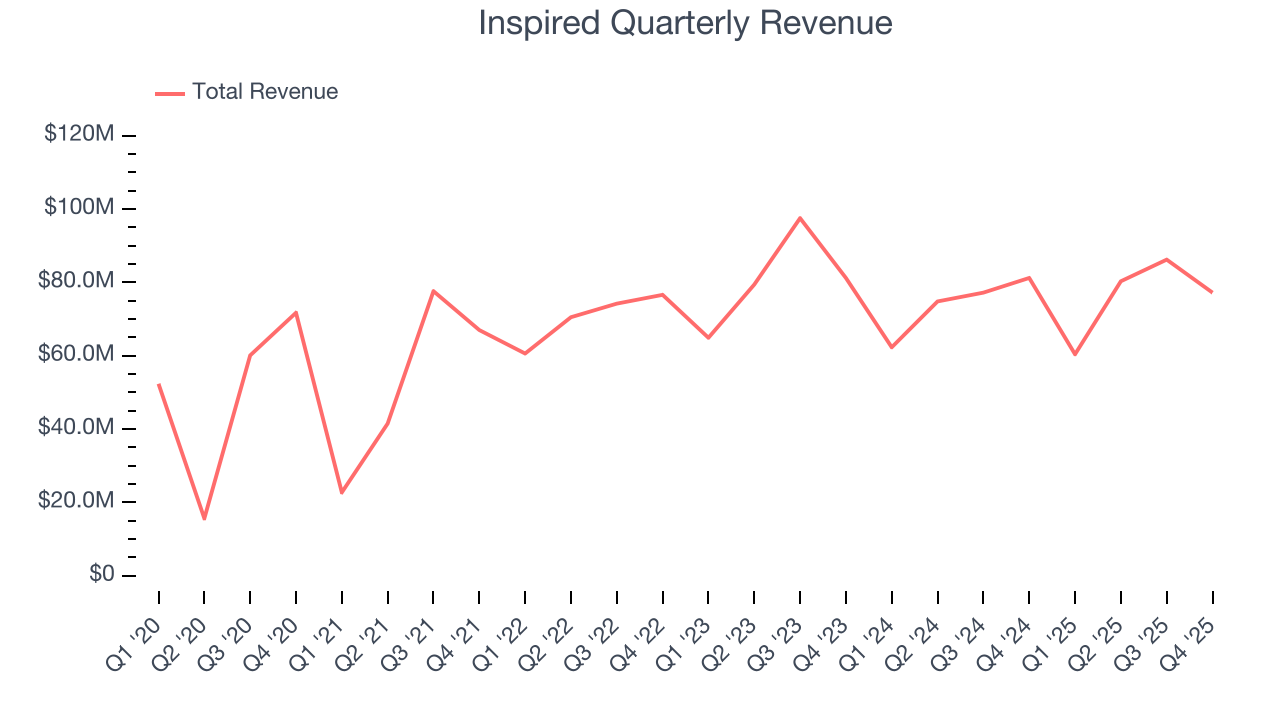
Long-term growth is the most important, but within consumer discretionary, product cycles are short and revenue can be hit-driven due to rapidly changing trends and consumer preferences. Inspired’s performance shows it grew in the past but relinquished its gains over the last two years, as its revenue fell by 3% annually. 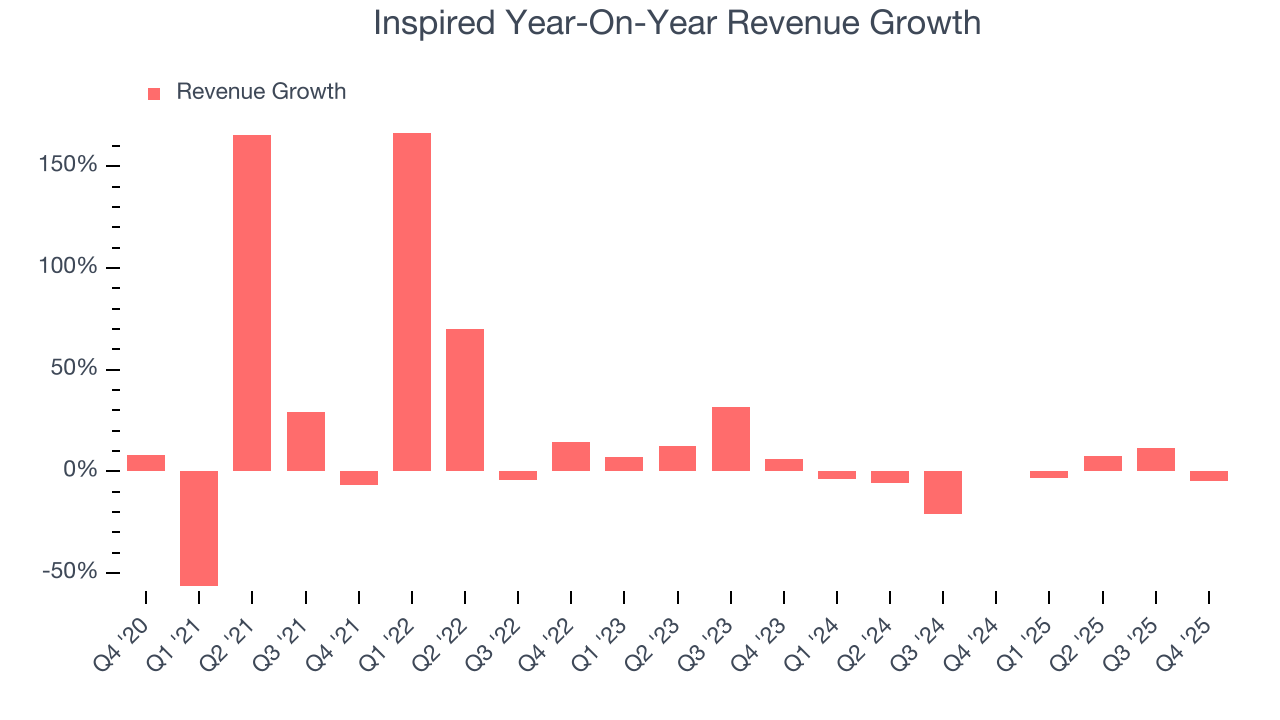
We can dig further into the company’s revenue dynamics by analyzing its three most important segments: Gaming, Leisure, and Virtual Sports, which are 47%, 12.2%, and 17.7% of revenue. Over the last two years, Inspired’s Gaming (land-based casino games) and Virtual Sports (digital gaming and sports betting) revenues averaged year-on-year growth of 2.2% and 112%. On the other hand, its Leisure revenue (gaming terminals and amusement machines) averaged 62.5% declines. 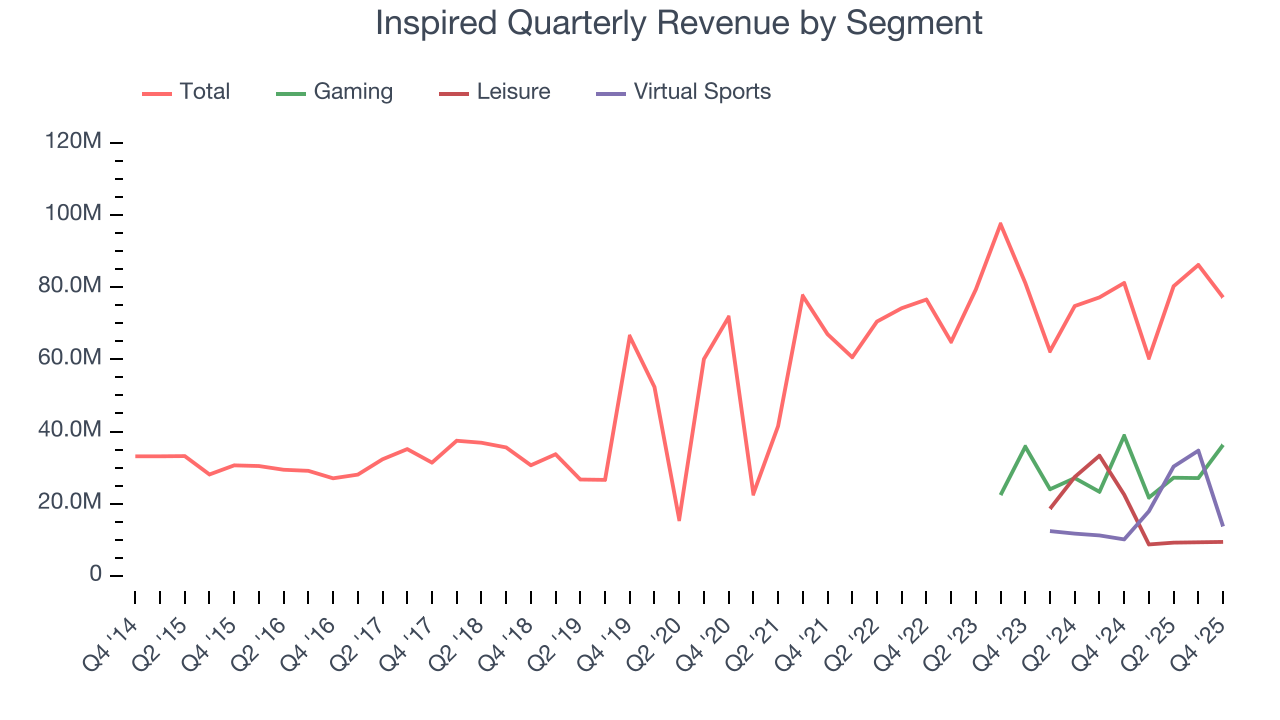
This quarter, Inspired missed Wall Street’s estimates and reported a rather uninspiring 4.9% year-on-year revenue decline, generating $77.2 million of revenue.
Looking ahead, sell-side analysts expect revenue to decline by 11.4% over the next 12 months, a deceleration versus the last two years. This projection doesn't excite us and suggests its products and services will face some demand challenges.
6. Operating Margin
Operating margin is an important measure of profitability as it shows the portion of revenue left after accounting for all core expenses – everything from the cost of goods sold to advertising and wages. It’s also useful for comparing profitability across companies with different levels of debt and tax rates because it excludes interest and taxes.
Inspired’s operating margin has more or less stayed the same over the last 12 months , and we generally like to see margin increases due to economies of scale and cost efficiency over time.
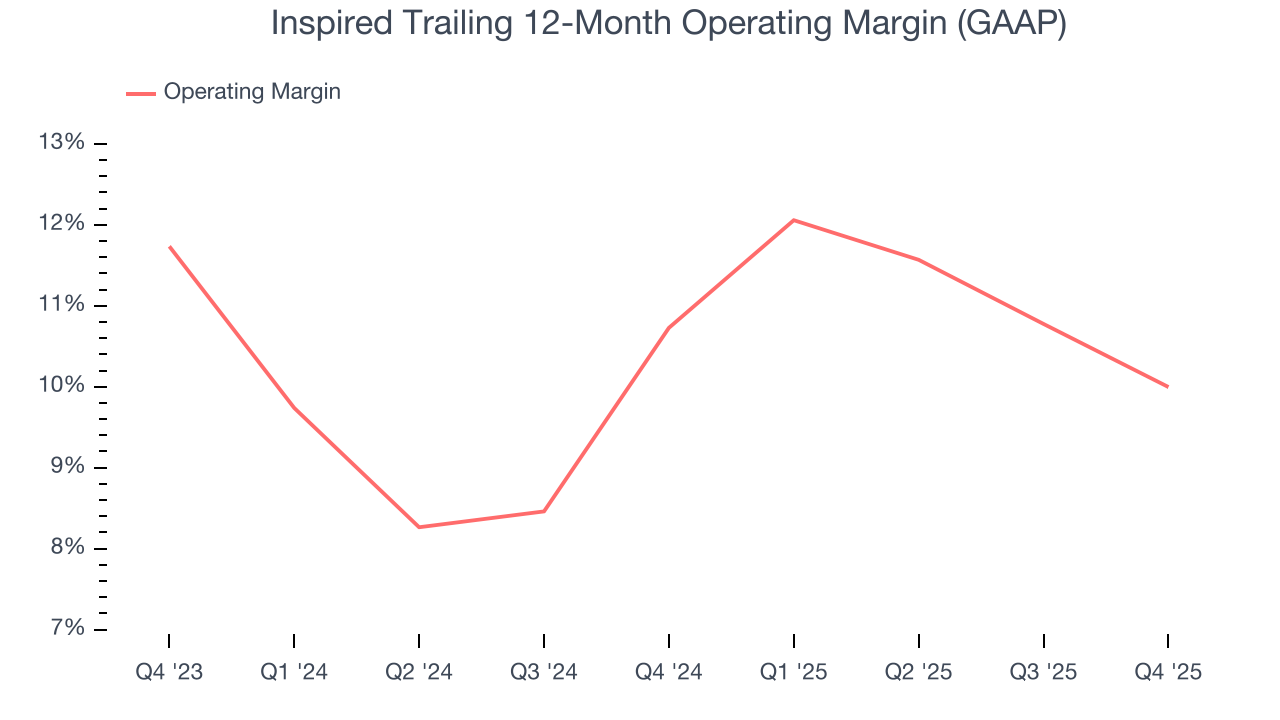
In Q4, Inspired generated an operating margin profit margin of 14.5%, down 2.7 percentage points year on year. This contraction shows it was less efficient because its expenses increased relative to its revenue.
7. Earnings Per Share
We track the long-term change in earnings per share (EPS) for the same reason as long-term revenue growth. Compared to revenue, however, EPS highlights whether a company’s growth is profitable.
Inspired’s full-year EPS flipped from negative to positive over the last five years. This is encouraging and shows it’s at a critical moment in its life.
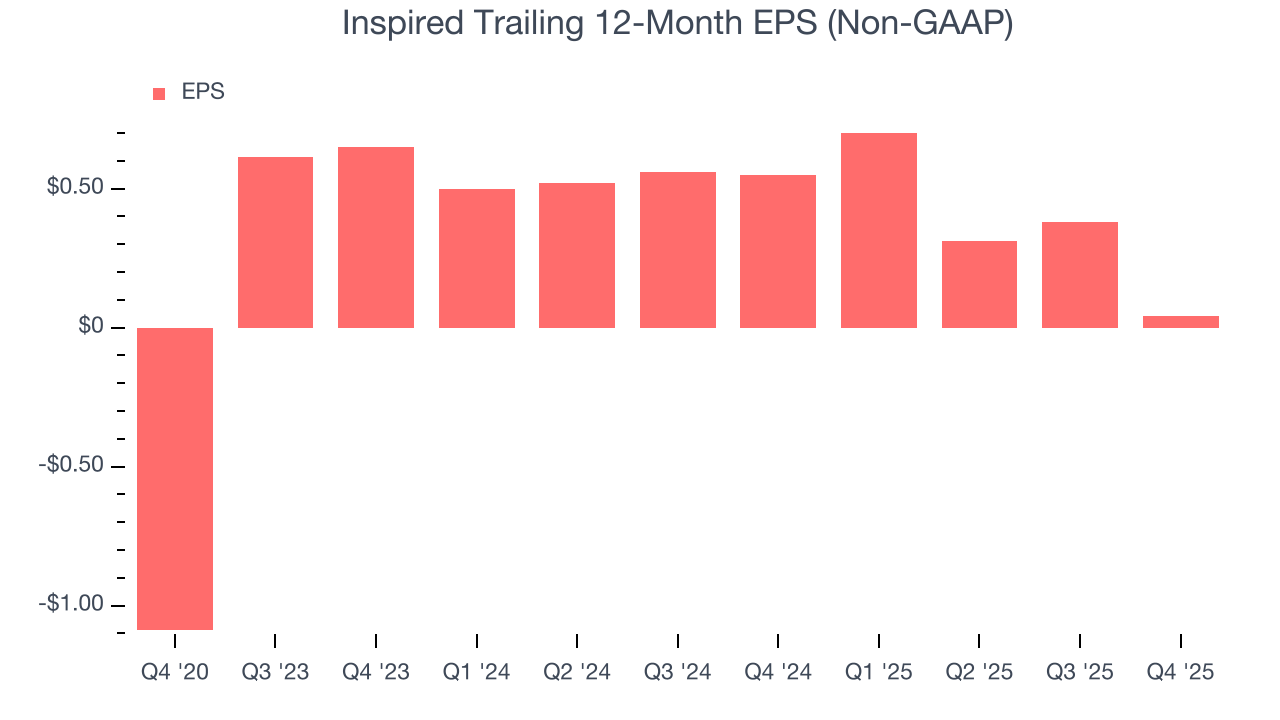
In Q4, Inspired reported adjusted EPS of negative $0.18, down from $0.16 in the same quarter last year. This print missed analysts’ estimates. Over the next 12 months, Wall Street expects Inspired’s full-year EPS of $0.04 to grow 1,398%.
8. Cash Is King
If you’ve followed StockStory for a while, you know we emphasize free cash flow. Why, you ask? We believe that in the end, cash is king, and you can’t use accounting profits to pay the bills.
Inspired has shown poor cash profitability relative to peers over the last two years, giving the company fewer opportunities to return capital to shareholders. Its free cash flow margin averaged 1.6%, below what we’d expect for a consumer discretionary business.
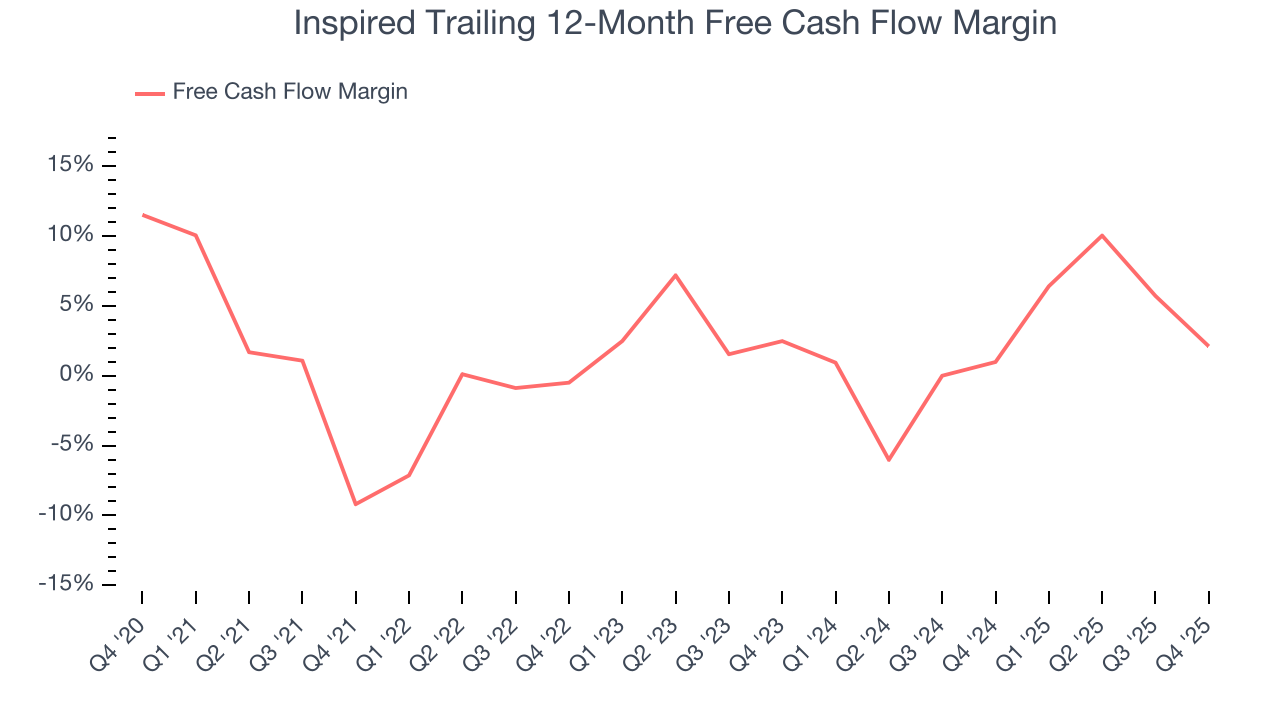
Inspired burned through $12.2 million of cash in Q4, equivalent to a negative 15.8% margin. The company’s cash burn was similar to its $1 million of lost cash in the same quarter last year. These numbers deviate from its longer-term margin, indicating it is a seasonal business that must build up inventory during certain quarters.
Over the next year, analysts predict Inspired’s cash conversion will improve. Their consensus estimates imply its free cash flow margin of 2.1% for the last 12 months will increase to 11%, giving it more flexibility for investments, share buybacks, and dividends.
9. Return on Invested Capital (ROIC)
EPS and free cash flow tell us whether a company was profitable while growing its revenue. But was it capital-efficient? A company’s ROIC explains this by showing how much operating profit it makes compared to the money it has raised (debt and equity).
Inspired historically did a mediocre job investing in profitable growth initiatives. Its five-year average ROIC was 19.1%, somewhat low compared to the best consumer discretionary companies that consistently pump out 25%+.
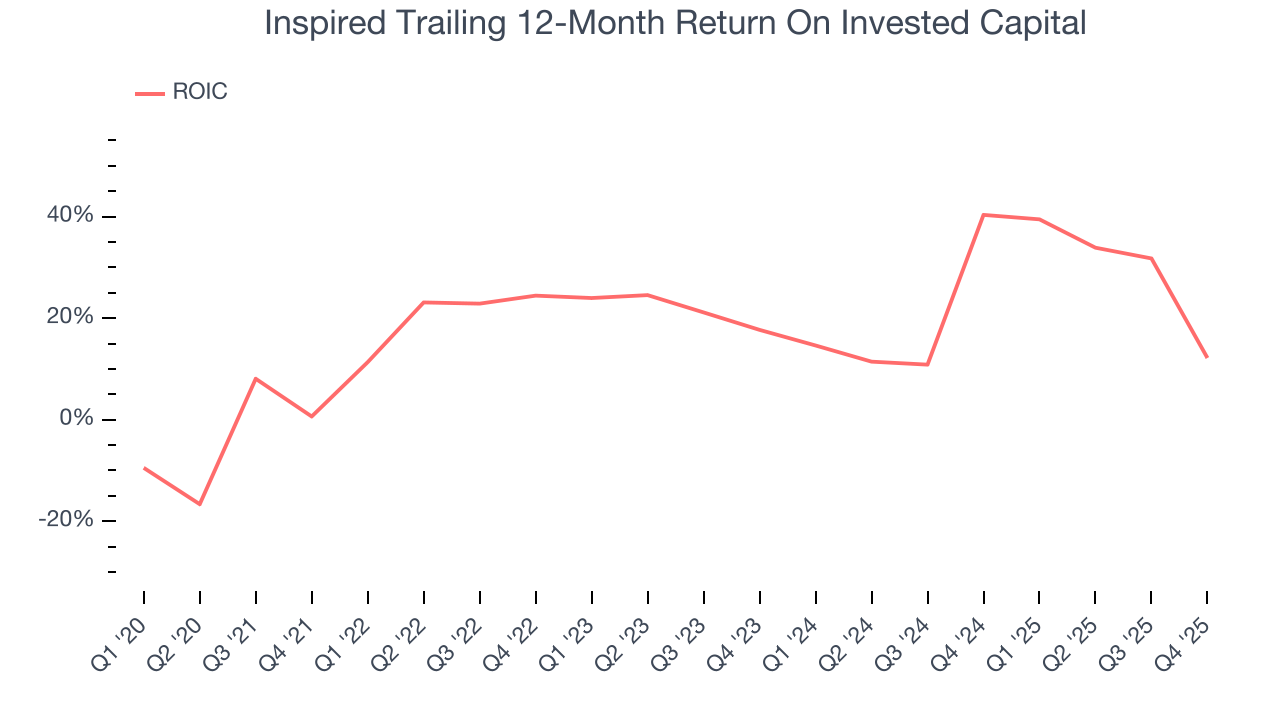
We like to invest in businesses with high returns, but the trend in a company’s ROIC is what often surprises the market and moves the stock price. Inspired’s ROIC has increased significantly over the last few years. This is a good sign, and we hope the company can continue improving.
10. Balance Sheet Assessment
Inspired reported $42 million of cash and $372.3 million of debt on its balance sheet in the most recent quarter. As investors in high-quality companies, we primarily focus on two things: 1) that a company’s debt level isn’t too high and 2) that its interest payments are not excessively burdening the business.
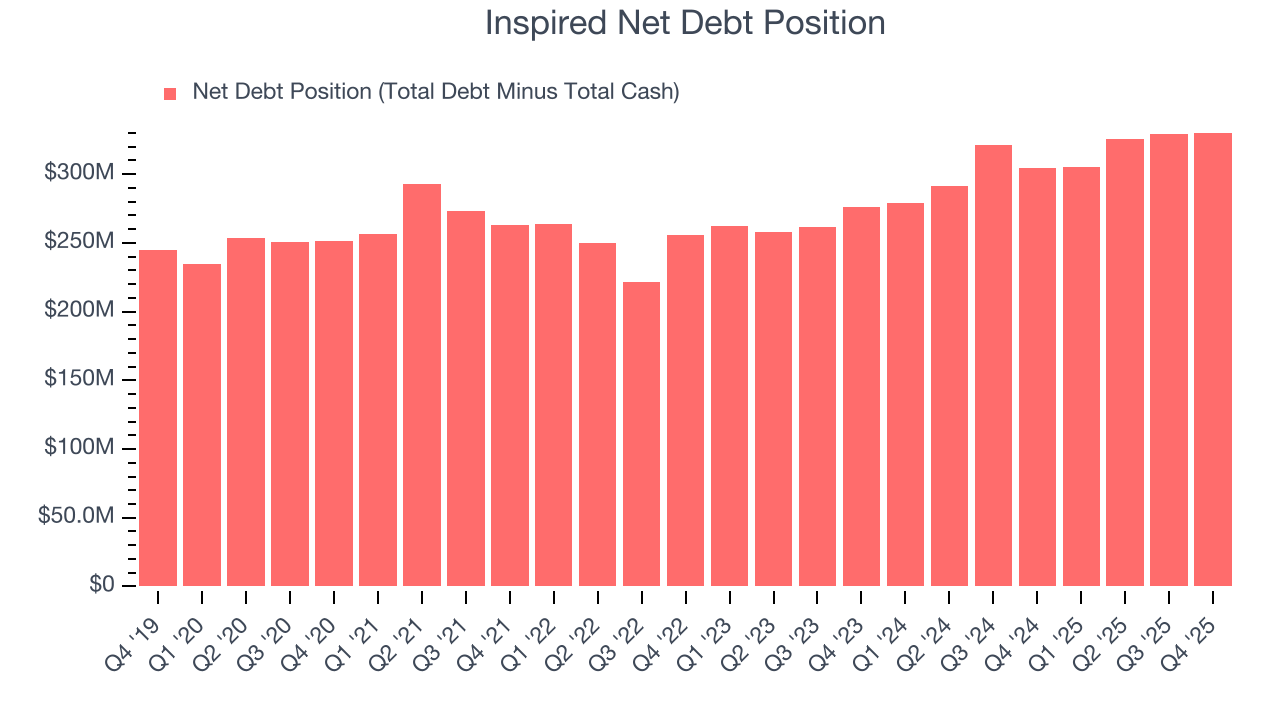
With $111.4 million of EBITDA over the last 12 months, we view Inspired’s 3.0× net-debt-to-EBITDA ratio as safe. We also see its $37.3 million of annual interest expenses as appropriate. The company’s profits give it plenty of breathing room, allowing it to continue investing in growth initiatives.
11. Key Takeaways from Inspired’s Q4 Results
It was encouraging to see Inspired beat analysts’ EBITDA expectations this quarter. On the other hand, its revenue fell slightly short of Wall Street’s estimates. Overall, this was a mixed quarter. The stock traded up 1.3% to $8.36 immediately following the results.
12. Is Now The Time To Buy Inspired?
Updated: March 15, 2026 at 11:04 PM EDT
The latest quarterly earnings matters, sure, but we actually think longer-term fundamentals and valuation matter more. Investors should consider all these pieces before deciding whether or not to invest in Inspired.
We cheer for all companies serving everyday consumers, but in the case of Inspired, we’ll be cheering from the sidelines. While its projected EPS for the next year implies the company’s fundamentals will improve, the downside is its relatively low ROIC suggests management has struggled to find compelling investment opportunities. On top of that, its low free cash flow margins give it little breathing room.
Inspired’s P/E ratio based on the next 12 months is 22x. While this valuation is reasonable, we don’t see a big opportunity at the moment. There are better investments elsewhere.
Wall Street analysts have a consensus one-year price target of $13.33 on the company (compared to the current share price of $6.38).
Although the price target is bullish, readers should exercise caution because analysts tend to be overly optimistic. The firms they work for, often big banks, have relationships with companies that extend into fundraising, M&A advisory, and other rewarding business lines. As a result, they typically hesitate to say bad things for fear they will lose out. We at StockStory do not suffer from such conflicts of interest, so we’ll always tell it like it is.