
nLIGHT (LASR)
We’re cautious of nLIGHT. Its poor sales growth shows demand is soft and its negative returns on capital suggest it destroyed value.― StockStory Analyst Team
1. News


2. Summary
Why nLIGHT Is Not Exciting
Founded by a former CEO and Harvard-educated entrepreneur Scott Keeneyn, nLIGHT (NASDAQ:LASR) offers semiconductor and fiber lasers to the industrial, aerospace & defense, and medical sectors.
- Poor expense management has led to operating margin losses
- Cash burn makes us question whether it can achieve sustainable long-term growth
- A positive is that its incremental sales were more profitable as its annual earnings per share growth of 8.4% outstripped its revenue performance


nLIGHT is in the penalty box. We’d search for superior opportunities elsewhere.
Why There Are Better Opportunities Than nLIGHT


nLIGHT’s stock price of $68.76 implies a valuation ratio of 190.4x forward P/E. The current multiple is quite expensive, especially for the tepid revenue growth.
We prefer to invest in similarly-priced but higher-quality companies with superior earnings growth.
3. nLIGHT (LASR) Research Report: Q4 CY2025 Update
Laser company nLIGHT (NASDAQ:LASR) reported Q4 CY2025 results exceeding the market’s revenue expectations, with sales up 71.3% year on year to $81.19 million. On top of that, next quarter’s revenue guidance ($73 million at the midpoint) was surprisingly good and 6.3% above what analysts were expecting. Its non-GAAP profit of $0.14 per share was 27.3% above analysts’ consensus estimates.
nLIGHT (LASR) Q4 CY2025 Highlights:
- Revenue: $81.19 million vs analyst estimates of $76.65 million (71.3% year-on-year growth, 5.9% beat)
- Adjusted EPS: $0.14 vs analyst estimates of $0.11 (27.3% beat)
- Adjusted EBITDA: $10.69 million vs analyst estimates of $8.25 million (13.2% margin, 29.6% beat)
- Revenue Guidance for Q1 CY2026 is $73 million at the midpoint, above analyst estimates of $68.65 million
- EBITDA guidance for Q1 CY2026 is $7.5 million at the midpoint, above analyst estimates of $4.67 million
- Operating Margin: -6.7%, up from -55.8% in the same quarter last year
- Free Cash Flow was $15.93 million, up from -$18.6 million in the same quarter last year
- Market Capitalization: $3.35 billion
Company Overview
Founded by a former CEO and Harvard-educated entrepreneur Scott Keeneyn, nLIGHT (NASDAQ:LASR) offers semiconductor and fiber lasers to the industrial, aerospace & defense, and medical sectors.
nLIGHT was founded in 2000 with a vision to develop and commercialize lasers. M&A has historically been pivotal in facilitating its growth, such as the acquisition of Nutronics in 2018, which strengthened its position in the aerospace & defense sector.
Today, nLIGHT specializes in designing and manufacturing semiconductor and fiber lasers for the industrial, aerospace & defense, and medical sectors. The company’s semiconductor lasers serve as the backbone for numerous industrial processes and enable manufacturers to improve productivity and cost-effectiveness. In addition, it offers fiber lasers that excel in applications requiring ultra-fine control.
The primary revenue sources for nLIGHT ultimately come from the sale of its semiconductor and fiber laser products along with related accessories and services. The company engages in contracts with original equipment manufacturers (OEMs), integrators, and end-users that often involve customizations, volume commitments, and technical support agreements. Additionally, nLIGHT offers training programs and aftermarket services. Its ongoing maintenance contracts and service agreements serve as sources of recurring revenue for the company.
4. Electronic Components
Like many equipment and component manufacturers, electronic components companies are buoyed by secular trends such as connectivity and industrial automation. More specific pockets of strong demand include data centers and telecommunications, which can benefit companies whose optical and transceiver offerings fit those markets. But like the broader industrials sector, these companies are also at the whim of economic cycles. Consumer spending, for example, can greatly impact these companies’ volumes.
Competitors offering similar products include IPG Photonics (NASDAQ:IPGP), Coherent (NASDAQ:COHR), and Jenoptik AG (ETR:JEN).
5. Revenue Growth
Reviewing a company’s long-term sales performance reveals insights into its quality. Any business can put up a good quarter or two, but many enduring ones grow for years. Unfortunately, nLIGHT’s 3.2% annualized revenue growth over the last five years was sluggish. This was below our standard for the industrials sector and is a tough starting point for our analysis.
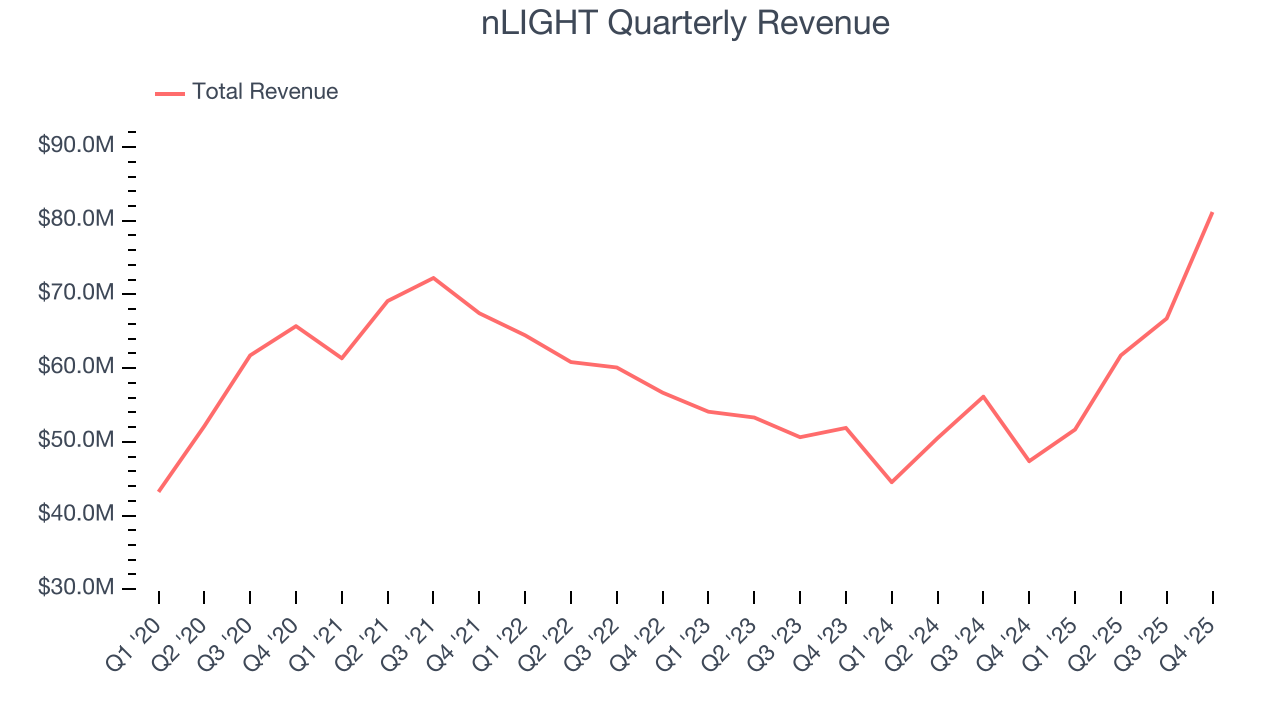
Long-term growth is the most important, but within industrials, a half-decade historical view may miss new industry trends or demand cycles. nLIGHT’s annualized revenue growth of 11.6% over the last two years is above its five-year trend, suggesting its demand recently accelerated. 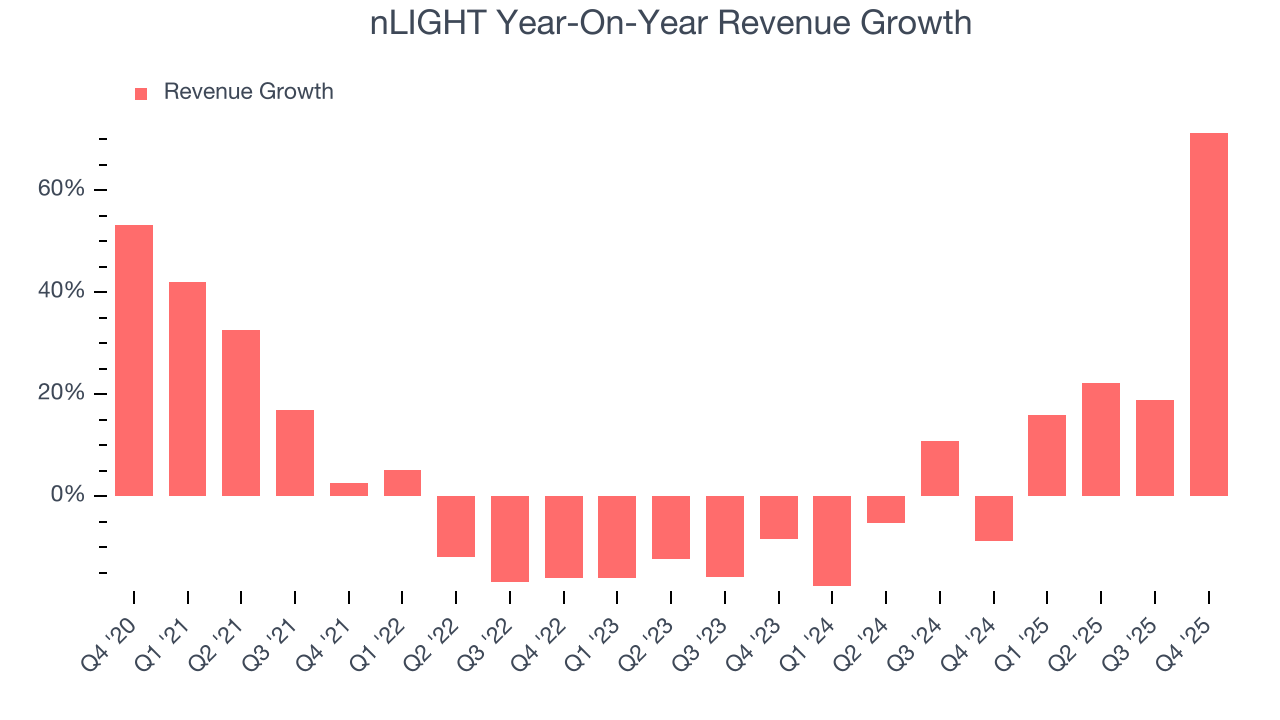
We can better understand the company’s revenue dynamics by analyzing its most important segments, Laser Products and Advanced Developments, which are 67.9% and 32.1% of revenue. Over the last two years, nLIGHT’s Laser Products revenue (lasers, amplifiers, and directed energy products) averaged 22.6% year-on-year growth while its Advanced Developments revenue (R&D contracts) averaged 28.3% growth. 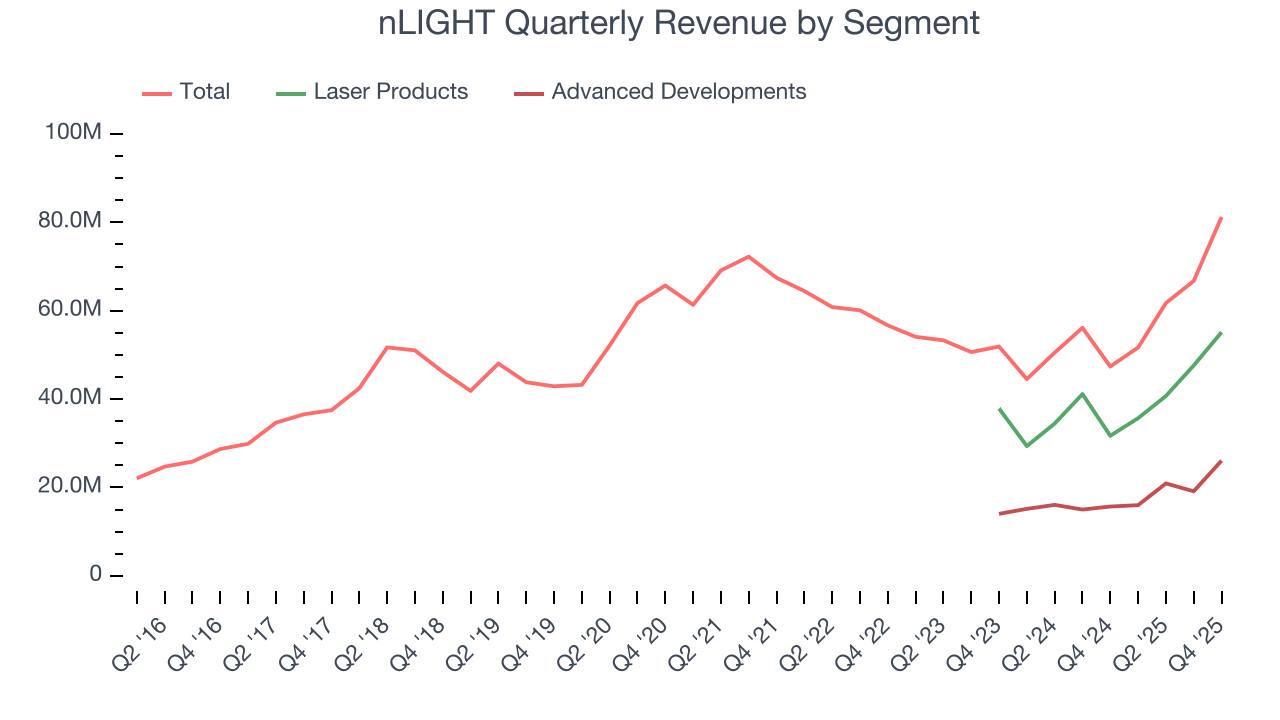
This quarter, nLIGHT reported magnificent year-on-year revenue growth of 71.3%, and its $81.19 million of revenue beat Wall Street’s estimates by 5.9%. Company management is currently guiding for a 41.3% year-on-year increase in sales next quarter.
Looking further ahead, sell-side analysts expect revenue to grow 11% over the next 12 months, similar to its two-year rate. This projection is commendable and indicates the market is baking in success for its products and services.
6. Gross Margin & Pricing Power
All else equal, we prefer higher gross margins because they make it easier to generate more operating profits and indicate that a company commands pricing power by offering more differentiated products.
nLIGHT has bad unit economics for an industrials company, giving it less room to reinvest and develop new offerings. As you can see below, it averaged a 24.1% gross margin over the last five years. Said differently, nLIGHT had to pay a chunky $75.87 to its suppliers for every $100 in revenue. 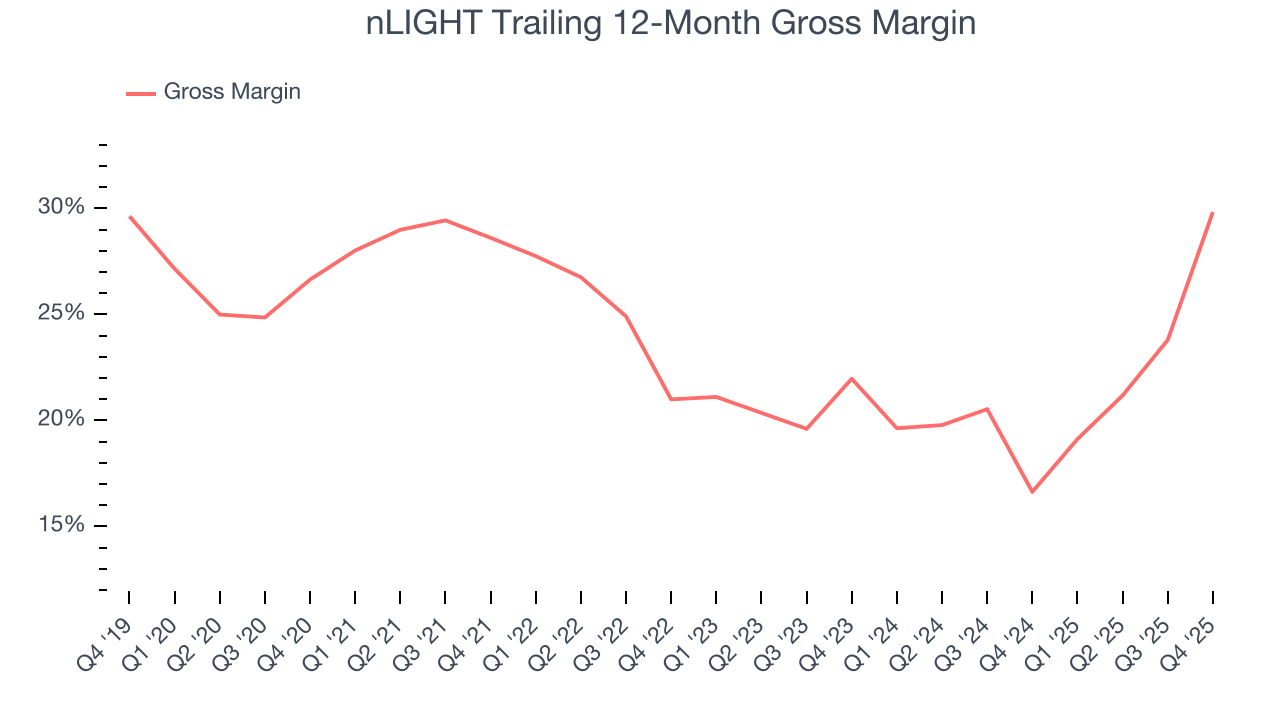
nLIGHT’s gross profit margin came in at 30.7% this quarter , marking a 28.4 percentage point increase from 2.4% in the same quarter last year. nLIGHT’s full-year margin has also been trending up over the past 12 months, increasing by 13.2 percentage points. If this move continues, it could suggest a less competitive environment where the company has better pricing power and leverage from its growing sales on the fixed portion of its cost of goods sold (such as manufacturing expenses).
7. Operating Margin
Operating margin is a key measure of profitability. Think of it as net income - the bottom line - excluding the impact of taxes and interest on debt, which are less connected to business fundamentals.
nLIGHT’s high expenses have contributed to an average operating margin of negative 19% over the last five years. Unprofitable industrials companies require extra attention because they could get caught swimming naked when the tide goes out. It’s hard to trust that the business can endure a full cycle.
On the plus side, nLIGHT’s operating margin rose by 1 percentage points over the last five years, as its sales growth gave it operating leverage. Still, it will take much more for the company to reach long-term profitability.
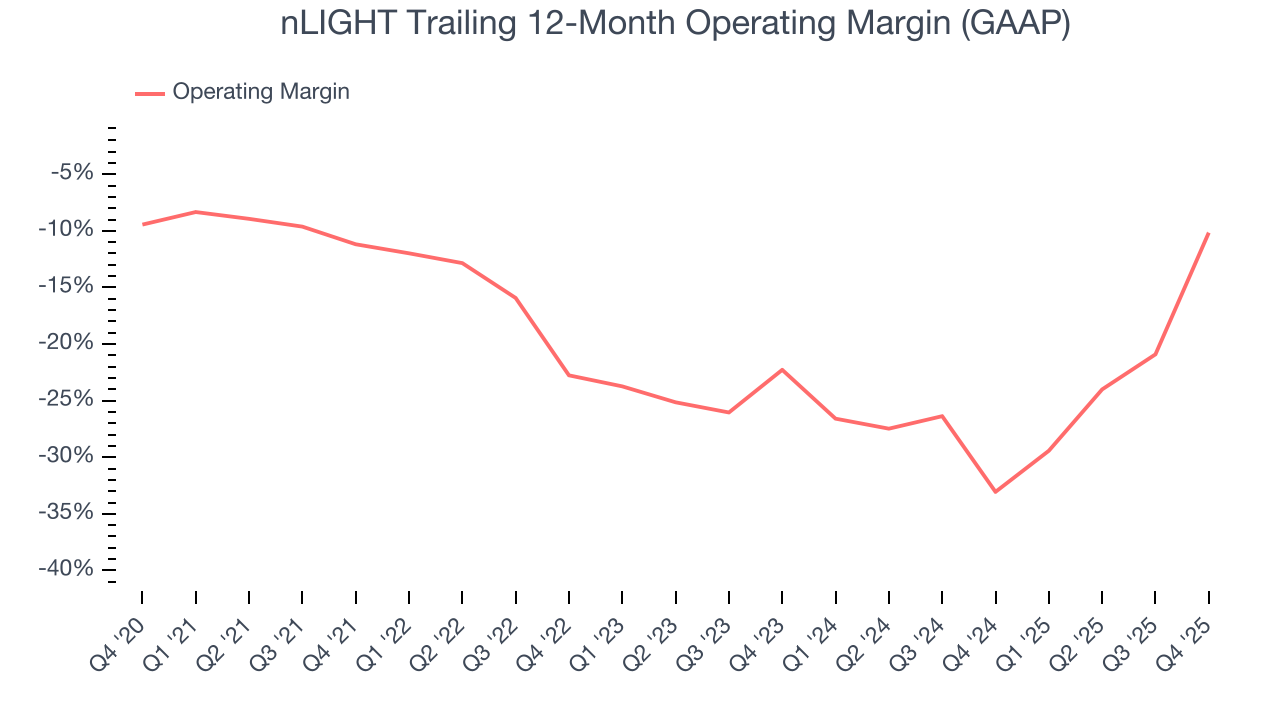
nLIGHT’s operating margin was negative 6.7% this quarter. The company's consistent lack of profits raise a flag.
8. Earnings Per Share
Revenue trends explain a company’s historical growth, but the long-term change in earnings per share (EPS) points to the profitability of that growth – for example, a company could inflate its sales through excessive spending on advertising and promotions.
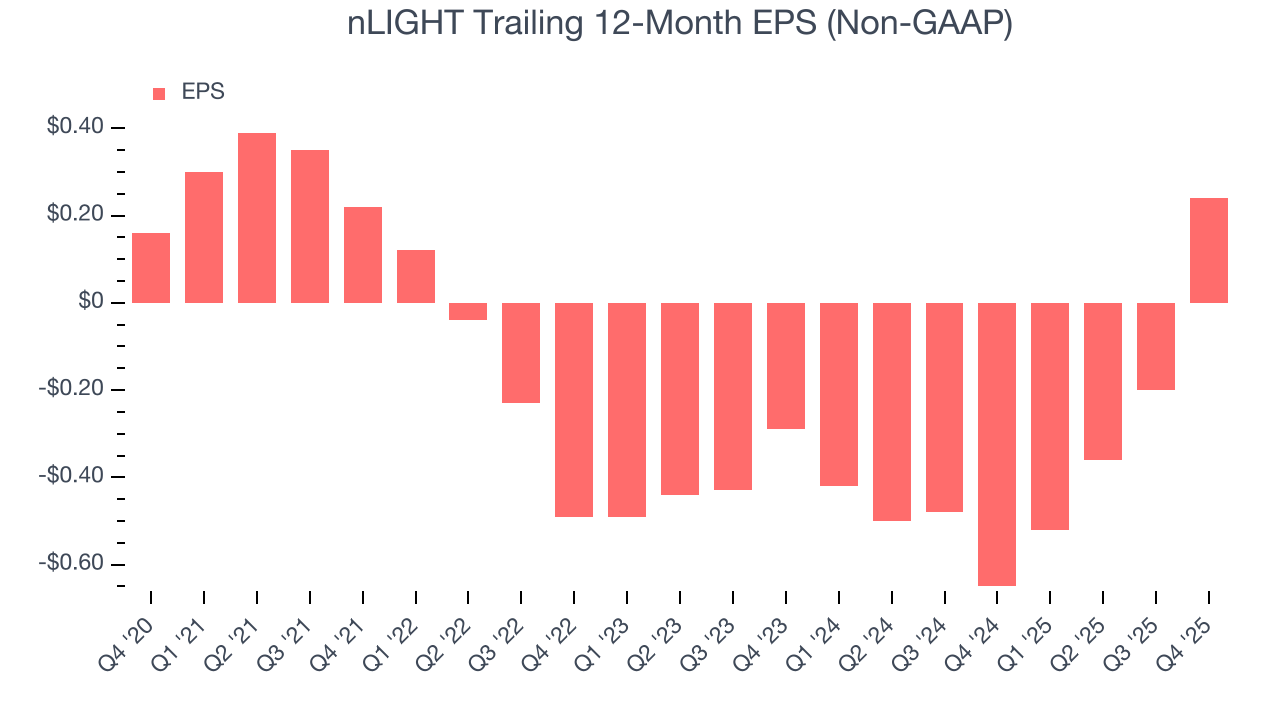
nLIGHT’s EPS grew at a decent 8.4% compounded annual growth rate over the last five years, higher than its 3.2% annualized revenue growth. This tells us the company became more profitable on a per-share basis as it expanded.
Diving into the nuances of nLIGHT’s earnings can give us a better understanding of its performance. As we mentioned earlier, nLIGHT’s operating margin expanded by 1 percentage points over the last five years. This was the most relevant factor (aside from the revenue impact) behind its higher earnings; interest expenses and taxes can also affect EPS but don’t tell us as much about a company’s fundamentals.
Like with revenue, we analyze EPS over a shorter period to see if we are missing a change in the business.
For nLIGHT, its two-year annual EPS growth of 68.2% was higher than its five-year trend. This acceleration made it one of the faster-growing industrials companies in recent history.
In Q4, nLIGHT reported adjusted EPS of $0.14, up from negative $0.30 in the same quarter last year. This print easily cleared analysts’ estimates, and shareholders should be content with the results. Over the next 12 months, Wall Street expects nLIGHT’s full-year EPS of $0.24 to grow 13.1%.
9. Cash Is King
Free cash flow isn't a prominently featured metric in company financials and earnings releases, but we think it's telling because it accounts for all operating and capital expenses, making it tough to manipulate. Cash is king.
While nLIGHT posted positive free cash flow this quarter, the broader story hasn’t been so clean. nLIGHT’s demanding reinvestments have drained its resources over the last five years, putting it in a pinch and limiting its ability to return capital to investors. Its free cash flow margin averaged negative 4.6%, meaning it lit $4.65 of cash on fire for every $100 in revenue.
Taking a step back, an encouraging sign is that nLIGHT’s margin expanded by 15.1 percentage points during that time. We have no doubt shareholders would like to continue seeing its cash conversion rise.
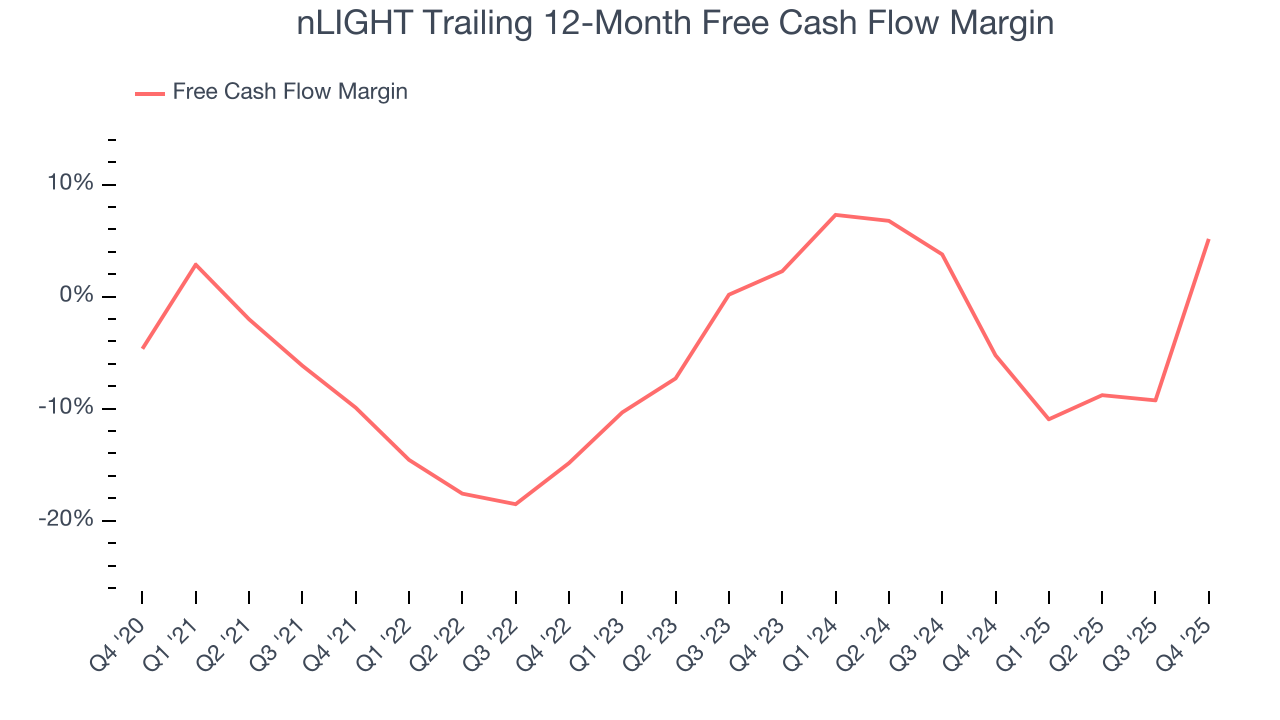
nLIGHT’s free cash flow clocked in at $15.93 million in Q4, equivalent to a 19.6% margin. Its cash flow turned positive after being negative in the same quarter last year, marking a potential inflection point.
10. Return on Invested Capital (ROIC)
EPS and free cash flow tell us whether a company was profitable while growing its revenue. But was it capital-efficient? A company’s ROIC explains this by showing how much operating profit it makes compared to the money it has raised (debt and equity).
nLIGHT’s five-year average ROIC was negative 29.5%, meaning management lost money while trying to expand the business. Its returns were among the worst in the industrials sector.
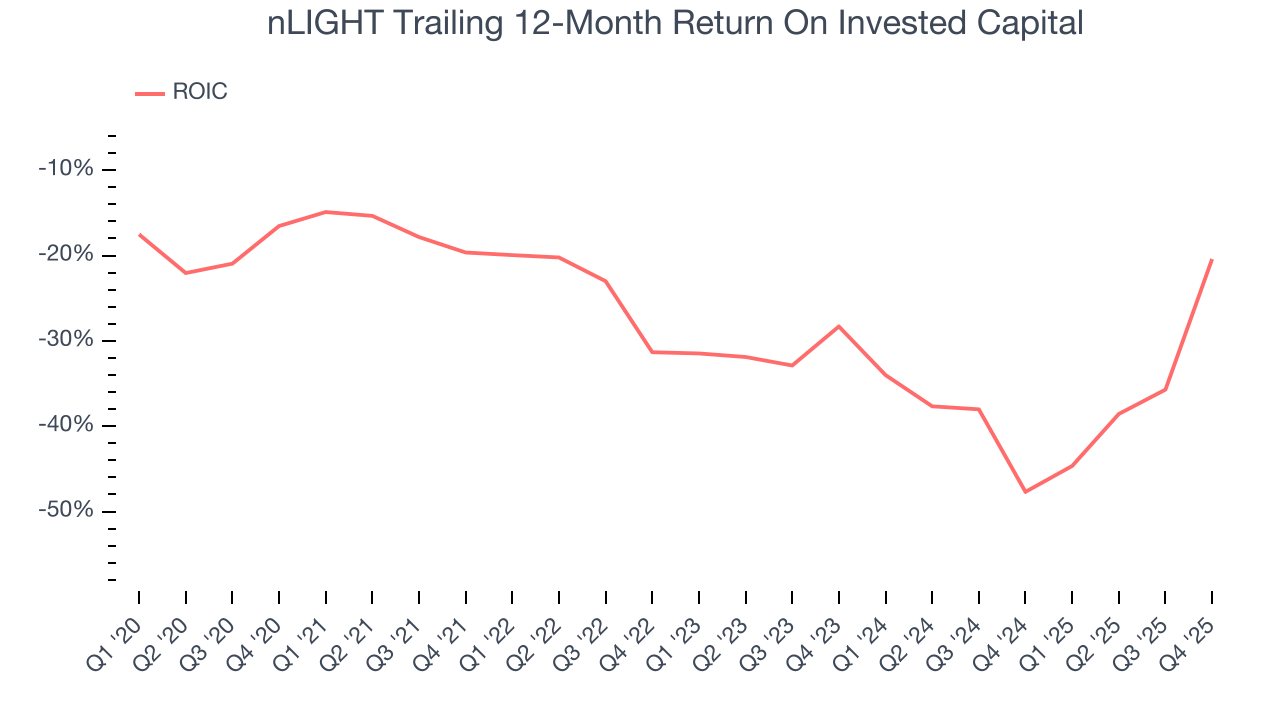
We like to invest in businesses with high returns, but the trend in a company’s ROIC is what often surprises the market and moves the stock price. Unfortunately, nLIGHT’s ROIC has decreased over the last few years. Paired with its already low returns, these declines suggest its profitable growth opportunities are few and far between.
11. Balance Sheet Assessment
Businesses that maintain a cash surplus face reduced bankruptcy risk.
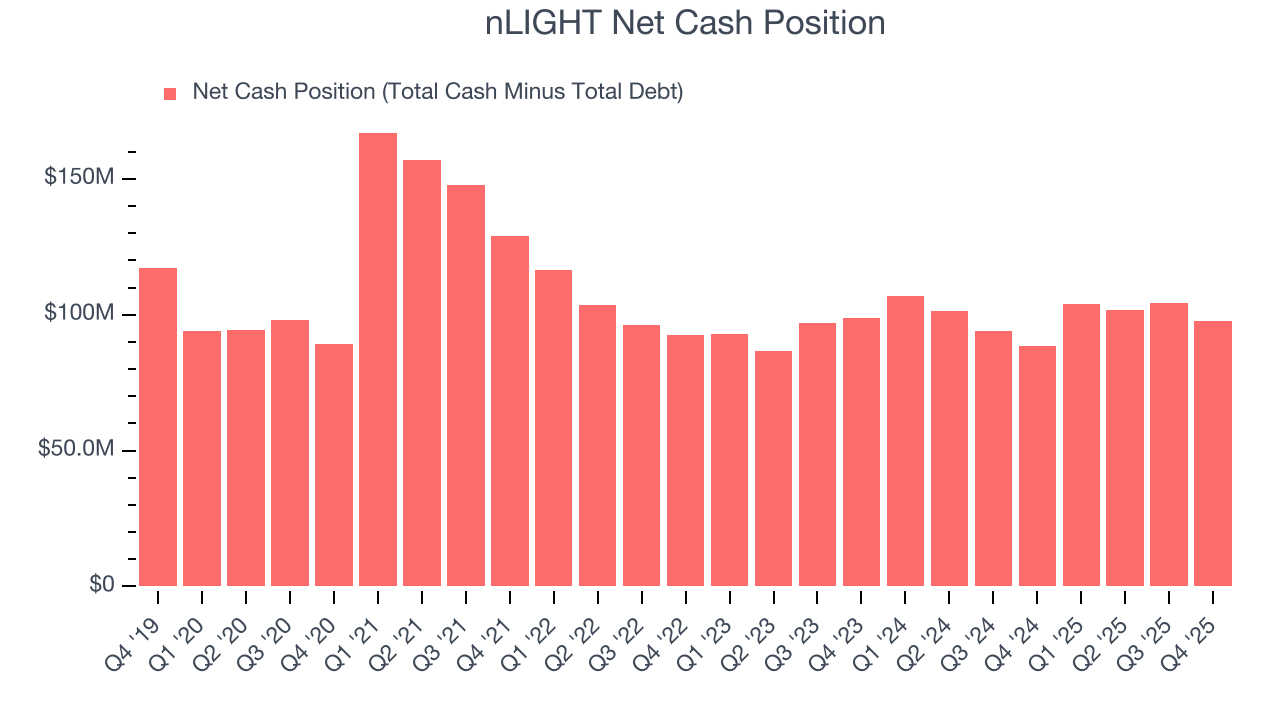
nLIGHT is a well-capitalized company with $134 million of cash and $36.21 million of debt on its balance sheet. This $97.75 million net cash position is 2.9% of its market cap and gives it the freedom to borrow money, return capital to shareholders, or invest in growth initiatives. Leverage is not an issue here.
12. Key Takeaways from nLIGHT’s Q4 Results
We were impressed by nLIGHT’s optimistic EBITDA guidance for next quarter, which blew past analysts’ expectations. We were also glad its EPS outperformed Wall Street’s estimates. Zooming out, we think this was a solid print. Investors were likely hoping for more, and shares traded down 6% to $57.75 immediately following the results.
13. Is Now The Time To Buy nLIGHT?
Updated: March 16, 2026 at 10:41 PM EDT
The latest quarterly earnings matters, sure, but we actually think longer-term fundamentals and valuation matter more. Investors should consider all these pieces before deciding whether or not to invest in nLIGHT.
nLIGHT’s business quality ultimately falls short of our standards. First off, its revenue growth was weak over the last five years. While its rising cash profitability gives it more optionality, the downside is its diminishing returns show management's prior bets haven't worked out. On top of that, its relatively low ROIC suggests management has struggled to find compelling investment opportunities.
nLIGHT’s P/E ratio based on the next 12 months is 190.4x. This valuation tells us it’s a bit of a market darling with a lot of good news priced in - you can find more timely opportunities elsewhere.
Wall Street analysts have a consensus one-year price target of $73.50 on the company (compared to the current share price of $68.76).