
LSI (LYTS)
We love companies like LSI. Its revenue is growing quickly while its profitability is rising, giving it multiple ways to win.― StockStory Analyst Team
1. News


2. Summary
Why We Like LSI
Enhancing commercial environments, LSI (NASDAQ:LYTS) provides lighting and display solutions for businesses and retailers.
- Impressive 16.1% annual revenue growth over the last five years indicates it’s winning market share this cycle
- Incremental sales significantly boosted profitability as its annual earnings per share growth of 45% over the last five years outstripped its revenue performance
- Acceptable returns on capital suggest management generated shareholder value by investing in profitable projects, and its returns are growing as it capitalizes on better market opportunities


We’re fond of companies like LSI. The price seems reasonable in light of its quality, so this could be an opportune time to invest in some shares.
Why Is Now The Time To Buy LSI?


LSI’s stock price of $19.30 implies a valuation ratio of 13.8x forward P/E. The valuation multiple is below many companies in the industrials sector. We therefore think the stock is a good deal for the fundamentals.
Our analysis and backtests show high-quality businesses routinely outperform the market over a multi-year period, especially when priced like this.
3. LSI (LYTS) Research Report: Q4 CY2025 Update
Commercial lighting and retail display solutions provider LSI (NASDAQ:LYTS) announced better-than-expected revenue in Q4 CY2025, but sales were flat year on year at $147 million. Its non-GAAP profit of $0.26 per share was 20.9% above analysts’ consensus estimates.
LSI (LYTS) Q4 CY2025 Highlights:
- Revenue: $147 million vs analyst estimates of $140.1 million (flat year on year, 4.9% beat)
- Adjusted EPS: $0.26 vs analyst estimates of $0.22 (20.9% beat)
- Adjusted EBITDA: $13.36 million vs analyst estimates of $12.42 million (9.1% margin, 7.6% beat)
- Operating Margin: 6%, in line with the same quarter last year
- Free Cash Flow Margin: 15.9%, up from 6% in the same quarter last year
- Market Capitalization: $612 million
Company Overview
Enhancing commercial environments, LSI (NASDAQ:LYTS) provides lighting and display solutions for businesses and retailers.
Specifically, the company produces high-performance, American-made lighting solutions and retail display products. LSI's business is structured into two primary segments: the Lighting Segment and the Display Solutions Segment.
The Lighting Segment forms the core of LSI's operations, offering outdoor and indoor lighting fixtures and control solutions. These products cater to vertical markets, including refueling and convenience stores, parking lots and garages, quick-service restaurants, retail establishments, grocery stores and pharmacies, automotive dealerships, sports courts and fields, and warehouses.
The Display Solutions Segment complements LSI's lighting offerings by manufacturing, selling, and installing exterior and interior visual image and display elements. This segment's product portfolio includes signage and canopy graphics, pump dispenser graphics, building fascia graphics, interior signage, marketing graphics, and merchandising displays, both refrigerated and non-refrigerated.
The company generates income through multiple channels, including project-based business, where LSI serves as a preferred vendor for product sales to end-users, and standard product sales to stocking distributors. The project-based business often involves significant program initiatives that span multiple sites over extended periods, particularly in the Display Solutions Segment. LSI's customer base includes national retail marketers, branded product companies, franchised operations, and dealer networks.
4. Electrical Systems
Like many equipment and component manufacturers, electrical systems companies are buoyed by secular trends such as connectivity and industrial automation. More specific pockets of strong demand include Internet of Things (IoT) connectivity and the 5G telecom upgrade cycle, which can benefit companies whose cables and conduits fit those needs. But like the broader industrials sector, these companies are also at the whim of economic cycles. Interest rates, for example, can greatly impact projects that drive demand for these products.
Competitors of LSI include Acuity Brands, Inc. (NYSE:AYI), Hubbell Incorporated (NYSE:HUBB), and Eaton Corporation plc (NYSE:ETN).
5. Revenue Growth
Examining a company’s long-term performance can provide clues about its quality. Even a bad business can shine for one or two quarters, but a top-tier one grows for years. Over the last five years, LSI grew its sales at an incredible 16.1% compounded annual growth rate. Its growth beat the average industrials company and shows its offerings resonate with customers, a helpful starting point for our analysis.
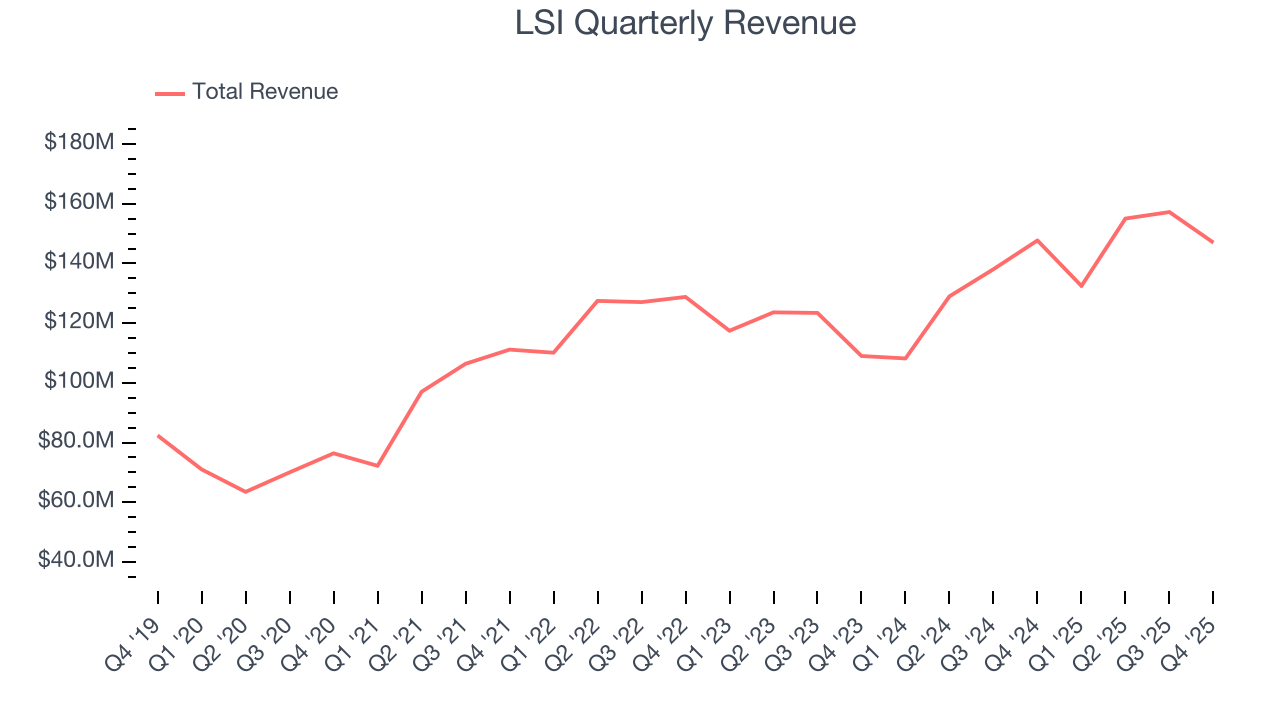
Long-term growth is the most important, but within industrials, a half-decade historical view may miss new industry trends or demand cycles. LSI’s annualized revenue growth of 11.8% over the last two years is below its five-year trend, but we still think the results suggest healthy demand. 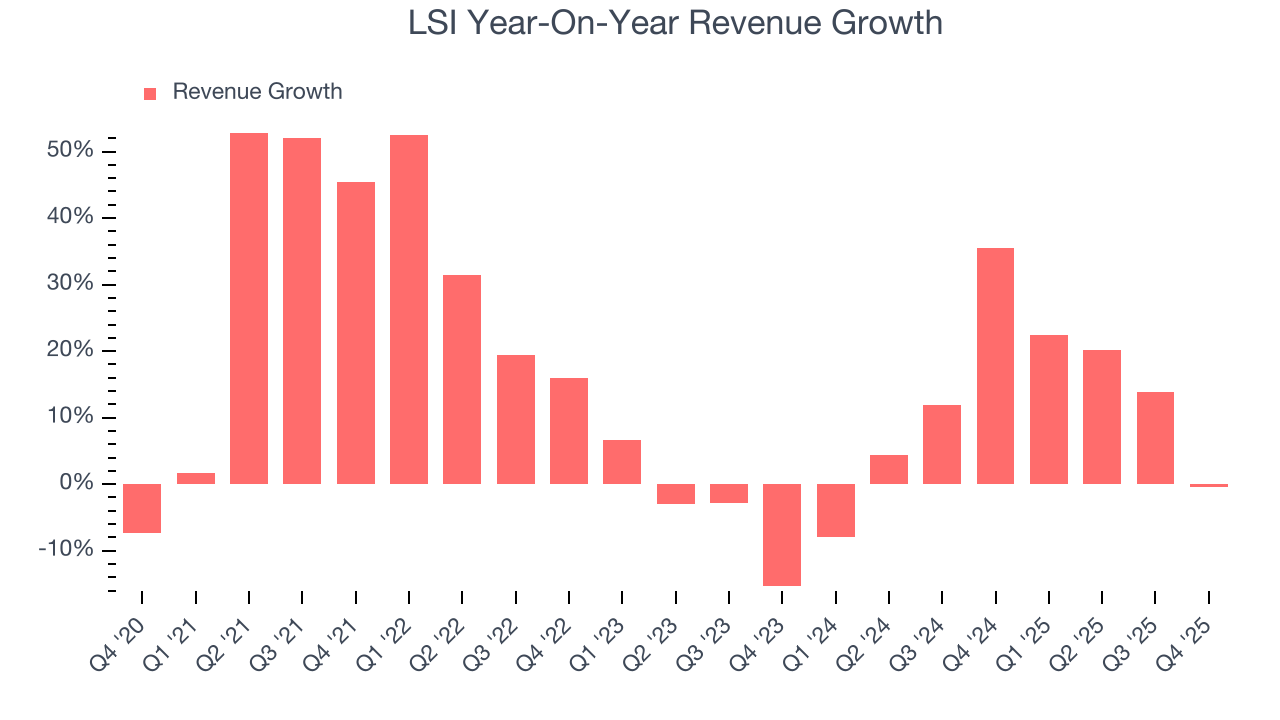
This quarter, LSI’s $147 million of revenue was flat year on year but beat Wall Street’s estimates by 4.9%.
Looking ahead, sell-side analysts expect revenue to grow 3.9% over the next 12 months, a deceleration versus the last two years. This projection doesn't excite us and indicates its products and services will see some demand headwinds. At least the company is tracking well in other measures of financial health.
6. Gross Margin & Pricing Power
LSI has bad unit economics for an industrials company, giving it less room to reinvest and develop new offerings. As you can see below, it averaged a 26% gross margin over the last five years. Said differently, LSI had to pay a chunky $74.05 to its suppliers for every $100 in revenue. 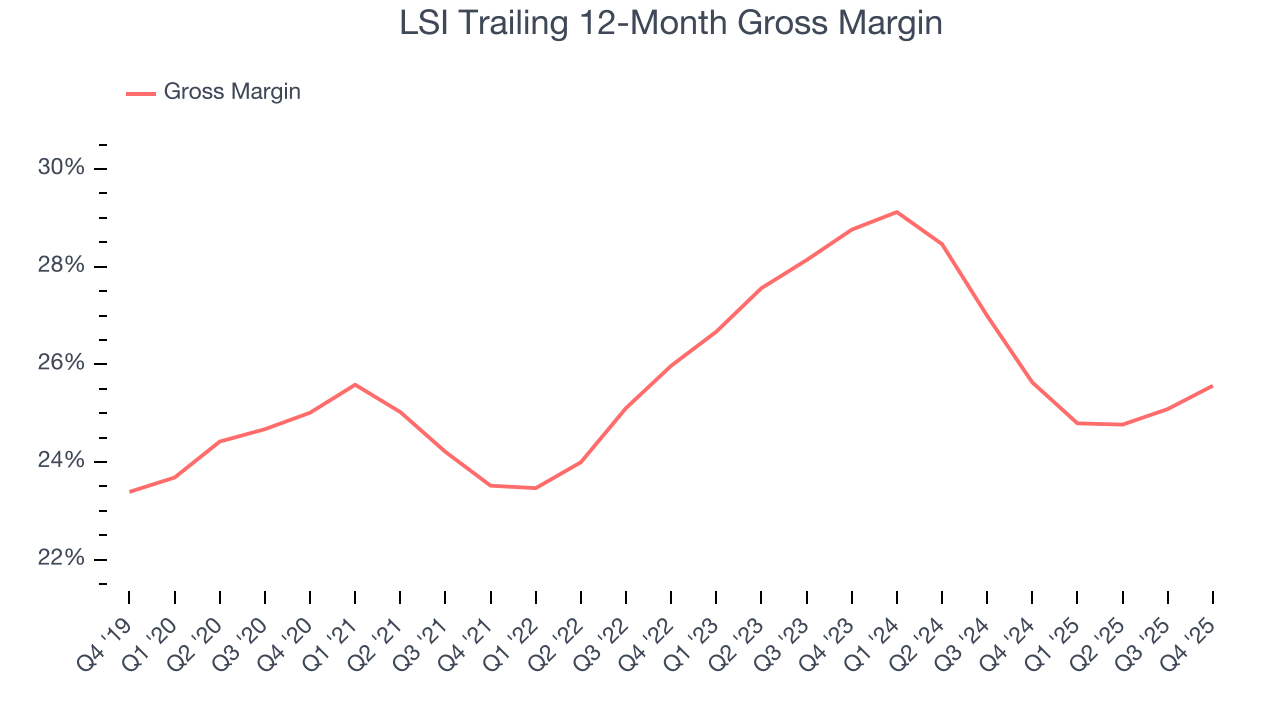
In Q4, LSI produced a 25.5% gross profit margin, up 1.9 percentage points year on year. Zooming out, the company’s full-year margin has remained steady over the past 12 months, suggesting its input costs (such as raw materials and manufacturing expenses) have been stable and it isn’t under pressure to lower prices.
7. Operating Margin
LSI was profitable over the last five years but held back by its large cost base. Its average operating margin of 6.4% was weak for an industrials business. This result isn’t too surprising given its low gross margin as a starting point.
On the plus side, LSI’s operating margin rose by 2.8 percentage points over the last five years, as its sales growth gave it operating leverage.
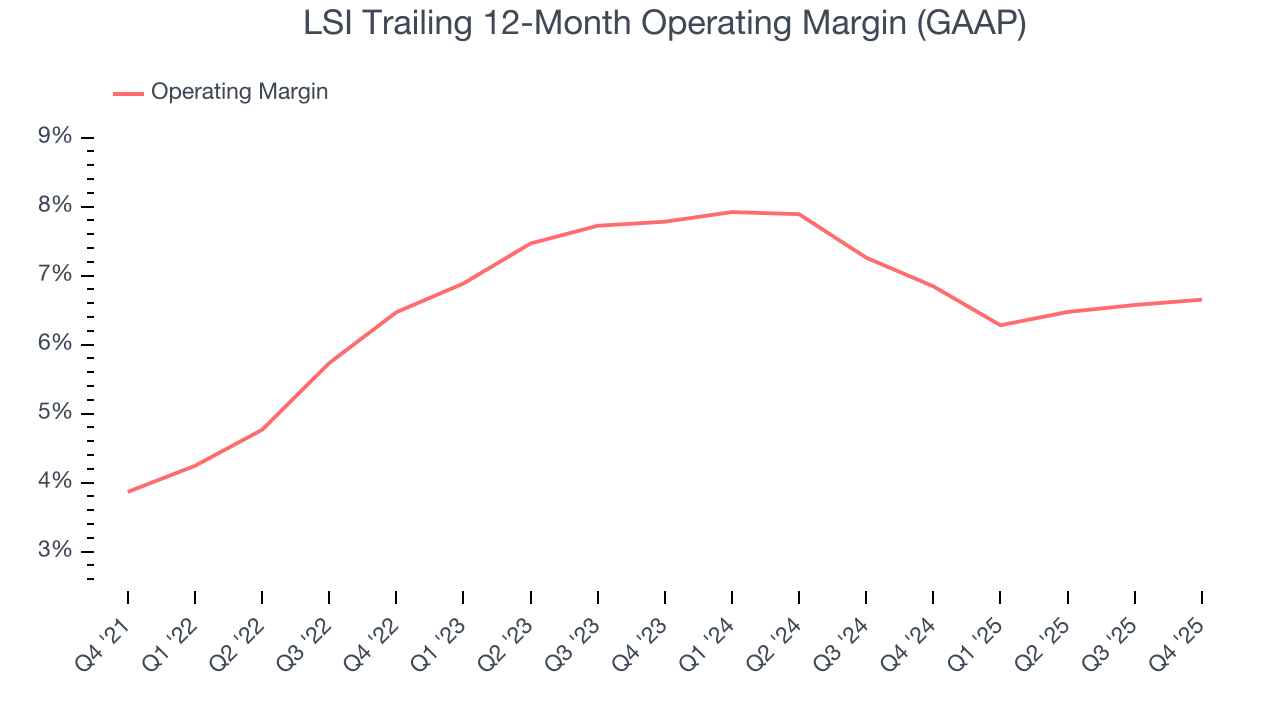
This quarter, LSI generated an operating margin profit margin of 6%, in line with the same quarter last year. This indicates the company’s cost structure has recently been stable.
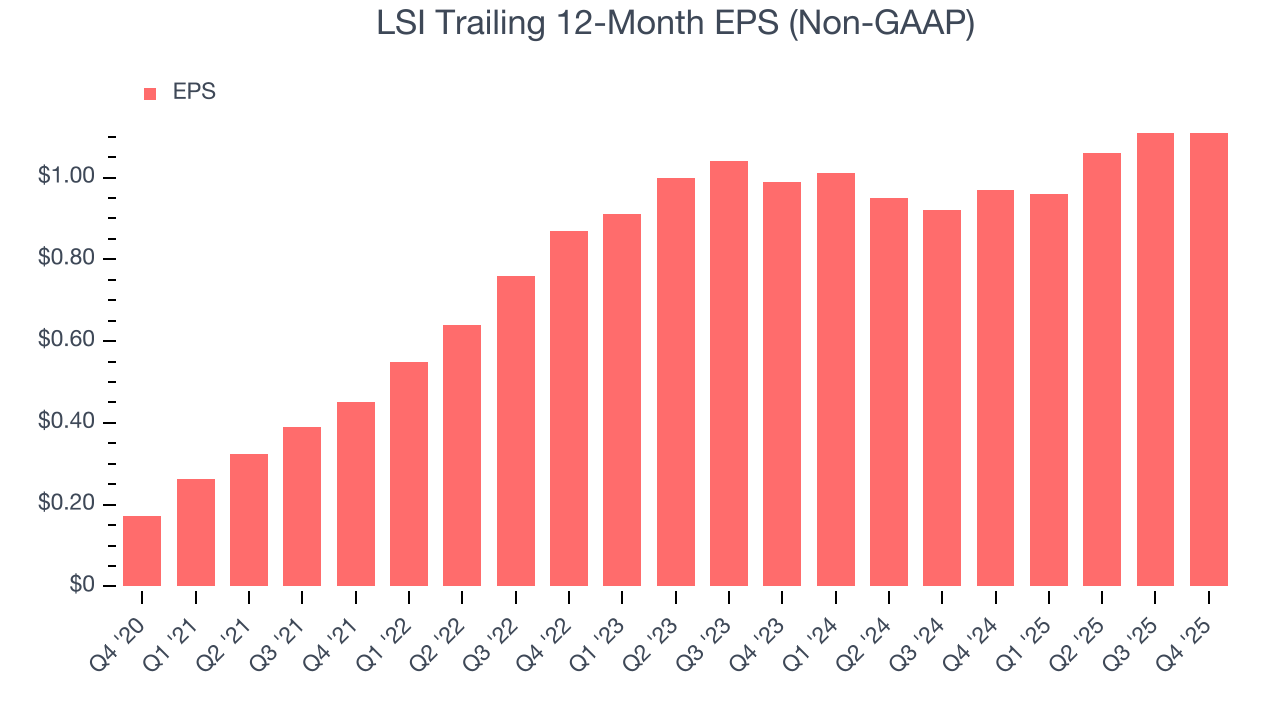
8. Earnings Per Share
Revenue trends explain a company’s historical growth, but the long-term change in earnings per share (EPS) points to the profitability of that growth – for example, a company could inflate its sales through excessive spending on advertising and promotions.
LSI’s EPS grew at an astounding 45% compounded annual growth rate over the last five years, higher than its 16.1% annualized revenue growth. This tells us the company became more profitable on a per-share basis as it expanded.
We can take a deeper look into LSI’s earnings quality to better understand the drivers of its performance. As we mentioned earlier, LSI’s operating margin was flat this quarter but expanded by 2.8 percentage points over the last five years. This was the most relevant factor (aside from the revenue impact) behind its higher earnings; interest expenses and taxes can also affect EPS but don’t tell us as much about a company’s fundamentals.
Like with revenue, we analyze EPS over a more recent period because it can provide insight into an emerging theme or development for the business.
For LSI, its two-year annual EPS growth of 5.9% was lower than its five-year trend. This wasn’t great, but at least the company was successful in other measures of financial health.
In Q4, LSI reported adjusted EPS of $0.26, in line with the same quarter last year. This print easily cleared analysts’ estimates, and shareholders should be content with the results. Over the next 12 months, Wall Street expects LSI’s full-year EPS of $1.11 to grow 19.4%.
9. Cash Is King
Although earnings are undoubtedly valuable for assessing company performance, we believe cash is king because you can’t use accounting profits to pay the bills.
LSI has shown mediocre cash profitability over the last five years, giving the company limited opportunities to return capital to shareholders. Its free cash flow margin averaged 6%, subpar for an industrials business.
Taking a step back, an encouraging sign is that LSI’s margin expanded by 7.2 percentage points during that time. The company’s improvement shows it’s heading in the right direction, and we can see it became a less capital-intensive business because its free cash flow profitability rose more than its operating profitability.
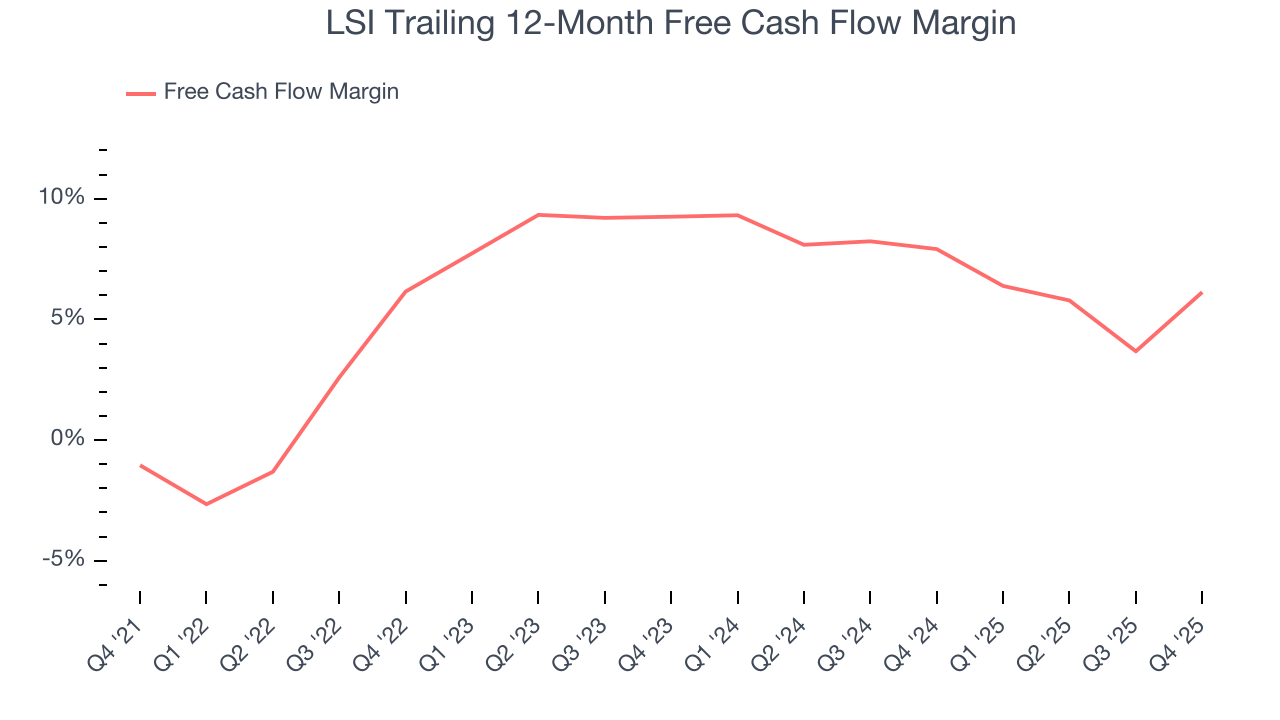
LSI’s free cash flow clocked in at $23.3 million in Q4, equivalent to a 15.9% margin. This result was good as its margin was 9.9 percentage points higher than in the same quarter last year, building on its favorable historical trend.
10. Return on Invested Capital (ROIC)
EPS and free cash flow tell us whether a company was profitable while growing its revenue. But was it capital-efficient? A company’s ROIC explains this by showing how much operating profit it makes compared to the money it has raised (debt and equity).
LSI’s management team makes decent investment decisions and generates value for shareholders. Its five-year average ROIC was 10.8%, slightly better than typical industrials business.
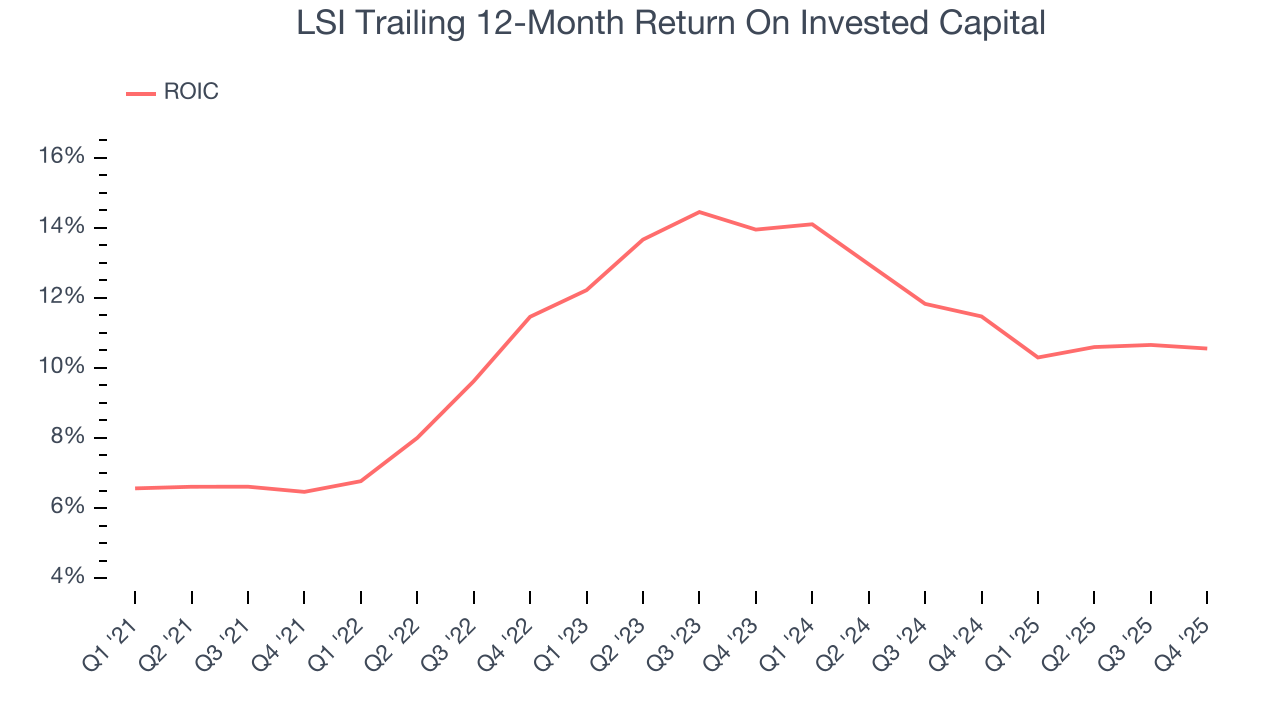
We like to invest in businesses with high returns, but the trend in a company’s ROIC is what often surprises the market and moves the stock price. Fortunately, LSI’s ROIC averaged 2.1 percentage point increases over the last few years. This is a great sign when paired with its already strong returns. It could suggest its competitive advantage or profitable growth opportunities are expanding.
11. Balance Sheet Assessment
LSI reported $6.41 million of cash and $27.94 million of debt on its balance sheet in the most recent quarter. As investors in high-quality companies, we primarily focus on two things: 1) that a company’s debt level isn’t too high and 2) that its interest payments are not excessively burdening the business.
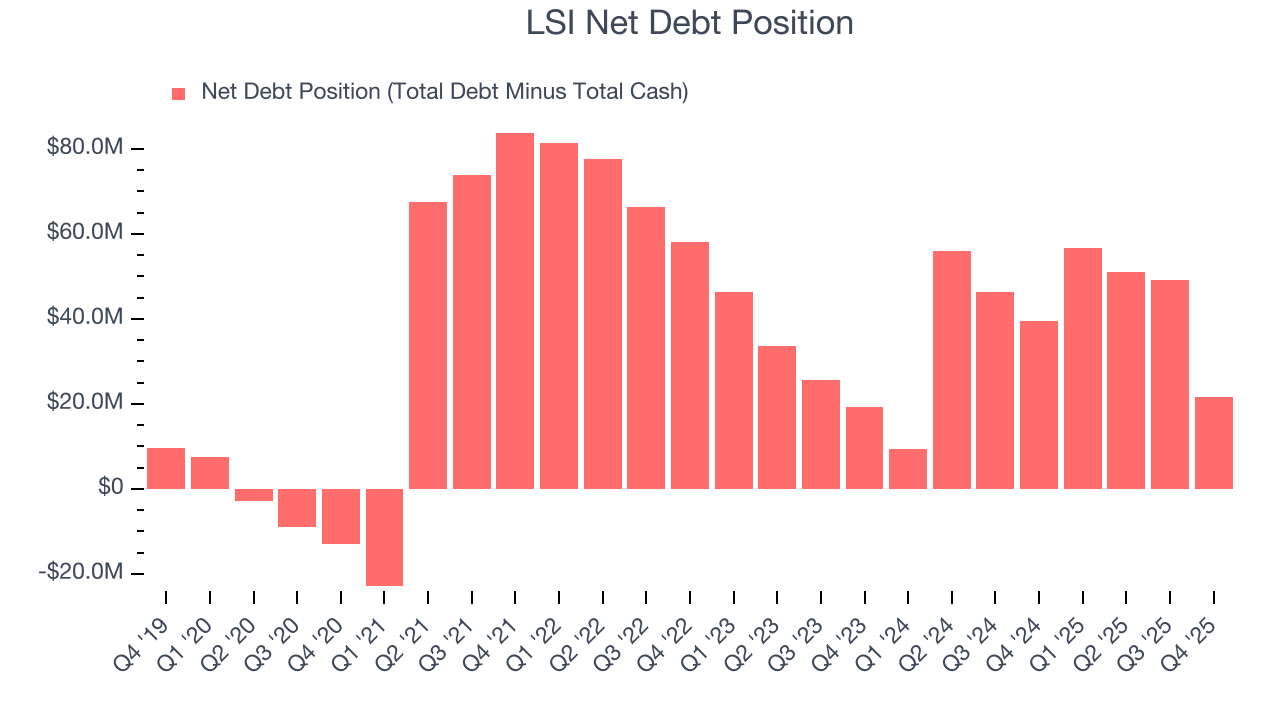
With $57.37 million of EBITDA over the last 12 months, we view LSI’s 0.4× net-debt-to-EBITDA ratio as safe. We also see its $1.7 million of annual interest expenses as appropriate. The company’s profits give it plenty of breathing room, allowing it to continue investing in growth initiatives.
12. Key Takeaways from LSI’s Q4 Results
We were impressed by how significantly LSI blew past analysts’ EBITDA expectations this quarter. We were also excited its revenue outperformed Wall Street’s estimates by a wide margin. Zooming out, we think this quarter featured some important positives. The stock remained flat at $20.38 immediately after reporting.
13. Is Now The Time To Buy LSI?
Updated: March 13, 2026 at 10:04 PM EDT
We think that the latest earnings result is only one piece of the bigger puzzle. If you’re deciding whether to own LSI, you should also grasp the company’s longer-term business quality and valuation.
There are several reasons why we think LSI is a great business. First of all, the company’s revenue growth was exceptional over the last five years. On top of that, its rising cash profitability gives it more optionality, and its astounding EPS growth over the last five years shows its profits are trickling down to shareholders.
LSI’s P/E ratio based on the next 12 months is 13.8x. Scanning the industrials space today, LSI’s fundamentals really stand out, and we like it at this price.
Wall Street analysts have a consensus one-year price target of $30.50 on the company (compared to the current share price of $19.30), implying they see 58% upside in buying LSI in the short term.