
MYR Group (MYRG)
MYR Group doesn’t excite us. Its weak sales growth and declining returns on capital show its demand and profits are shrinking.― StockStory Analyst Team
1. News


2. Summary
Why MYR Group Is Not Exciting
Constructing electrical and phone lines in the American Midwest dating back to the 1890s, MYR Group (NASDAQ:MYRG) is a specialty contractor in the electrical construction industry.
- Gross margin of 10.8% is below its competitors, leaving less money to invest in areas like marketing and R&D
- Low free cash flow margin gives it little breathing room, constraining its ability to self-fund growth or return capital to shareholders
- A bright spot is that its earnings growth has outpaced its peers over the last five years as its EPS has compounded at 16.7% annually


MYR Group’s quality isn’t up to par. We see more lucrative opportunities elsewhere.
Why There Are Better Opportunities Than MYR Group


At $270.82 per share, MYR Group trades at 28.2x forward P/E. Not only does MYR Group trade at a premium to companies in the industrials space, but this multiple is also high for its fundamentals.
There are stocks out there featuring similar valuation multiples with better fundamentals. We prefer to invest in those.
3. MYR Group (MYRG) Research Report: Q4 CY2025 Update
Electrical construction and infrastructure services provider MYR Group (NASDAQ:MYRG) beat Wall Street’s revenue expectations in Q4 CY2025, with sales up 17.3% year on year to $973.5 million. Its GAAP profit of $2.33 per share was 30.5% above analysts’ consensus estimates.
MYR Group (MYRG) Q4 CY2025 Highlights:
- Revenue: $973.5 million vs analyst estimates of $901.3 million (17.3% year-on-year growth, 8% beat)
- EPS (GAAP): $2.33 vs analyst estimates of $1.79 (30.5% beat)
- Adjusted EBITDA: $64.23 million vs analyst estimates of $59.26 million (6.6% margin, 8.4% beat)
- Operating Margin: 4.8%, up from 3.6% in the same quarter last year
- Free Cash Flow Margin: 8.7%, up from 1.1% in the same quarter last year
- Backlog: $2.82 billion at quarter end, up 9.3% year on year
- Market Capitalization: $4.33 billion
Company Overview
Constructing electrical and phone lines in the American Midwest dating back to the 1890s, MYR Group (NASDAQ:MYRG) is a specialty contractor in the electrical construction industry.
Founded through the merger of long-standing specialty contractors in 1995, MYR Group has established itself in the electrical infrastructure and construction sector. The company operates through two primary segments: Transmission and Distribution (T&D) and Commercial and Industrial (C&I).
The T&D segment, which has roots dating back to 1891, offers services for electric transmission and distribution networks. These services include design, engineering, procurement, construction, upgrade, maintenance, and repair of electric utility infrastructure. In this segment, the company often serves as a prime contractor, working under traditional design-bid-build or engineering, procurement, and construction (EPC) project delivery methods.
In the C&I segment, MYR Group has been providing electrical contracting services since 1912. This division focuses on the design, installation, maintenance, and repair of commercial and industrial wiring systems. The C&I segment also handles the installation of intelligent transportation systems, roadway lighting, signalization, and electric vehicle charging infrastructure throughout the United States and western Canada. MYR Group's C&I services cater to differing projects, including airports, hospitals, data centers, stadiums, manufacturing plants, and various other commercial and industrial facilities. For this segment, MYR Group typically operates as a subcontractor to general contractors, though it also contracts directly with facility owners in some cases.
4. Construction and Maintenance Services
Construction and maintenance services companies not only boast technical know-how in specialized areas but also may hold special licenses and permits. Those who work in more regulated areas can enjoy more predictable revenue streams - for example, fire escapes need to be inspected every five years. More recently, services to address energy efficiency and labor availability are also creating incremental demand. But like the broader industrials sector, construction and maintenance services companies are at the whim of economic cycles as external factors like interest rates can greatly impact the new construction that drives incremental demand for these companies’ offerings.
Other companies in the electrical infrastructure industry include Quanta Services (NYSE:PWR), MasTec (NYSE:MTZ), and private company Pika.
5. Revenue Growth
A company’s long-term sales performance can indicate its overall quality. Even a bad business can shine for one or two quarters, but a top-tier one grows for years. Over the last five years, MYR Group grew its sales at a solid 10.2% compounded annual growth rate. Its growth beat the average industrials company and shows its offerings resonate with customers.
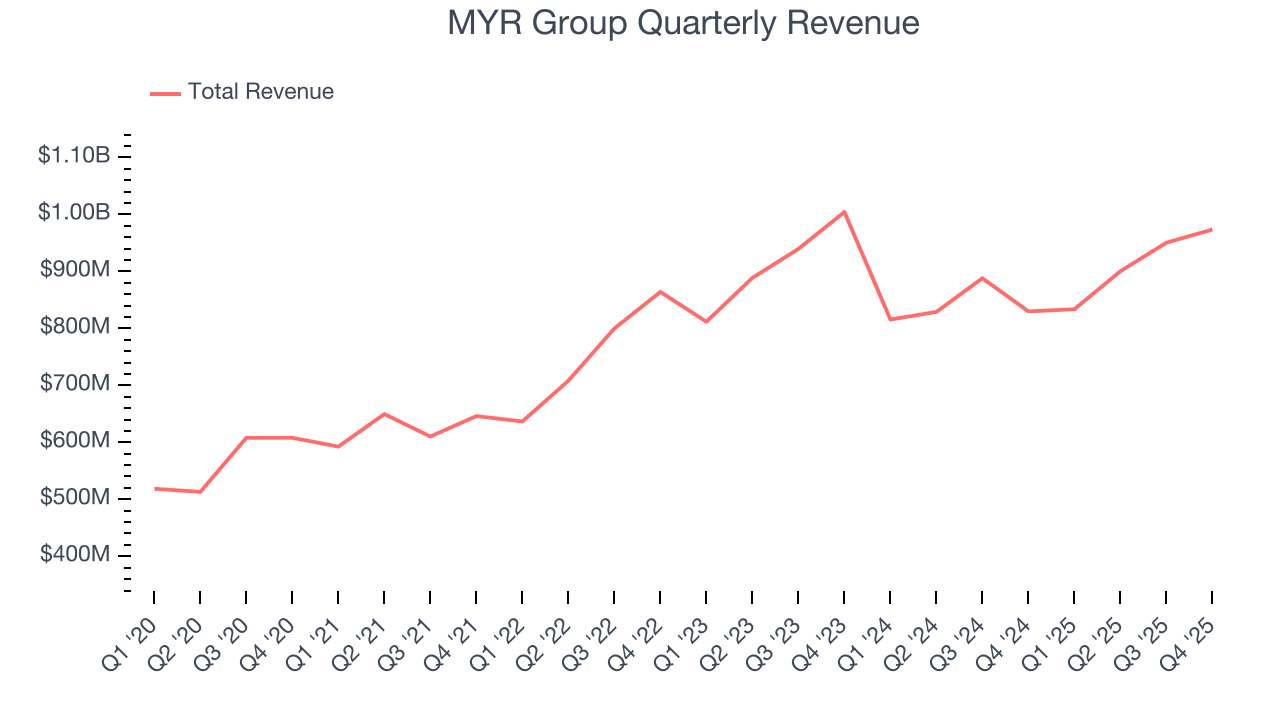
Long-term growth is the most important, but within industrials, a half-decade historical view may miss new industry trends or demand cycles. MYR Group’s recent performance shows its demand has slowed as its revenue was flat over the last two years. 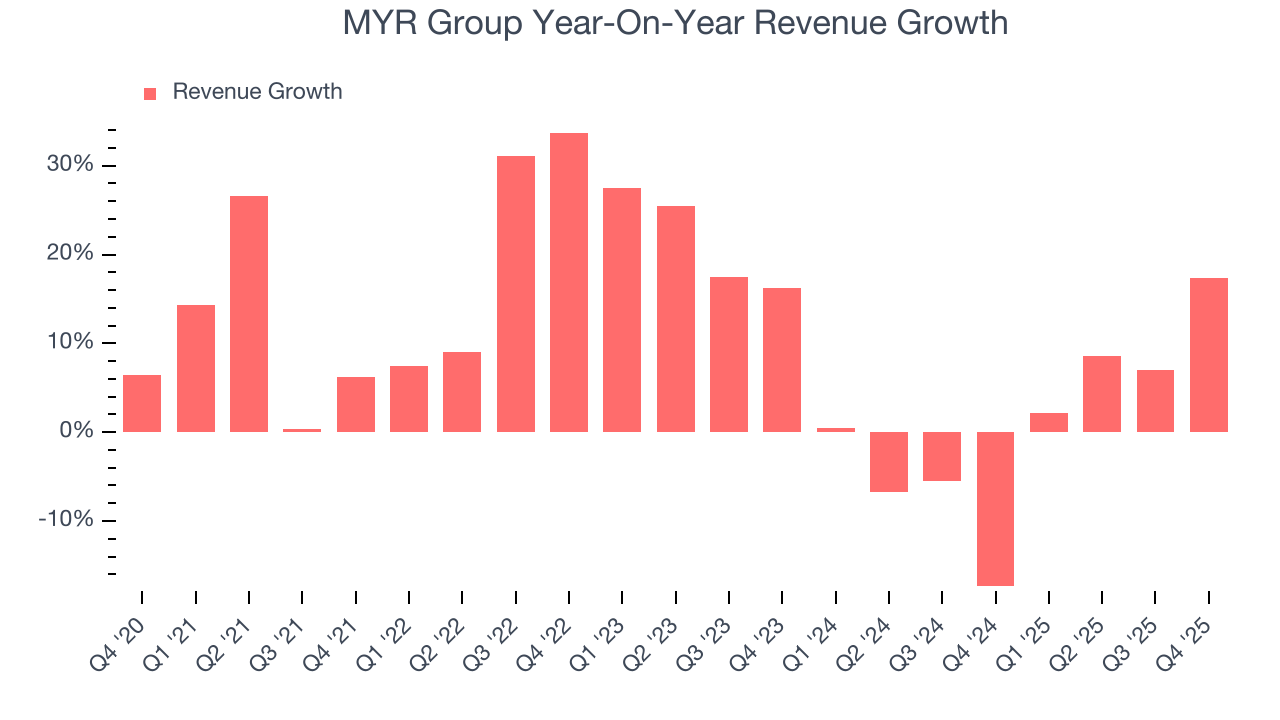
We can dig further into the company’s revenue dynamics by analyzing its backlog, or the value of its outstanding orders that have not yet been executed or delivered. MYR Group’s backlog reached $2.82 billion in the latest quarter and averaged 5.4% year-on-year growth over the last two years. Because this number is better than its revenue growth, we can see the company accumulated more orders than it could fulfill and deferred revenue to the future. This could imply elevated demand for MYR Group’s products and services but raises concerns about capacity constraints. 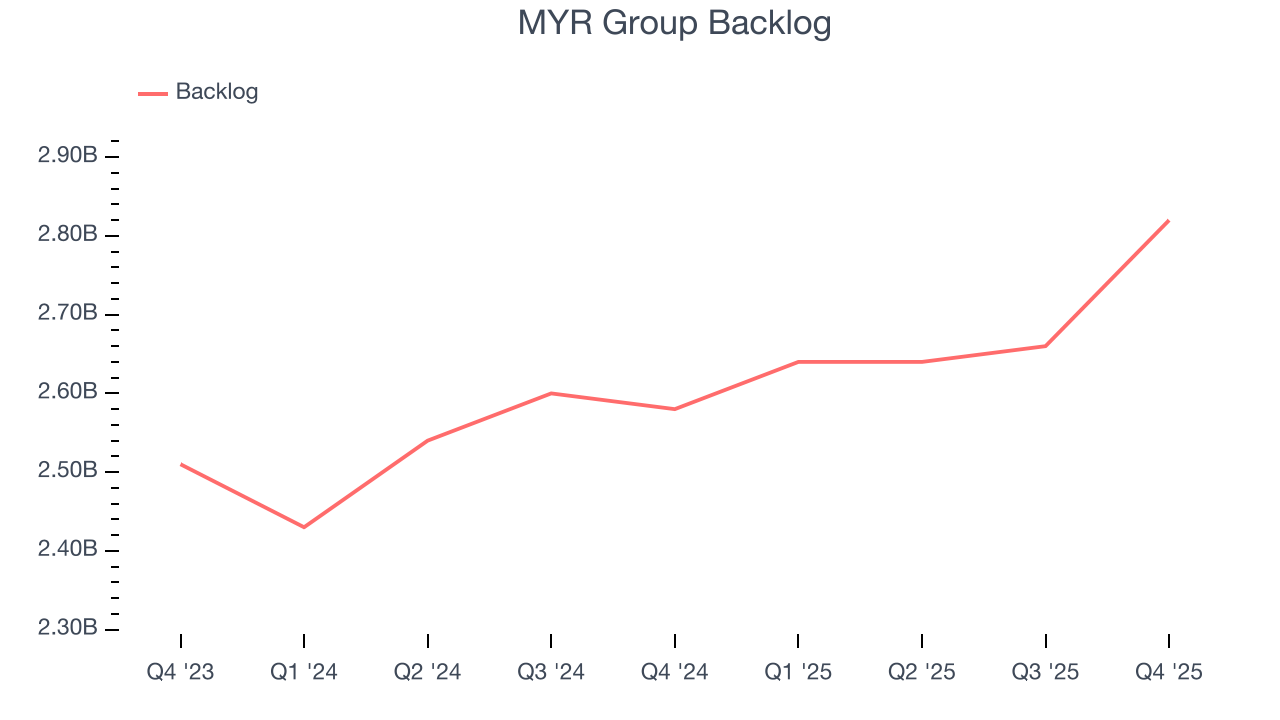
This quarter, MYR Group reported year-on-year revenue growth of 17.3%, and its $973.5 million of revenue exceeded Wall Street’s estimates by 8%.
Looking ahead, sell-side analysts expect revenue to grow 7.5% over the next 12 months, an improvement versus the last two years. This projection is above the sector average and suggests its newer products and services will spur better top-line performance.
6. Gross Margin & Pricing Power
Gross profit margin is a critical metric to track because it sheds light on its pricing power, complexity of products, and ability to procure raw materials, equipment, and labor.
MYR Group has bad unit economics for an industrials business, signaling it operates in a competitive market. As you can see below, it averaged a 10.8% gross margin over the last five years. Said differently, MYR Group had to pay a chunky $89.19 to its suppliers for every $100 in revenue. 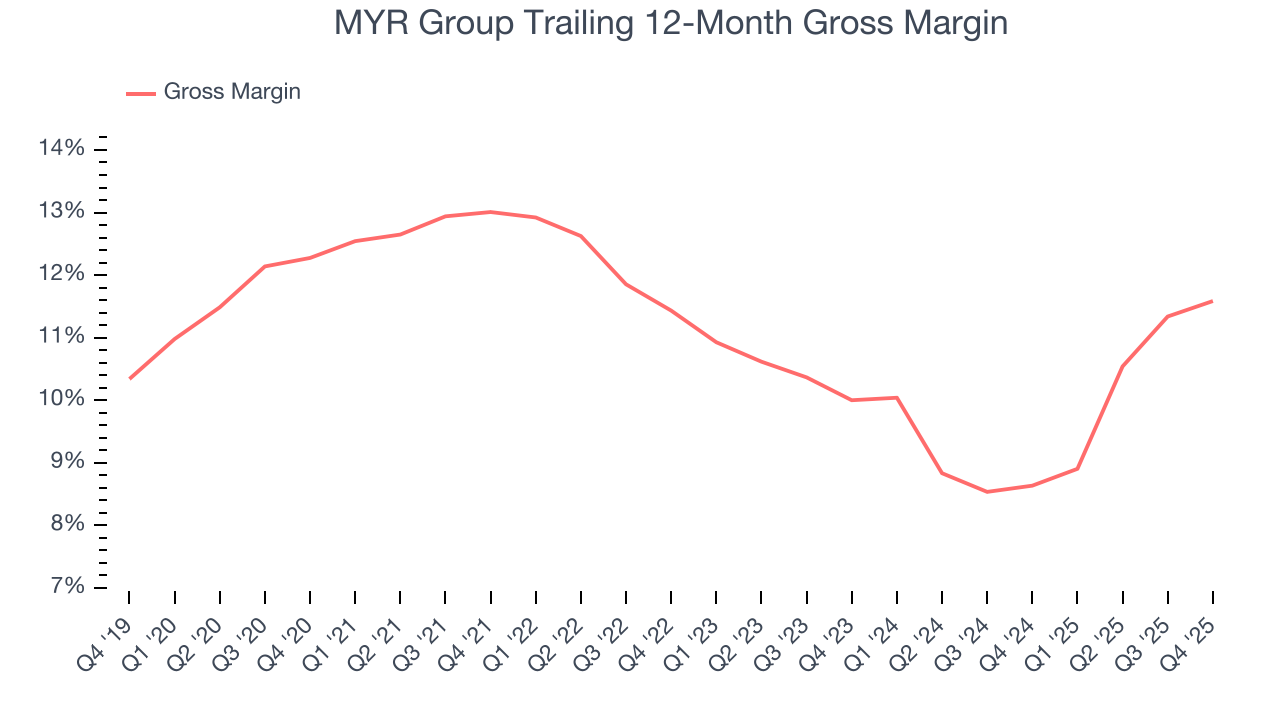
MYR Group’s gross profit margin came in at 11.4% this quarter, up 1.1 percentage points year on year. MYR Group’s full-year margin has also been trending up over the past 12 months, increasing by 3 percentage points. If this move continues, it could suggest better unit economics due to more leverage from its growing sales on the fixed portion of its cost of goods sold (such as manufacturing expenses).
7. Operating Margin
MYR Group’s operating margin has risen over the last 12 months and averaged 3.6% over the last five years. The company’s higher efficiency is a breath of fresh air, but its suboptimal cost structure means it still sports lousy profitability for an industrials business. This result isn’t too surprising given its low gross margin as a starting point.
Looking at the trend in its profitability, MYR Group’s operating margin might fluctuated slightly but has generally stayed the same over the last five years. This raises questions about the company’s expense base because its revenue growth should have given it leverage on its fixed costs, resulting in better economies of scale and profitability.
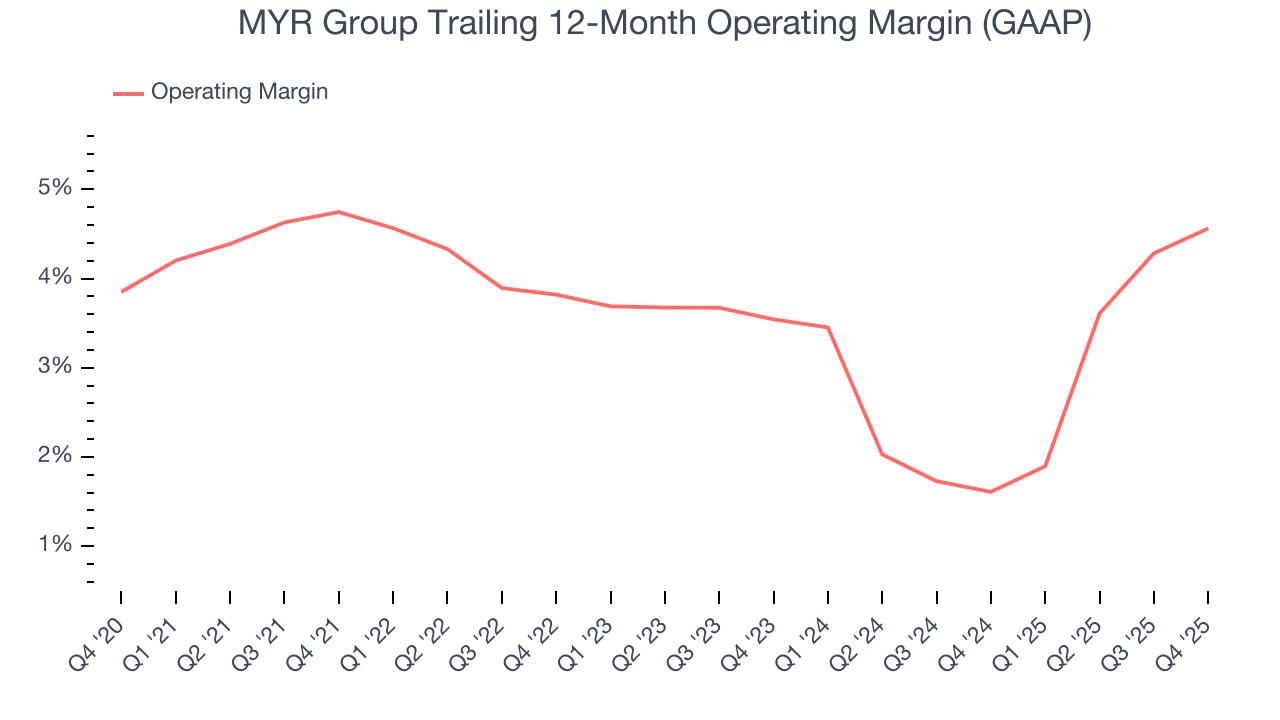
This quarter, MYR Group generated an operating margin profit margin of 4.8%, up 1.1 percentage points year on year. The increase was encouraging, and because its operating margin rose more than its gross margin, we can infer it was more efficient with expenses such as marketing, R&D, and administrative overhead.
8. Earnings Per Share
We track the long-term change in earnings per share (EPS) for the same reason as long-term revenue growth. Compared to revenue, however, EPS highlights whether a company’s growth is profitable.
MYR Group’s EPS grew at a spectacular 16.7% compounded annual growth rate over the last five years, higher than its 10.2% annualized revenue growth. However, this alone doesn’t tell us much about its business quality because its operating margin didn’t improve.
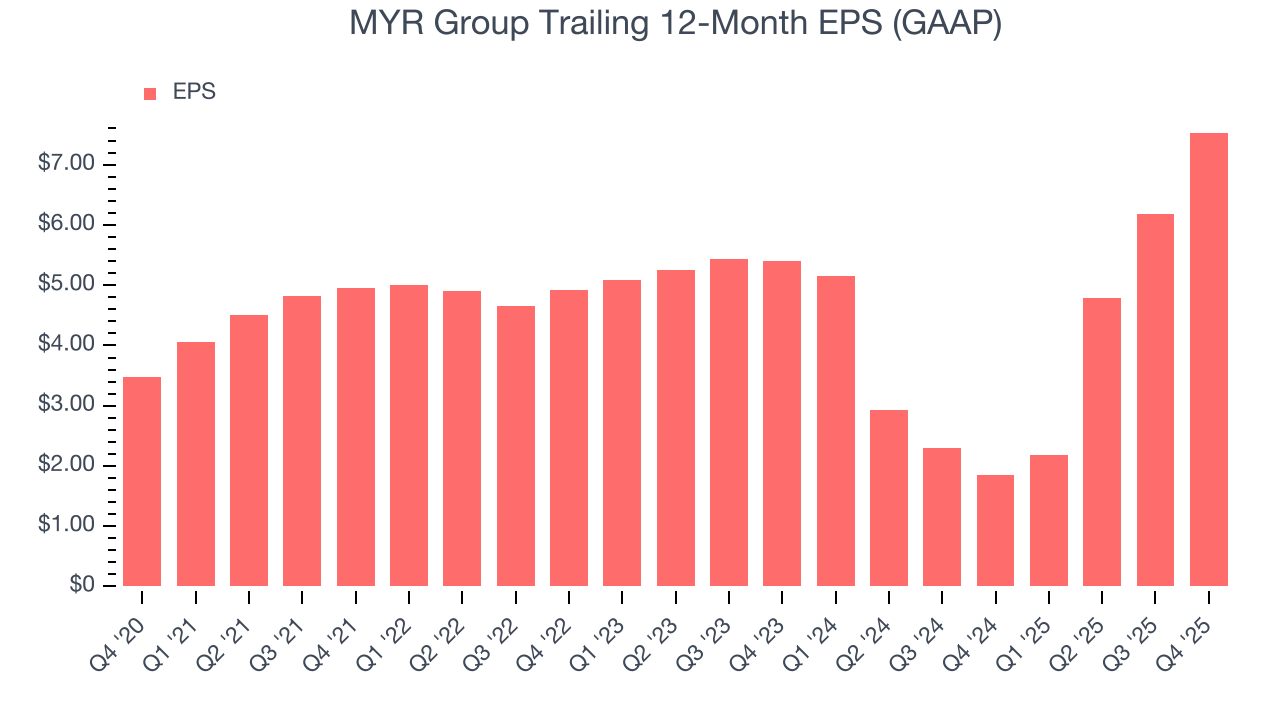
Diving into the nuances of MYR Group’s earnings can give us a better understanding of its performance. A five-year view shows that MYR Group has repurchased its stock, shrinking its share count by 8%. This tells us its EPS outperformed its revenue not because of increased operational efficiency but financial engineering, as buybacks boost per share earnings. 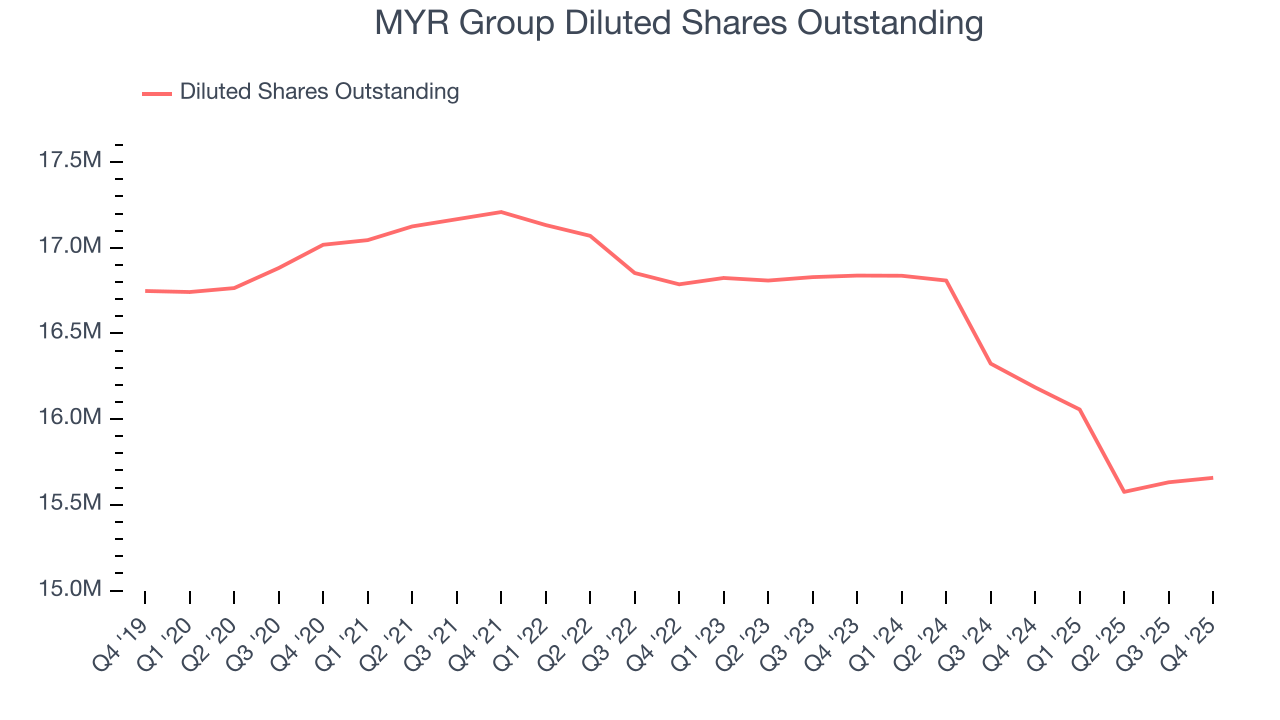
Like with revenue, we analyze EPS over a shorter period to see if we are missing a change in the business.
For MYR Group, its two-year annual EPS growth of 18% was higher than its five-year trend. We love it when earnings growth accelerates, especially when it accelerates off an already high base.
In Q4, MYR Group reported EPS of $2.33, up from $0.99 in the same quarter last year. This print easily cleared analysts’ estimates, and shareholders should be content with the results. Over the next 12 months, Wall Street expects MYR Group’s full-year EPS of $7.53 to grow 17.3%.
9. Cash Is King
Free cash flow isn't a prominently featured metric in company financials and earnings releases, but we think it's telling because it accounts for all operating and capital expenses, making it tough to manipulate. Cash is king.
MYR Group has shown poor cash profitability over the last five years, giving the company limited opportunities to return capital to shareholders. Its free cash flow margin averaged 2.5%, lousy for an industrials business.
Taking a step back, an encouraging sign is that MYR Group’s margin expanded by 3 percentage points during that time. The company’s improvement shows it’s heading in the right direction, and we can see it became a less capital-intensive business because its free cash flow profitability rose while its operating profitability was flat.
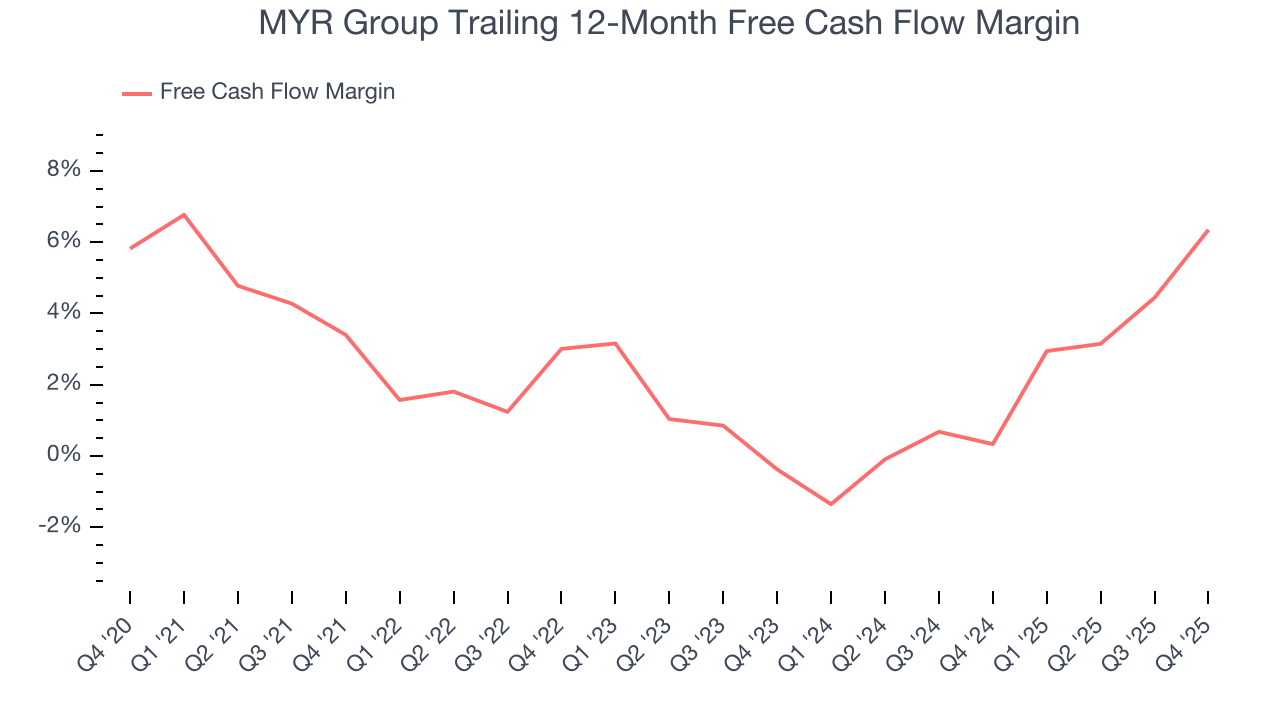
MYR Group’s free cash flow clocked in at $84.93 million in Q4, equivalent to a 8.7% margin. This result was good as its margin was 7.7 percentage points higher than in the same quarter last year, building on its favorable historical trend.
10. Return on Invested Capital (ROIC)
EPS and free cash flow tell us whether a company was profitable while growing its revenue. But was it capital-efficient? Enter ROIC, a metric showing how much operating profit a company generates relative to the money it has raised (debt and equity).
Although MYR Group hasn’t been the highest-quality company lately, it historically found a few growth initiatives that worked out well. Its five-year average ROIC was 15.1%, impressive for an industrials business.
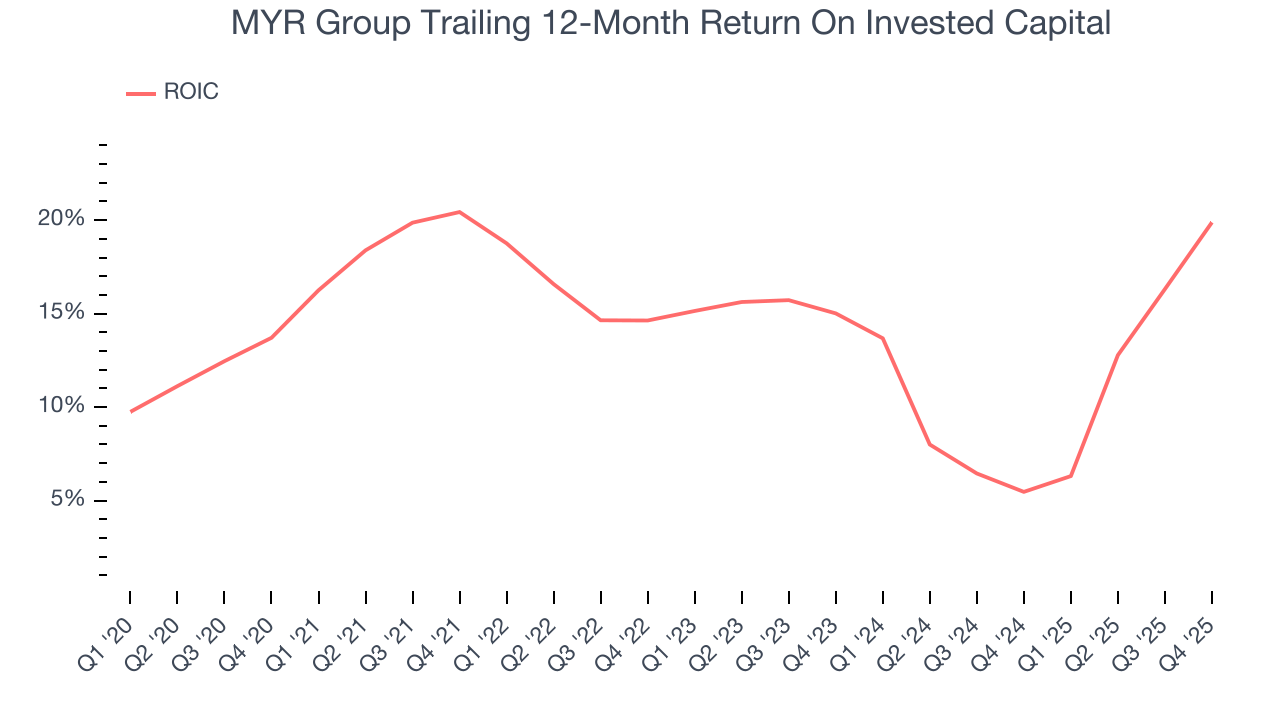
We like to invest in businesses with high returns, but the trend in a company’s ROIC is what often surprises the market and moves the stock price. Unfortunately, MYR Group’s ROIC averaged 4.9 percentage point decreases each year over the last few years. We like what management has done in the past, but its declining returns are perhaps a symptom of fewer profitable growth opportunities.
11. Balance Sheet Assessment
One of the best ways to mitigate bankruptcy risk is to hold more cash than debt.
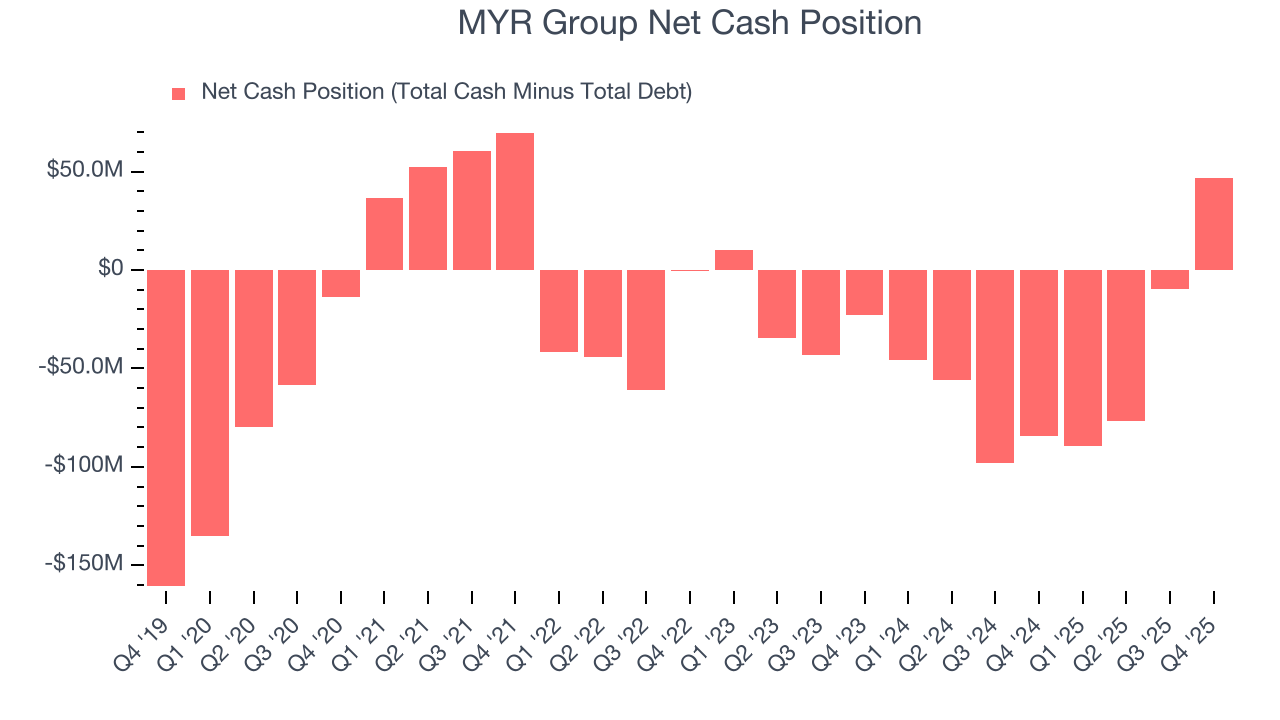
MYR Group is a profitable, well-capitalized company with $150.2 million of cash and $103.5 million of debt on its balance sheet. This $46.65 million net cash position gives it the freedom to borrow money, return capital to shareholders, or invest in growth initiatives. Leverage is not an issue here.
12. Key Takeaways from MYR Group’s Q4 Results
It was good to see MYR Group beat analysts’ EPS expectations this quarter. We were also excited its EBITDA outperformed Wall Street’s estimates by a wide margin. Zooming out, we think this quarter featured some important positives. The stock remained flat at $273.91 immediately after reporting.
13. Is Now The Time To Buy MYR Group?
Updated: March 23, 2026 at 11:08 PM EDT
Are you wondering whether to buy MYR Group or pass? We urge investors to not only consider the latest earnings results but also longer-term business quality and valuation as well.
MYR Group isn’t a bad business, but we’re not clamoring to buy it here and now. To begin with, its revenue growth was solid over the last five years, and analysts believe this will continue. And while MYR Group’s low gross margins indicate some combination of competitive pressures and high production costs, its projected EPS for the next year implies the company’s fundamentals will improve.
MYR Group’s P/E ratio based on the next 12 months is 28.2x. Beauty is in the eye of the beholder, but our analysis shows the upside isn’t great compared to the potential downside. We're pretty confident there are more exciting stocks to buy at the moment.
Wall Street analysts have a consensus one-year price target of $301.33 on the company (compared to the current share price of $270.82).