Olaplex (OLPX)
We aren’t fans of Olaplex. Not only is its demand weak but also its falling returns on capital suggest it’s becoming less profitable.― StockStory Analyst Team
1. News


2. Summary
Why We Think Olaplex Will Underperform
Rising to fame on TikTok because of its “bond building" hair products, Olaplex (NASDAQ:OLPX) offers products and treatments that repair the damage caused by traditional heat and chemical-based styling goods.
- Sales tumbled by 15.6% annually over the last three years, showing consumer trends are working against its favor
- Sales were less profitable over the last three years as its earnings per share fell by 49.7% annually, worse than its revenue declines
- A bright spot is that its products command premium prices and lead to a best-in-class gross margin of 71.6%


Olaplex’s quality isn’t great. You should search for better opportunities.
Why There Are Better Opportunities Than Olaplex


Olaplex is trading at $1.21 per share, or 14.1x forward P/E. Olaplex’s valuation may seem like a bargain, especially when stacked up against other consumer staples companies. We remind you that you often get what you pay for, though.
Cheap stocks can look like great bargains at first glance, but you often get what you pay for. These mediocre businesses often have less earnings power, meaning there is more reliance on a re-rating to generate good returns - an unlikely scenario for low-quality companies.
3. Olaplex (OLPX) Research Report: Q4 CY2025 Update
Hair care company Olaplex (NASDAQ:OLPX) reported revenue ahead of Wall Street’s expectations in Q4 CY2025, with sales up 4.3% year on year to $105.1 million. On the other hand, the company’s full-year revenue guidance of $424.5 million at the midpoint came in 1.6% below analysts’ estimates. Its non-GAAP profit of $0.01 per share was in line with analysts’ consensus estimates.
Olaplex (OLPX) Q4 CY2025 Highlights:
- Revenue: $105.1 million vs analyst estimates of $104 million (4.3% year-on-year growth, 1.1% beat)
- Adjusted EPS: $0.01 vs analyst estimates of $0.01 (in line)
- Adjusted EBITDA: $12.86 million vs analyst estimates of $9.62 million (12.2% margin, 33.7% beat)
- Operating Margin: -4.3%, down from 3% in the same quarter last year
- Market Capitalization: $1.19 billion
Company Overview
Rising to fame on TikTok because of its “bond building" hair products, Olaplex (NASDAQ:OLPX) offers products and treatments that repair the damage caused by traditional heat and chemical-based styling goods.
Specifically, the company was founded in 2014 and seeks to address the microscopic broken hair bonds that can occur over time when women repeatedly use hot curling products and chemical dyes. The broken bonds lead to dry, brittle hair that looks unhealthy.
Olaplex’s product portfolio is broad, but all products fall into three categories: treat, maintain, and protect. For example, the company’s Hair Perfector product is a treatment that reduces breakage and aims to strengthen hair. There are then shampoos to maintain the healthier hair that should result from Hair Perfector use and oils that protect hair throughout the day.
As a player in the prestige hair care space, Olaplex’s end customers are middle to higher-income women who aren’t afraid to spend some extra money on beauty and personal care products. These women also tend to be older individuals whose hair has undergone decades of heat and chemical treatments. Olaplex reaches these customers by selling direct-to-consumer through the company website, via specialty beauty stores, and to salon professionals who will ultimately use the products on customers.
4. Personal Care
While personal care products products may seem more discretionary than food, consumers tend to maintain or even boost their spending on the category during tough times. This phenomenon is known as "the lipstick effect" by economists, which states that consumers still want some semblance of affordable luxuries like beauty and wellness when the economy is sputtering. Consumer tastes are constantly changing, and personal care companies are currently responding to the public’s increased desire for ethically produced goods by featuring natural ingredients in their products.
Competitors in the hair care segment include Kerastase and Redken, both owned by L'Oréal (ENXTPA:OR), Bumble and bumble, owned by Estée Lauder (NYSE:EL), and private company Brazilian Bond Builder (b3).
5. Revenue Growth
A company’s long-term sales performance is one signal of its overall quality. Any business can have short-term success, but a top-tier one grows for years.
With $423 million in revenue over the past 12 months, Olaplex is a small consumer staples company, which sometimes brings disadvantages compared to larger competitors benefiting from economies of scale and negotiating leverage with retailers.
As you can see below, Olaplex’s demand was weak over the last three years. Its sales fell by 15.6% annually, a rough starting point for our analysis.
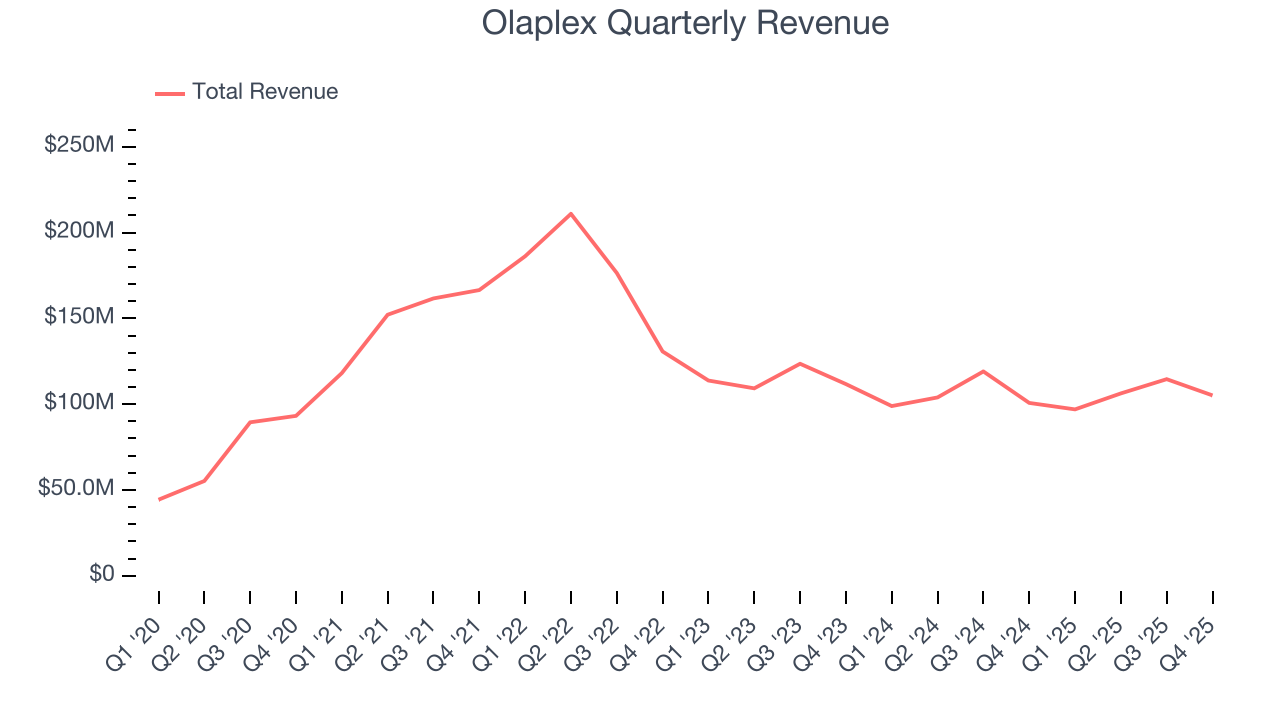
This quarter, Olaplex reported modest year-on-year revenue growth of 4.3% but beat Wall Street’s estimates by 1.1%.
Looking ahead, sell-side analysts expect revenue to grow 2.2% over the next 12 months. Although this projection indicates its newer products will catalyze better top-line performance, it is still below average for the sector.
6. Gross Margin & Pricing Power
Olaplex has best-in-class unit economics for a consumer staples company, enabling it to invest in areas such as marketing and talent to grow its brand. As you can see below, it averaged an elite 71.3% gross margin over the last two years. That means Olaplex only paid its suppliers $28.74 for every $100 in revenue. 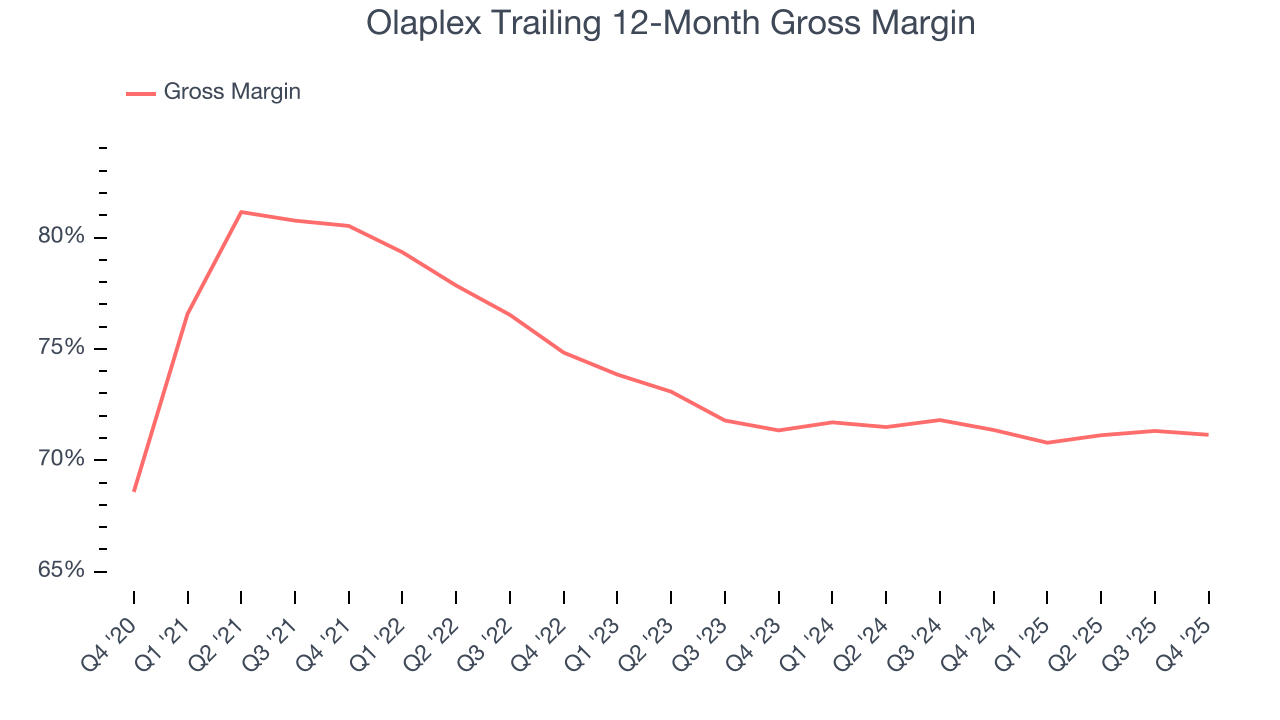
In Q4, Olaplex produced a 68% gross profit margin, in line with the same quarter last year. On a wider time horizon, the company’s full-year margin has remained steady over the past four quarters, suggesting its input costs (such as raw materials and manufacturing expenses) have been stable and it isn’t under pressure to lower prices.
7. Operating Margin
Operating margin is a key profitability metric because it accounts for all expenses enabling a business to operate smoothly, including marketing and advertising, IT systems, wages, and other administrative costs.
Olaplex has done a decent job managing its cost base over the last two years. The company has produced an average operating margin of 8.7%, higher than the broader consumer staples sector.
Looking at the trend in its profitability, Olaplex’s operating margin decreased by 14.2 percentage points over the last year. Even though its historical margin was healthy, shareholders will want to see Olaplex become more profitable in the future.
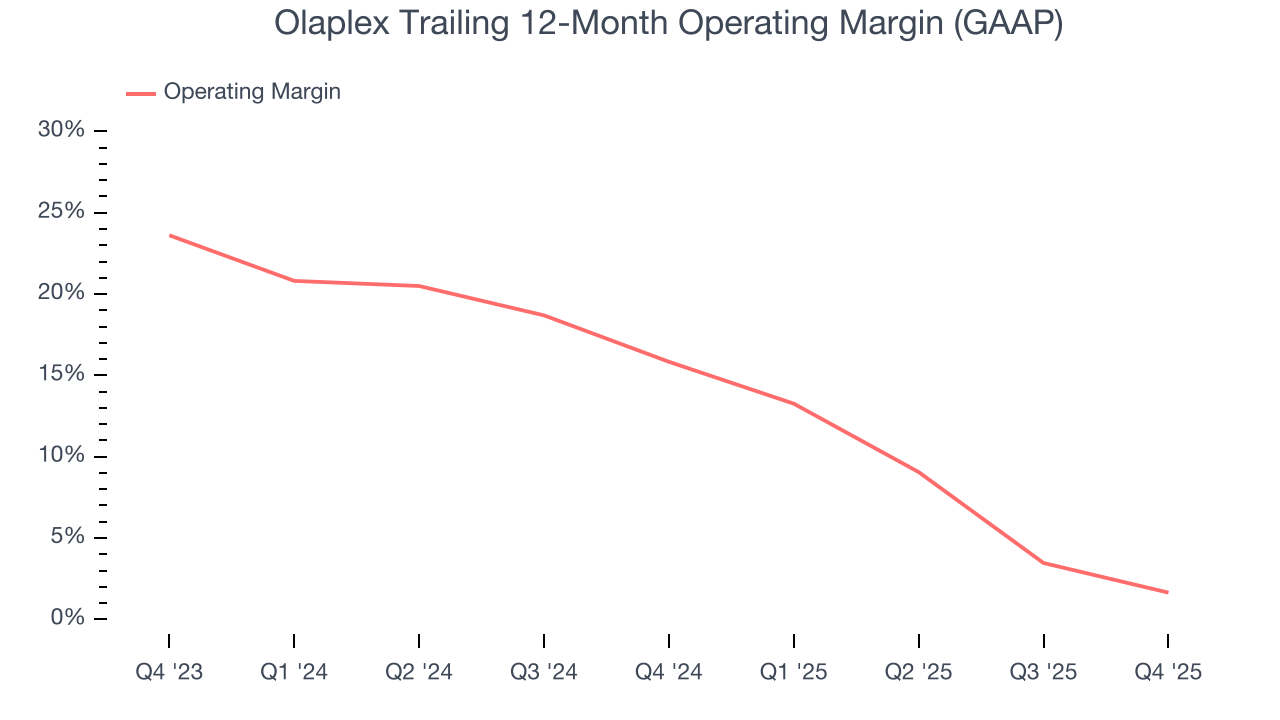
In Q4, Olaplex generated an operating margin profit margin of negative 4.3%, down 7.3 percentage points year on year. Since Olaplex’s operating margin decreased more than its gross margin, we can assume it was less efficient because expenses such as marketing, and administrative overhead increased.
8. Earnings Per Share
Revenue trends explain a company’s historical growth, but the long-term change in earnings per share (EPS) points to the profitability of that growth – for example, a company could inflate its sales through excessive spending on advertising and promotions.
Sadly for Olaplex, its EPS declined by 49.7% annually over the last three years, more than its revenue. This tells us the company struggled because its fixed cost base made it difficult to adjust to shrinking demand.
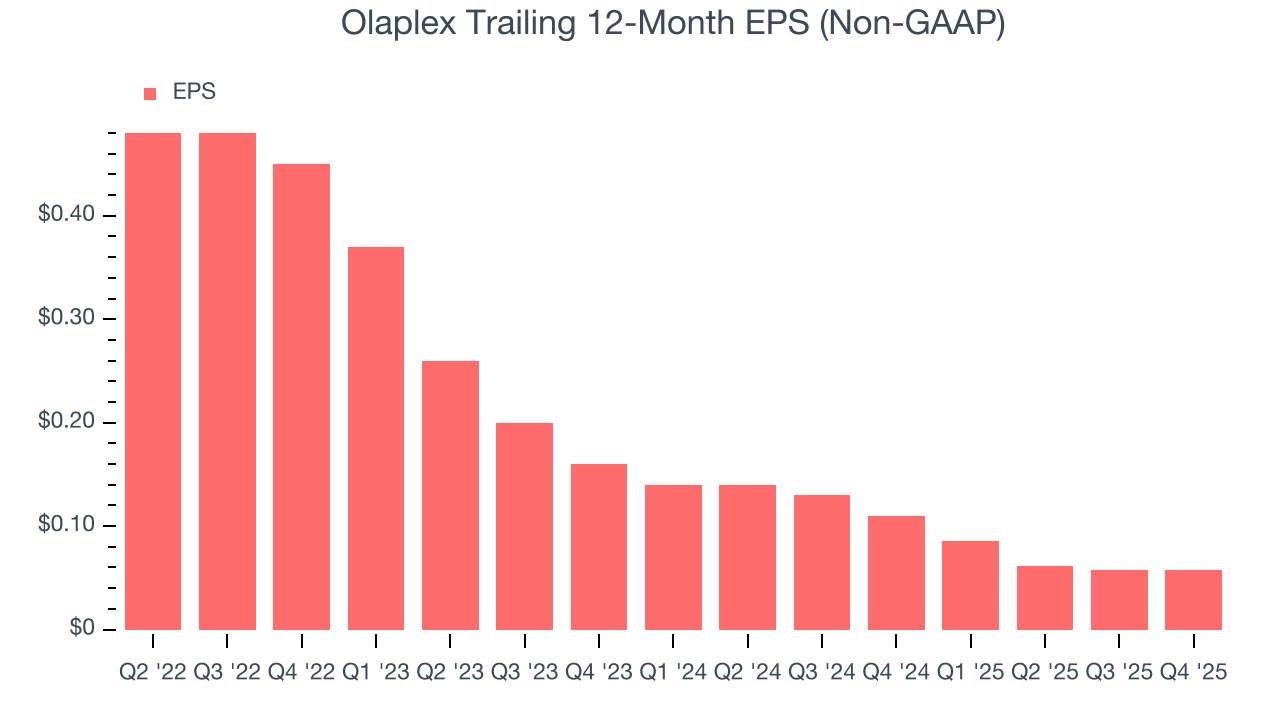
In Q4, Olaplex reported adjusted EPS of $0.01, in line with the same quarter last year. This print easily cleared analysts’ estimates, and shareholders should be content with the results. Over the next 12 months, Wall Street expects Olaplex’s full-year EPS of $0.06 to grow 61%.
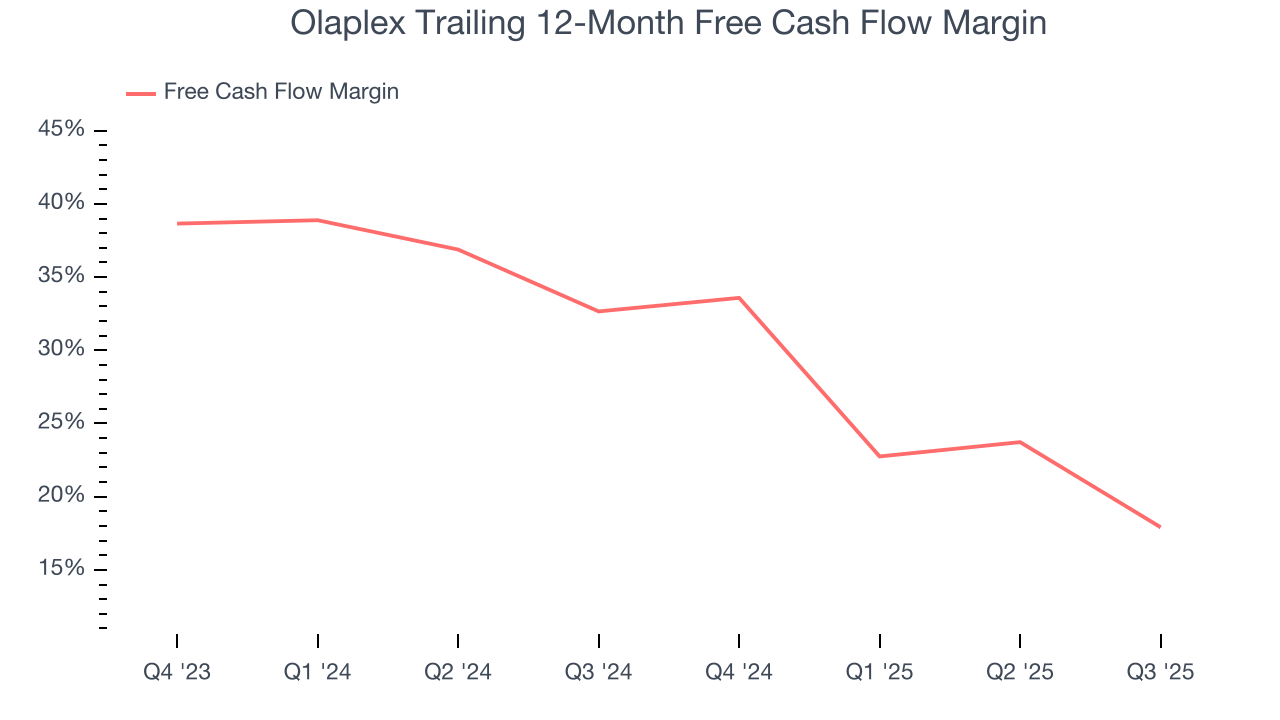
9. Cash Is King
Free cash flow isn't a prominently featured metric in company financials and earnings releases, but we think it's telling because it accounts for all operating and capital expenses, making it tough to manipulate. Cash is king.
Olaplex has shown terrific cash profitability, driven by its lucrative business model that enables it to reinvest, return capital to investors, and stay ahead of the competition. The company’s free cash flow margin was among the best in the consumer staples sector, averaging 22.6% over the last two years. Olaplex has shown terrific cash profitability relative to peers over the last two years, giving the company fewer opportunities to return capital to shareholders.
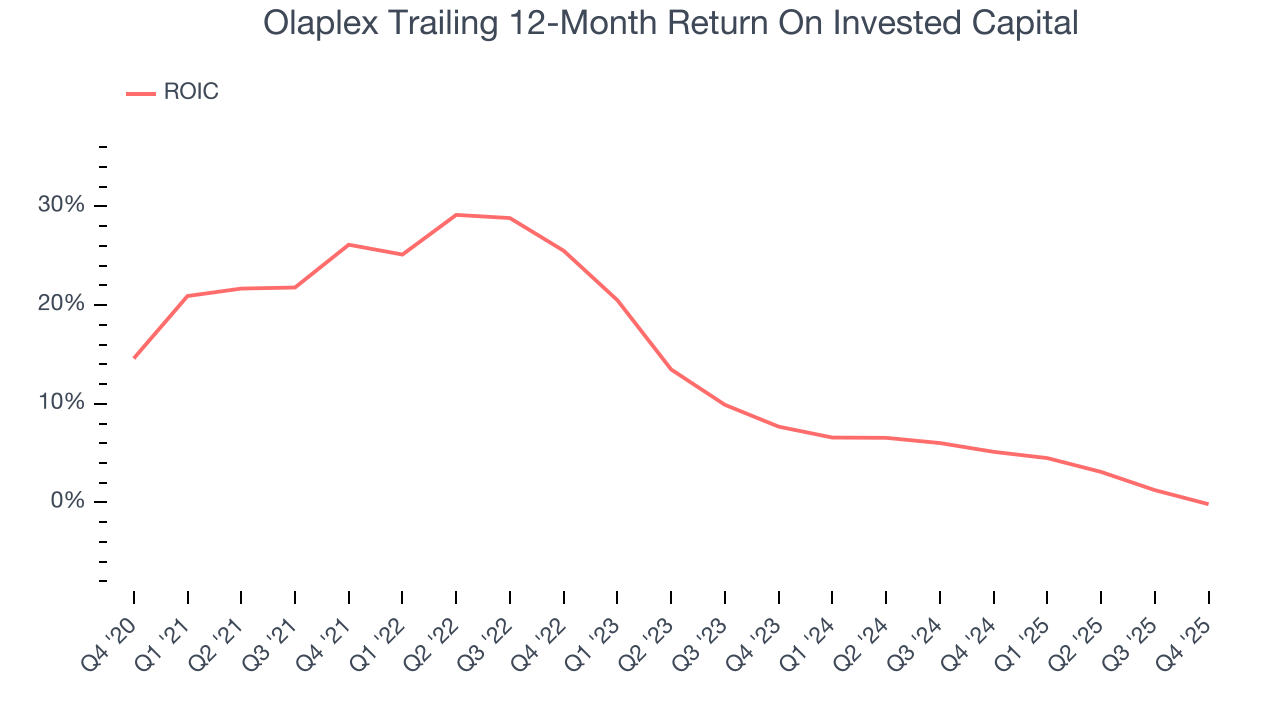
10. Return on Invested Capital (ROIC)
EPS and free cash flow tell us whether a company was profitable while growing its revenue. But was it capital-efficient? A company’s ROIC explains this by showing how much operating profit it makes compared to the money it has raised (debt and equity).
Olaplex’s management team makes decent investment decisions and generates value for shareholders. Its five-year average ROIC was 12.9%, slightly better than typical consumer staples business.
11. Balance Sheet Assessment
Olaplex reported $318.7 million of cash and $352.3 million of debt on its balance sheet in the most recent quarter. As investors in high-quality companies, we primarily focus on two things: 1) that a company’s debt level isn’t too high and 2) that its interest payments are not excessively burdening the business.
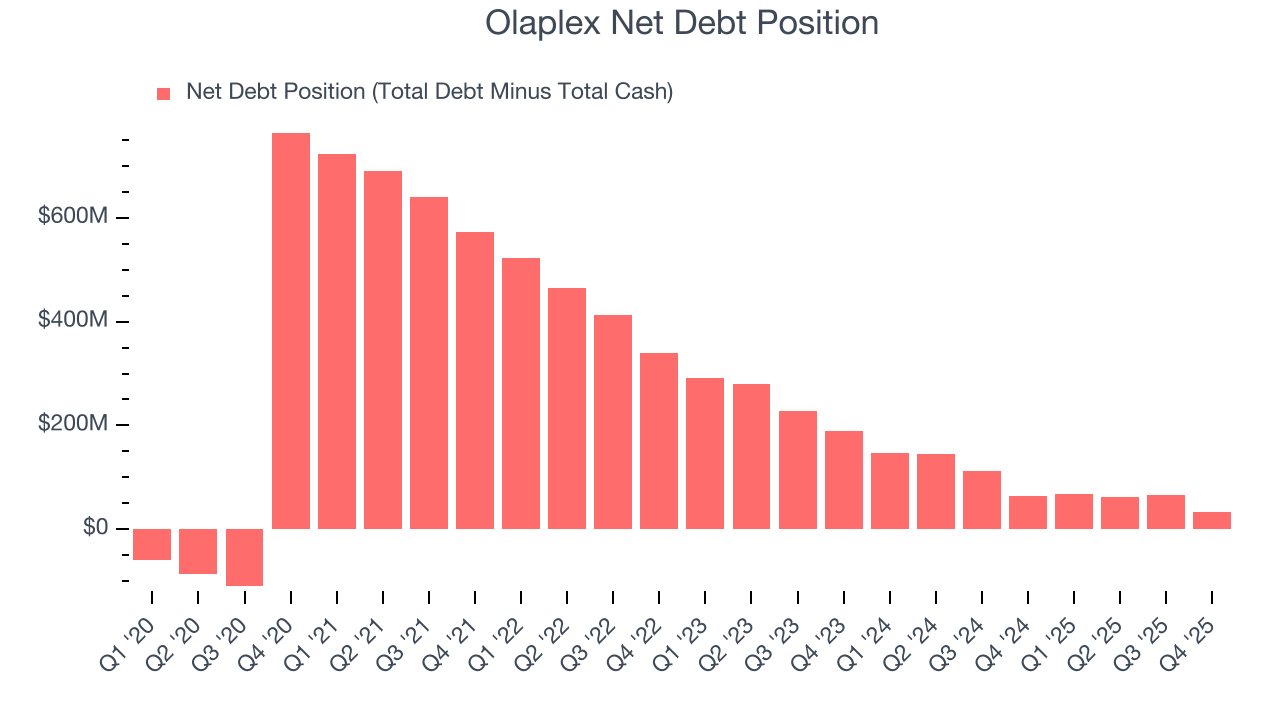
With $93.87 million of EBITDA over the last 12 months, we view Olaplex’s 0.4× net-debt-to-EBITDA ratio as safe. We also see its $16.73 million of annual interest expenses as appropriate. The company’s profits give it plenty of breathing room, allowing it to continue investing in growth initiatives.
12. Key Takeaways from Olaplex’s Q4 Results
We were impressed by how significantly Olaplex blew past analysts’ EBITDA expectations this quarter. We were also glad its EPS was in line with Wall Street’s estimates. On the other hand, its full-year revenue guidance missed. This outlook is weighing on shares. The market seemed to be hoping for more, and the stock traded down 6.7% to $1.66 immediately following the results.
13. Is Now The Time To Buy Olaplex?
Updated: March 14, 2026 at 10:44 PM EDT
The latest quarterly earnings matters, sure, but we actually think longer-term fundamentals and valuation matter more. Investors should consider all these pieces before deciding whether or not to invest in Olaplex.
Olaplex isn’t a terrible business, but it isn’t one of our picks. First off, its revenue has declined over the last three years. While its admirable gross margins are a wonderful starting point for the overall profitability of the business, the downside is its cash profitability fell over the last year. On top of that, its declining operating margin shows the business has become less efficient.
Olaplex’s P/E ratio based on the next 12 months is 14.1x. While this valuation is fair, the upside isn’t great compared to the potential downside. We're fairly confident there are better stocks to buy right now.
Wall Street analysts have a consensus one-year price target of $1.85 on the company (compared to the current share price of $1.21).
Although the price target is bullish, readers should exercise caution because analysts tend to be overly optimistic. The firms they work for, often big banks, have relationships with companies that extend into fundraising, M&A advisory, and other rewarding business lines. As a result, they typically hesitate to say bad things for fear they will lose out. We at StockStory do not suffer from such conflicts of interest, so we’ll always tell it like it is.