
Powell (POWL)
Powell is in a league of its own. Its marriage of growth and profitability makes it a financial powerhouse with attractive upside.― StockStory Analyst Team
1. News


2. Summary
Why We Like Powell
Originally a metal-working shop supporting local petrochemical facilities, Powell (NYSE:POWL) has grown from a small Houston manufacturer to a global provider of electrical systems.
- Impressive 17.8% annual revenue growth over the last five years indicates it’s winning market share this cycle
- Performance over the past five years shows its incremental sales were extremely profitable, as its annual earnings per share growth of 67.7% outpaced its revenue gains
- Robust free cash flow profile gives it the flexibility to invest in growth initiatives or return capital to shareholders, and its recently improved profitability means it has even more resources to invest or distribute


We’re fond of companies like Powell. The valuation looks fair in light of its quality, and we believe now is a prudent time to invest.
Why Is Now The Time To Buy Powell?


Powell’s stock price of $524.51 implies a valuation ratio of 30.8x forward P/E. Most companies in the industrials sector may feature a cheaper multiple, but we think Powell is priced fairly given its fundamentals.
Entry price may seem important in the moment, but our work shows that time and again, long-term market outperformance is determined by business quality rather than getting an absolute bargain on a stock.
3. Powell (POWL) Research Report: Q4 CY2025 Update
Electrical energy control systems manufacturer Powell (NYSE:POWL) fell short of the markets revenue expectations in Q4 CY2025 as sales rose 4% year on year to $251.2 million. Its GAAP profit of $3.40 per share was 16.6% above analysts’ consensus estimates.
Powell (POWL) Q4 CY2025 Highlights:
- Revenue: $251.2 million vs analyst estimates of $256.5 million (4% year-on-year growth, 2.1% miss)
- EPS (GAAP): $3.40 vs analyst estimates of $2.92 (16.6% beat)
- Adjusted EBITDA: $44.92 million vs analyst estimates of $42.86 million (17.9% margin, 4.8% beat)
- Operating Margin: 17%, up from 14.7% in the same quarter last year
- Backlog: $1.6 billion at quarter end, up 23.1% year on year
- Market Capitalization: $5.35 billion
Company Overview
Originally a metal-working shop supporting local petrochemical facilities, Powell (NYSE:POWL) has grown from a small Houston manufacturer to a global provider of electrical systems.
The company has evolved through mergers and acquisitions, such as in 2009, when it acquired PowerComm and its subsidiaries, significantly boosting its presence in Canada's oil and gas sector.
Today, Powell serves a diverse range of industries including transportation, environmental, energy, industrial, and utility sectors. The company operates through two main business segments: Electrical Power Products and Process Control Systems.
The Electrical Power Products segment, which generates the majority of the company's revenue, focuses on designing and manufacturing custom electrical power distribution and control systems. These systems are engineered to distribute, monitor, and control electrical energy flow while providing protection to various electrically powered equipment. Powell's product lineup includes power control room substation packages, distribution switchgear, medium-voltage circuit breakers, monitoring and control communications systems, and bus duct systems. These products are designed for application voltages ranging from 480 volts to over 38,000 volts and are utilized in various heavy industrial markets.
Powell's Process Control Systems segment specializes in custom engineered-to-order technology solutions for managing critical transportation, environmental, and energy management processes and facilities. The segment's proprietary DYNAC® software suite serves as an integrated operations management solution for these vital operations, handling everything from traffic flow in transportation management to water quality in environmental treatment and electrical power status in substation automation.
Powell's customers are primarily large industrial users of electrical energy, including oil and gas producers, refineries, and utilities. The company markets directly to end-users and through engineering, procurement, and construction (EPC) firms.
4. Electrical Systems
Like many equipment and component manufacturers, electrical systems companies are buoyed by secular trends such as connectivity and industrial automation. More specific pockets of strong demand include Internet of Things (IoT) connectivity and the 5G telecom upgrade cycle, which can benefit companies whose cables and conduits fit those needs. But like the broader industrials sector, these companies are also at the whim of economic cycles. Interest rates, for example, can greatly impact projects that drive demand for these products.
Competitors of Powell (NYSE:POWL) include Eaton Corporation (NYSE:ETN), Schneider Electric SE (OTC:SBGSY), and ABB Ltd (NYSE:ABB).
5. Revenue Growth
A company’s long-term performance is an indicator of its overall quality. Any business can put up a good quarter or two, but many enduring ones grow for years. Luckily, Powell’s sales grew at an incredible 17.8% compounded annual growth rate over the last five years. Its growth surpassed the average industrials company and shows its offerings resonate with customers, a great starting point for our analysis.
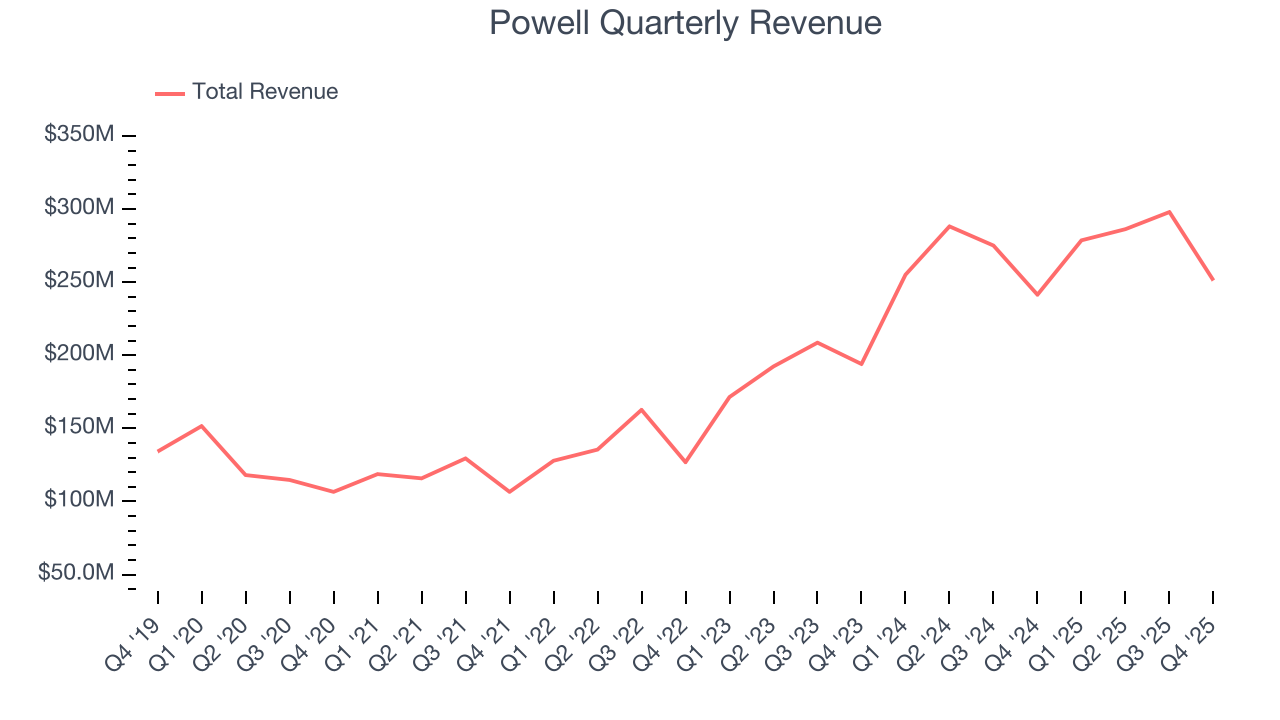
We at StockStory place the most emphasis on long-term growth, but within industrials, a half-decade historical view may miss cycles, industry trends, or a company capitalizing on catalysts such as a new contract win or a successful product line. Powell’s annualized revenue growth of 20.6% over the last two years is above its five-year trend, suggesting its demand was strong and recently accelerated. 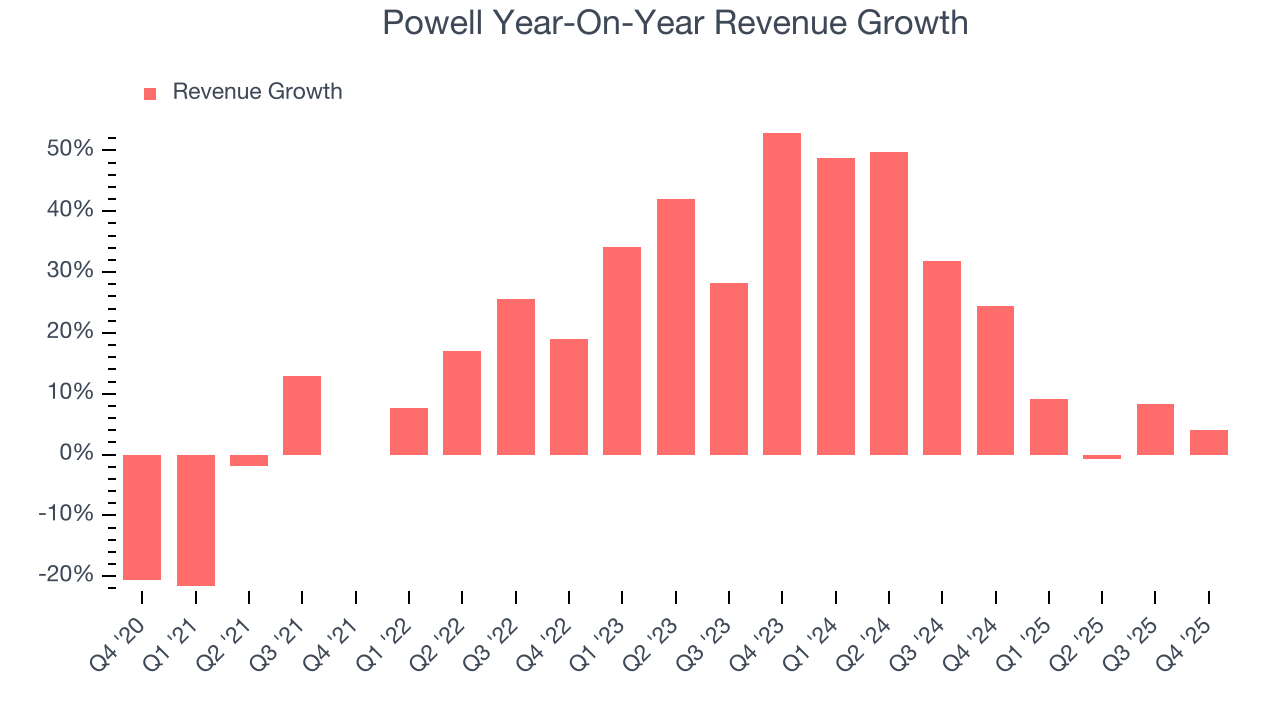
We can better understand the company’s revenue dynamics by analyzing its backlog, or the value of its outstanding orders that have not yet been executed or delivered. Powell’s backlog reached $1.6 billion in the latest quarter and averaged 15.4% year-on-year growth over the last two years. Because this number is lower than its revenue growth, we can see the company fulfilled orders at a faster rate than it added new orders to the backlog. This implies Powell was operating efficiently but raises questions about the health of its sales pipeline. 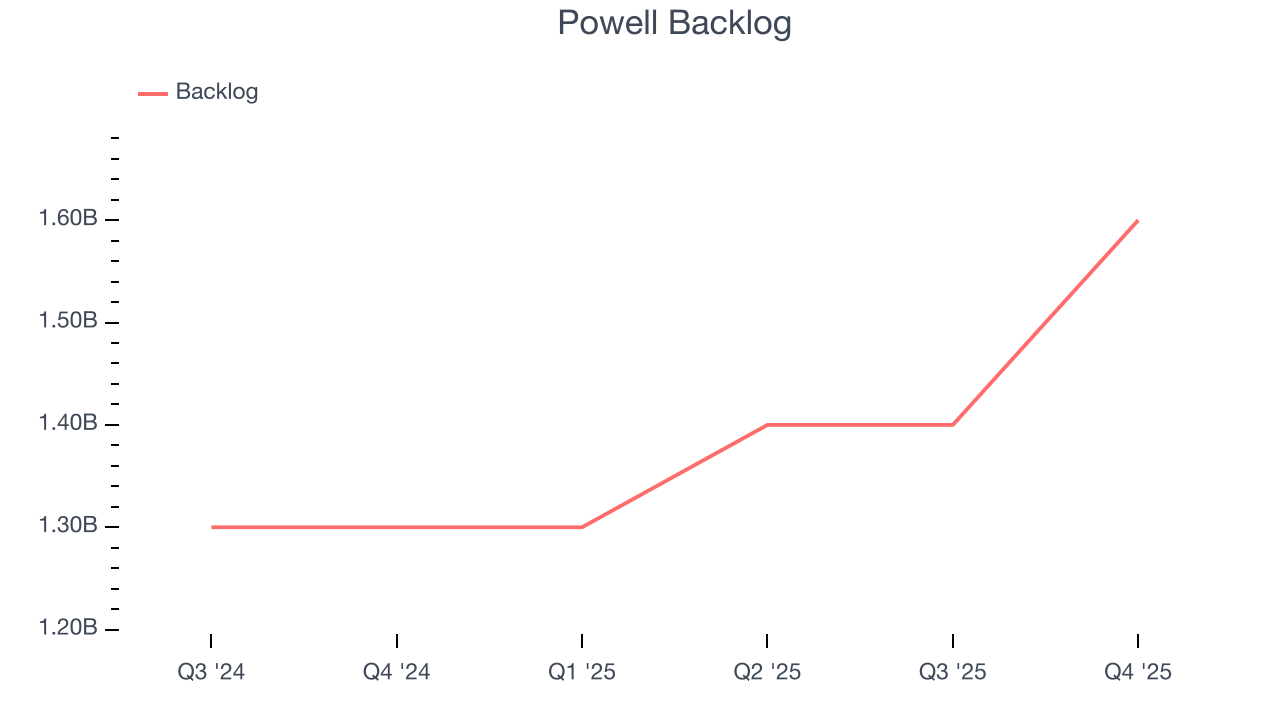
This quarter, Powell’s revenue grew by 4% year on year to $251.2 million, falling short of Wall Street’s estimates.
Looking ahead, sell-side analysts expect revenue to grow 7.8% over the next 12 months, a deceleration versus the last two years. Despite the slowdown, this projection is above average for the sector and indicates the market sees some success for its newer products and services.
6. Gross Margin & Pricing Power
Powell has bad unit economics for an industrials company, giving it less room to reinvest and develop new offerings. As you can see below, it averaged a 24.2% gross margin over the last five years. Said differently, Powell had to pay a chunky $75.82 to its suppliers for every $100 in revenue. 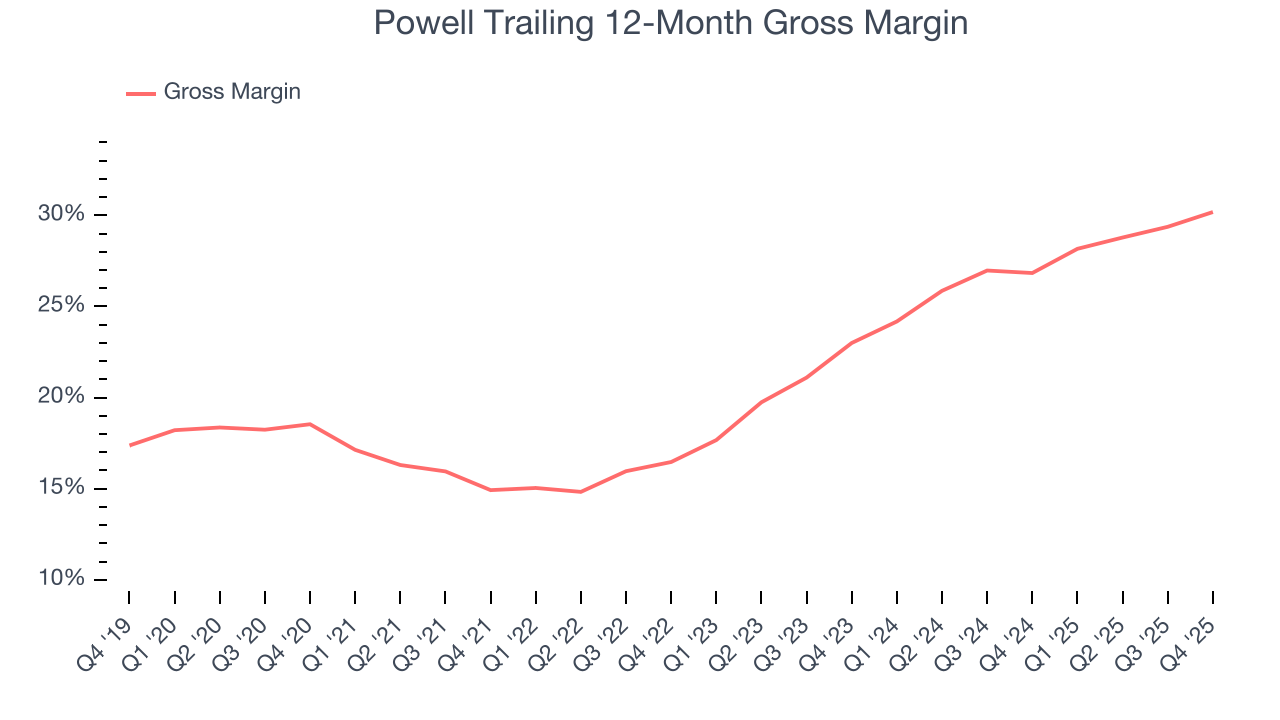
Powell’s gross profit margin came in at 28.4% this quarter, up 3.8 percentage points year on year. Powell’s full-year margin has also been trending up over the past 12 months, increasing by 3.3 percentage points. If this move continues, it could suggest better unit economics due to more leverage from its growing sales on the fixed portion of its cost of goods sold (such as manufacturing expenses).
7. Operating Margin
Operating margin is an important measure of profitability as it shows the portion of revenue left after accounting for all core expenses – everything from the cost of goods sold to advertising and wages. It’s also useful for comparing profitability across companies with different levels of debt and tax rates because it excludes interest and taxes.
Powell has been an efficient company over the last five years. It was one of the more profitable businesses in the industrials sector, boasting an average operating margin of 12.9%. This result was particularly impressive because of its low gross margin, which is mostly a factor of what it sells and takes huge shifts to move meaningfully. Companies have more control over their operating margins, and it’s a show of well-managed operations if they’re high when gross margins are low.
Looking at the trend in its profitability, Powell’s operating margin rose by 20.8 percentage points over the last five years, as its sales growth gave it immense operating leverage.
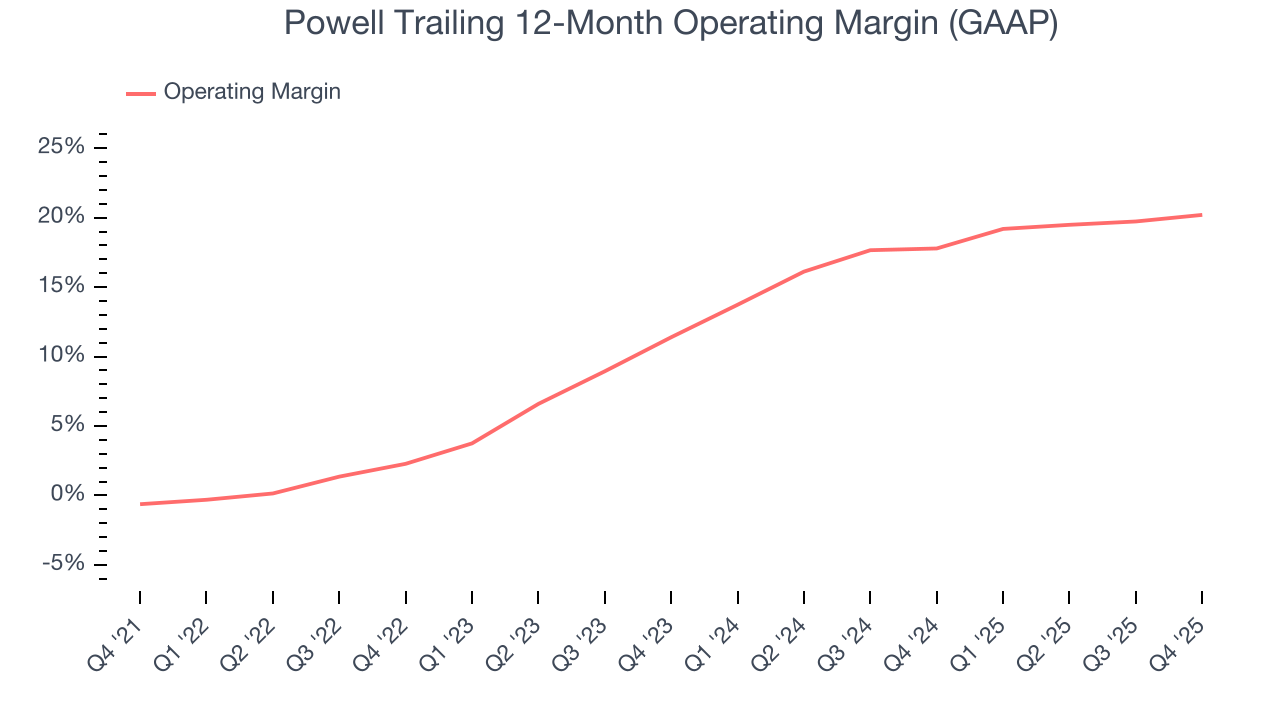
In Q4, Powell generated an operating margin profit margin of 17%, up 2.3 percentage points year on year. Since its gross margin expanded more than its operating margin, we can infer that leverage on its cost of sales was the primary driver behind the recently higher efficiency.
8. Earnings Per Share
We track the long-term change in earnings per share (EPS) for the same reason as long-term revenue growth. Compared to revenue, however, EPS highlights whether a company’s growth is profitable.
Powell’s EPS grew at an astounding 67.7% compounded annual growth rate over the last five years, higher than its 17.8% annualized revenue growth. This tells us the company became more profitable on a per-share basis as it expanded.
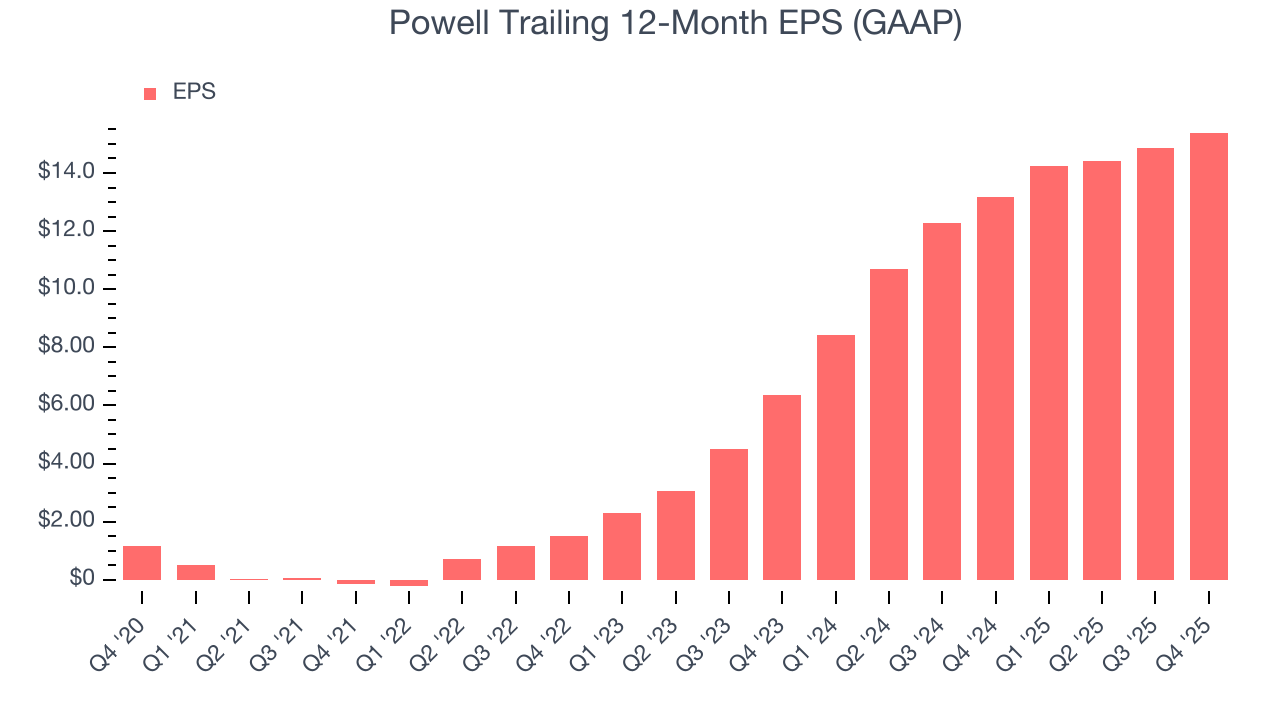
We can take a deeper look into Powell’s earnings to better understand the drivers of its performance. As we mentioned earlier, Powell’s operating margin expanded by 20.8 percentage points over the last five years. This was the most relevant factor (aside from the revenue impact) behind its higher earnings; interest expenses and taxes can also affect EPS but don’t tell us as much about a company’s fundamentals.
Like with revenue, we analyze EPS over a shorter period to see if we are missing a change in the business.
For Powell, its two-year annual EPS growth of 55.4% was lower than its five-year trend. We still think its growth was good and hope it can accelerate in the future.
In Q4, Powell reported EPS of $3.40, up from $2.86 in the same quarter last year. This print easily cleared analysts’ estimates, and shareholders should be content with the results. Over the next 12 months, Wall Street expects Powell’s full-year EPS of $15.39 to grow 3.8%.
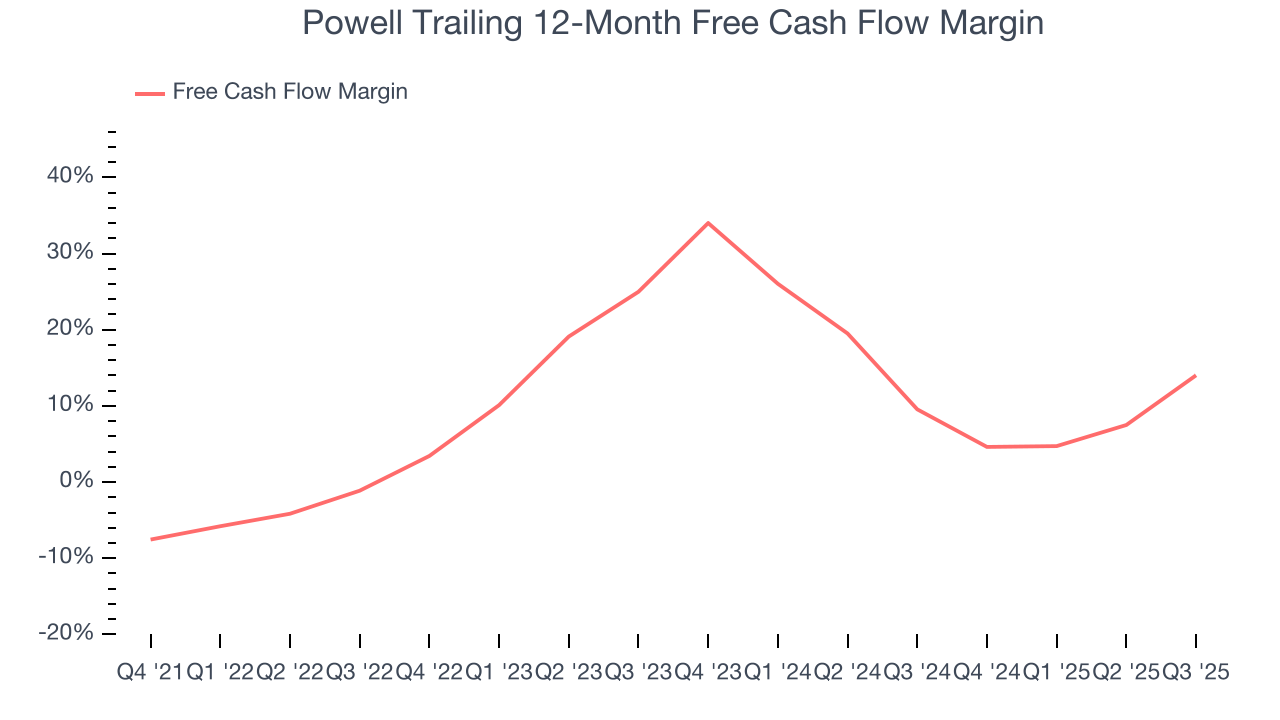
9. Cash Is King
Free cash flow isn't a prominently featured metric in company financials and earnings releases, but we think it's telling because it accounts for all operating and capital expenses, making it tough to manipulate. Cash is king.
Powell has shown robust cash profitability, enabling it to comfortably ride out cyclical downturns while investing in plenty of new offerings and returning capital to investors. The company’s free cash flow margin averaged 11.1% over the last five years, quite impressive for an industrials business.
Taking a step back, we can see that Powell’s margin expanded by 15.9 percentage points during that time. This is encouraging because it gives the company more optionality.
10. Balance Sheet Assessment
One of the best ways to mitigate bankruptcy risk is to hold more cash than debt.
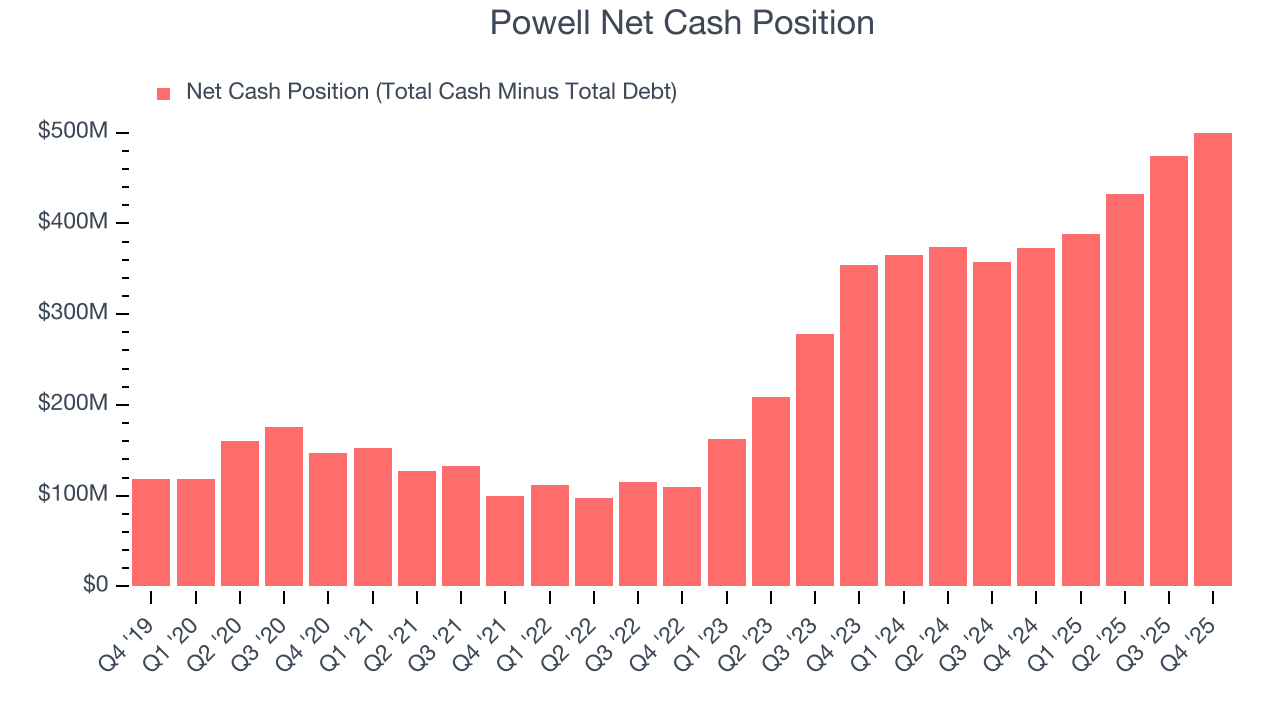
Powell is a profitable, well-capitalized company with $500.8 million of cash and $796,000 of debt on its balance sheet. This $500 million net cash position is 7.6% of its market cap and gives it the freedom to borrow money, return capital to shareholders, or invest in growth initiatives. Leverage is not an issue here.
11. Key Takeaways from Powell’s Q4 Results
It was good to see Powell beat analysts’ EPS expectations this quarter. We were also glad its EBITDA outperformed Wall Street’s estimates. On the other hand, its revenue missed. Overall, this print had some key positives. The stock remained flat at $453.50 immediately following the results.
12. Is Now The Time To Buy Powell?
Updated: March 22, 2026 at 11:28 PM EDT
Before making an investment decision, investors should account for Powell’s business fundamentals and valuation in addition to what happened in the latest quarter.
There is a lot to like about Powell. For starters, its revenue growth was exceptional over the last five years. And while its gross margins are lower than its industrials peers, its rising cash profitability gives it more optionality. Additionally, Powell’s expanding operating margin shows the business has become more efficient.
Powell’s P/E ratio based on the next 12 months is 30.8x. Looking across the spectrum of industrials businesses, Powell’s fundamentals clearly illustrate it’s a special business. We like the stock at this price.
Wall Street analysts have a consensus one-year price target of $517.67 on the company (compared to the current share price of $524.51).