
Pilgrim's Pride (PPC)
Pilgrim's Pride is in for a bumpy ride. Its weak revenue growth and gross margin show it not only lacks demand but also decent unit economics.― StockStory Analyst Team
1. News
2. Summary
Why We Think Pilgrim's Pride Will Underperform
Offering everything from pre-marinated to frozen chicken, Pilgrim’s Pride (NASDAQ:PPC) produces, processes, and distributes chicken products to retailers and food service customers.
- Easily substituted products (and therefore stiff competition) result in an inferior gross margin of 12.8% that must be offset through higher volumes
- The company has faced growth challenges as its 1.9% annual revenue increases over the last three years fell short of other consumer staples companies
- Demand will likely fall over the next 12 months as Wall Street expects flat revenue


Pilgrim's Pride’s quality is insufficient. There are superior stocks for sale in the market.
Why There Are Better Opportunities Than Pilgrim's Pride


At $36.18 per share, Pilgrim's Pride trades at 8.7x forward P/E. Pilgrim's Pride’s valuation may seem like a bargain, but we think there are valid reasons why it’s so cheap.
Cheap stocks can look like a great deal at first glance, but they can be value traps. They often have less earnings power, meaning there is more reliance on a re-rating to generate good returns - an unlikely scenario for low-quality companies.
3. Pilgrim's Pride (PPC) Research Report: Q4 CY2025 Update
Chicken producer Pilgrim’s Pride (NASDAQ:PPC) reported revenue ahead of Wall Street’s expectations in Q4 CY2025, with sales up 3.3% year on year to $4.52 billion. Its non-GAAP profit of $0.68 per share was 9.9% below analysts’ consensus estimates.
Pilgrim's Pride (PPC) Q4 CY2025 Highlights:
- Revenue: $4.52 billion vs analyst estimates of $4.40 billion (3.3% year-on-year growth, 2.8% beat)
- Adjusted EPS: $0.68 vs analyst expectations of $0.76 (9.9% miss)
- Adjusted EBITDA: $415.1 million vs analyst estimates of $396.8 million (9.2% margin, 4.6% beat)
- Operating Margin: 4.5%, down from 7% in the same quarter last year
- Free Cash Flow Margin: 0.5%, down from 4.3% in the same quarter last year
- Market Capitalization: $10.16 billion
Company Overview
Offering everything from pre-marinated to frozen chicken, Pilgrim’s Pride (NASDAQ:PPC) produces, processes, and distributes chicken products to retailers and food service customers.
The company was founded in 1946 when Aubrey Pilgrim and Pat Johns started a feed store and, later, a chicken farm in Pittsburg, Texas. Throughout its history, Pilgrim’s Pride has grown organically as well as through acquisitions, a key tool in its international expansion. For example, the company acquired Moy Park, a leading European poultry producer, in 2017.
Pilgrim’s Pride goes to market through numerous brands including Pilgrim’s, Just BARE, Gold’n Pump, Gold Kist, County Pride, and Pierce Chicken. The company sells its products to the retail market, which is primarily through grocery stores, and the food service channel, which includes restaurants and food processors. In the retail channel, Pilgrim’s Pride enjoys widespread distribution and advantaged shelf placement.
The end consumer who buys Pilgrim’s Pride products is typically someone who is in charge of groceries for the household. This consumer is seeking reliable protein brands at reasonable prices. At the same time, chicken doesn’t command the same brand loyalty as coffee or breakfast cereal, for example, so the availability of products at a shopper’s local grocery store is key. Said differently, consumers are unlikely to shop elsewhere because a store doesn’t carry a brand of chicken.
4. Perishable Food
The perishable food industry is diverse, encompassing large-scale producers and distributors to specialty and artisanal brands. These companies sell produce, dairy products, meats, and baked goods and have become integral to serving modern American consumers who prioritize freshness, quality, and nutritional value. Investing in perishable food stocks presents both opportunities and challenges. While the perishable nature of products can introduce risks related to supply chain management and shelf life, it also creates a constant demand driven by the necessity for fresh food. Companies that can efficiently manage inventory, distribution, and quality control are well-positioned to thrive in this competitive market. Navigating the perishable food industry requires adherence to strict food safety standards, regulations, and labeling requirements.
Competitors in the chicken market include Tyson Foods (NYSE:TSN) and private companies Perdue Farms, Sanderson Farms, and Koch Foods.
5. Revenue Growth
A company’s long-term sales performance can indicate its overall quality. Even a bad business can shine for one or two quarters, but a top-tier one grows for years.
With $18.5 billion in revenue over the past 12 months, Pilgrim's Pride is larger than most consumer staples companies and benefits from economies of scale, enabling it to gain more leverage on its fixed costs than smaller competitors. Its size also gives it negotiating leverage with distributors, allowing its products to reach more shelves. However, its scale is a double-edged sword because there are only a finite number of major retail partners, placing a ceiling on its growth. To expand meaningfully, Pilgrim's Pride likely needs to tweak its prices, innovate with new products, or enter new markets.
As you can see below, Pilgrim's Pride’s 1.9% annualized revenue growth over the last three years was sluggish. This shows it failed to generate demand in any major way and is a rough starting point for our analysis.
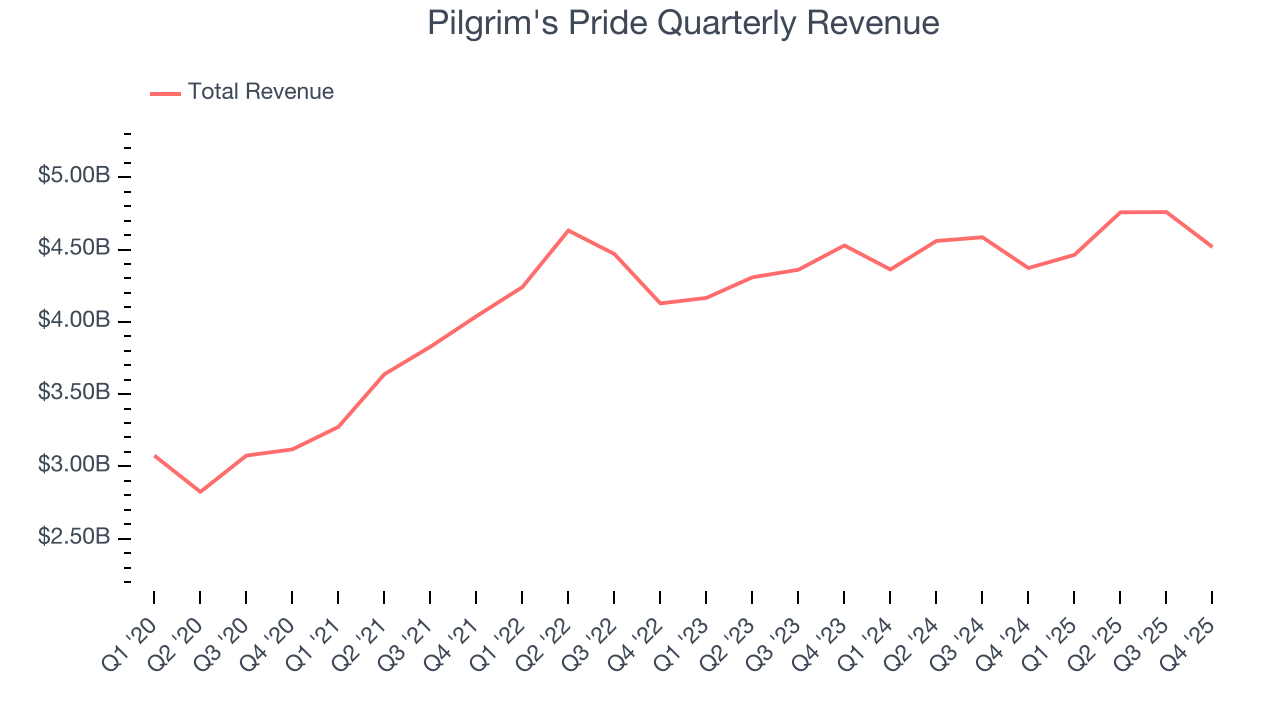
This quarter, Pilgrim's Pride reported modest year-on-year revenue growth of 3.3% but beat Wall Street’s estimates by 2.8%.
Looking ahead, sell-side analysts expect revenue to remain flat over the next 12 months, a slight deceleration versus the last three years. This projection doesn't excite us and suggests its products will see some demand headwinds.
6. Gross Margin & Pricing Power
At StockStory, we prefer high gross margin businesses because they indicate pricing power or differentiated products, giving the company a chance to generate higher operating profits.
Pilgrim's Pride has bad unit economics for a consumer staples company, signaling it operates in a competitive market and lacks pricing power because its products can be substituted. As you can see below, it averaged a 12.8% gross margin over the last two years. That means Pilgrim's Pride paid its suppliers a lot of money ($87.16 for every $100 in revenue) to run its business. 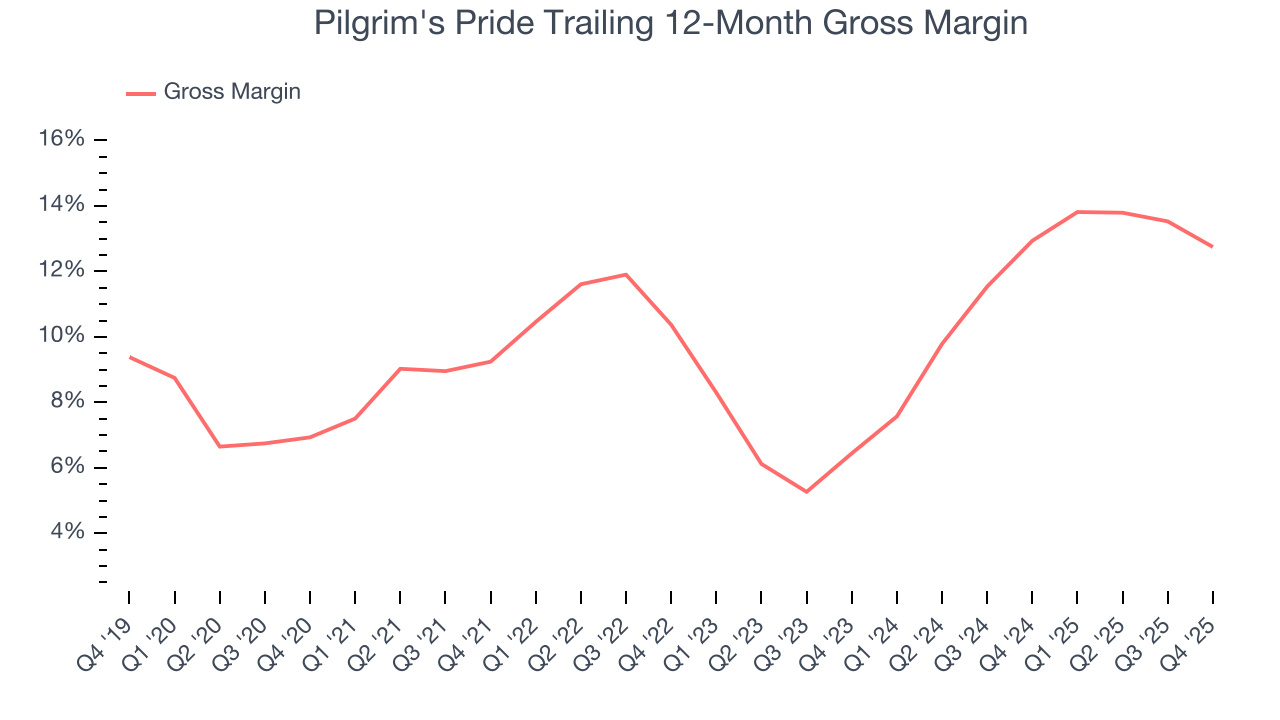
This quarter, Pilgrim's Pride’s gross profit margin was 9.5% , marking a 3.2 percentage point decrease from 12.7% in the same quarter last year. On a wider time horizon, the company’s full-year margin has remained steady over the past four quarters, suggesting its input costs (such as raw materials and manufacturing expenses) have been stable and it isn’t under pressure to lower prices.
7. Operating Margin
Operating margin is an important measure of profitability as it shows the portion of revenue left after accounting for all core expenses – everything from the cost of goods sold to advertising and wages. It’s also useful for comparing profitability across companies with different levels of debt and tax rates because it excludes interest and taxes.
Pilgrim's Pride’s operating margin might fluctuated slightly over the last 12 months but has generally stayed the same, averaging 8.6% over the last two years. This profitability was higher than the broader consumer staples sector, showing it did a decent job managing its expenses.
Looking at the trend in its profitability, Pilgrim's Pride’s operating margin might fluctuated slightly but has generally stayed the same over the last year. This raises questions about the company’s expense base because its revenue growth should have given it leverage on its fixed costs, resulting in better economies of scale and profitability.
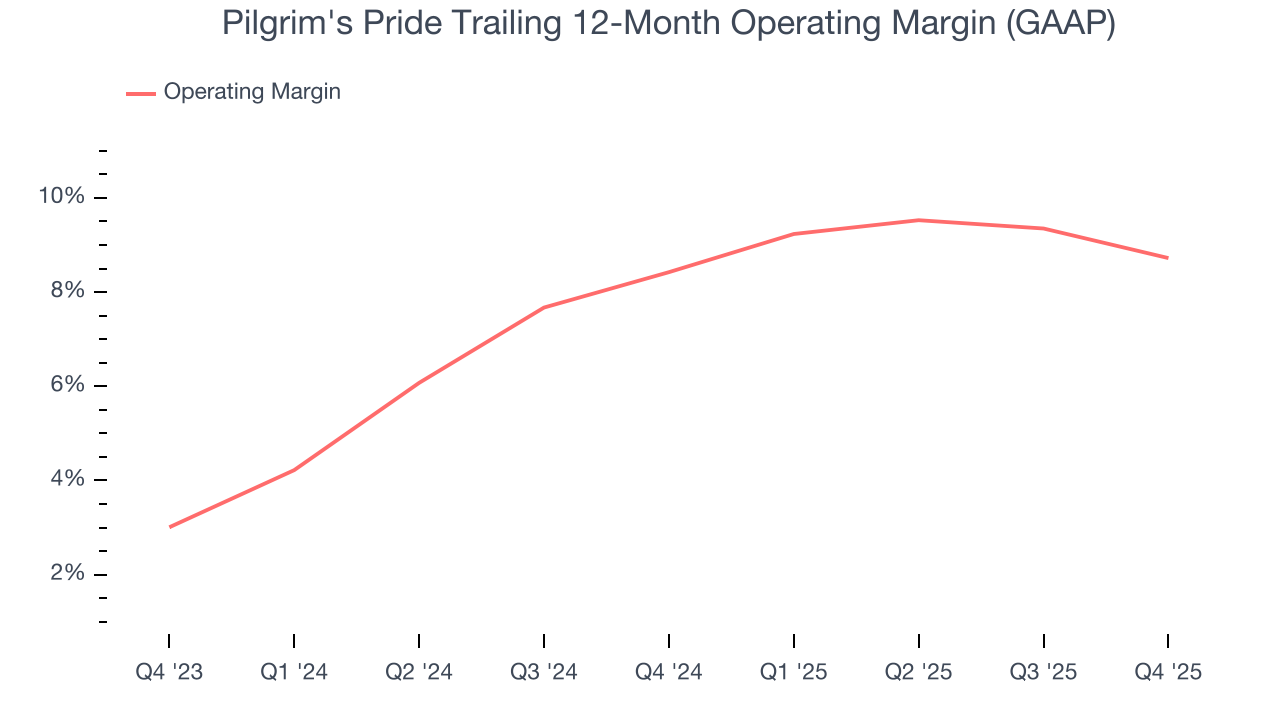
In Q4, Pilgrim's Pride generated an operating margin profit margin of 4.5%, down 2.5 percentage points year on year. Since Pilgrim's Pride’s gross margin decreased more than its operating margin, we can assume its recent inefficiencies were driven more by weaker leverage on its cost of sales rather than increased marketing, and administrative overhead expenses.
8. Earnings Per Share
Revenue trends explain a company’s historical growth, but the long-term change in earnings per share (EPS) points to the profitability of that growth – for example, a company could inflate its sales through excessive spending on advertising and promotions.
Pilgrim's Pride’s EPS grew at a remarkable 16.2% compounded annual growth rate over the last three years, higher than its 1.9% annualized revenue growth. This tells us the company became more profitable on a per-share basis as it expanded.
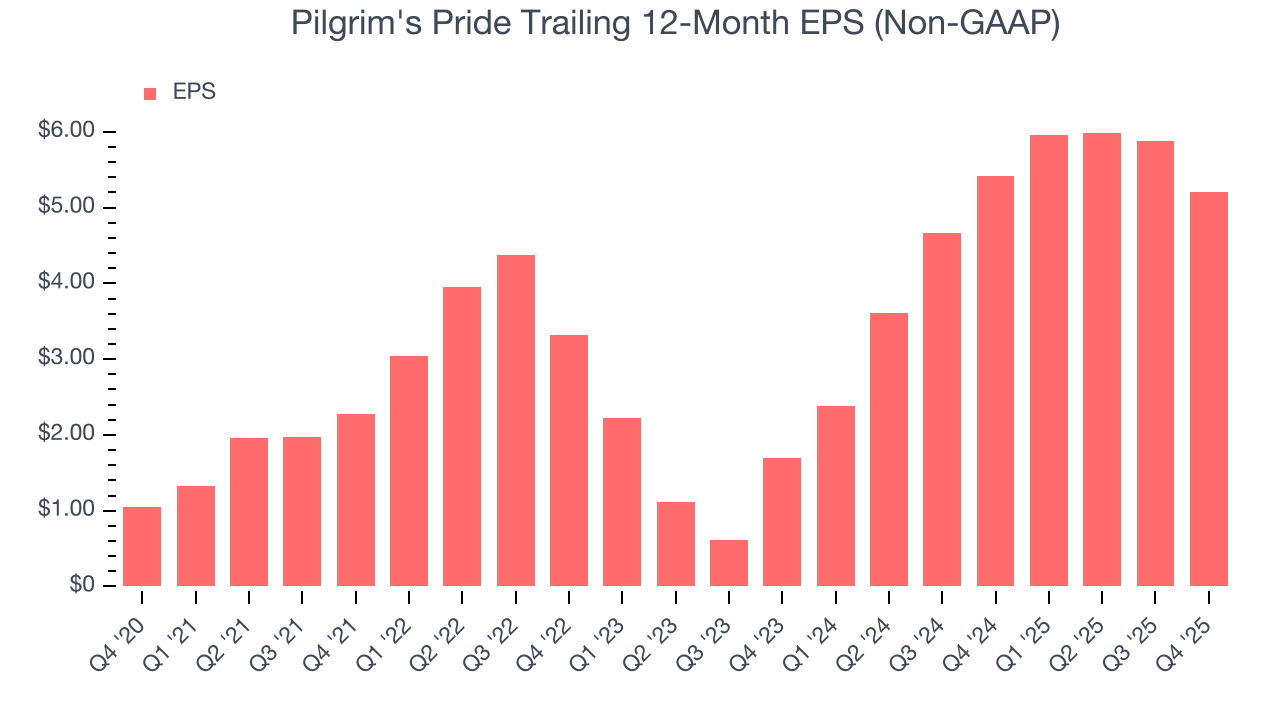
In Q4, Pilgrim's Pride reported adjusted EPS of $0.68, down from $1.35 in the same quarter last year. This print missed analysts’ estimates, but we care more about long-term adjusted EPS growth than short-term movements. Over the next 12 months, Wall Street expects Pilgrim's Pride’s full-year EPS of $5.21 to shrink by 21.7%.
9. Cash Is King
If you’ve followed StockStory for a while, you know we emphasize free cash flow. Why, you ask? We believe that in the end, cash is king, and you can’t use accounting profits to pay the bills.
Pilgrim's Pride has shown decent cash profitability, giving it some flexibility to reinvest or return capital to investors. The company’s free cash flow margin averaged 6% over the last two years, slightly better than the broader consumer staples sector.
Taking a step back, we can see that Pilgrim's Pride’s margin dropped by 4.9 percentage points over the last year. If its declines continue, it could signal increasing investment needs and capital intensity.
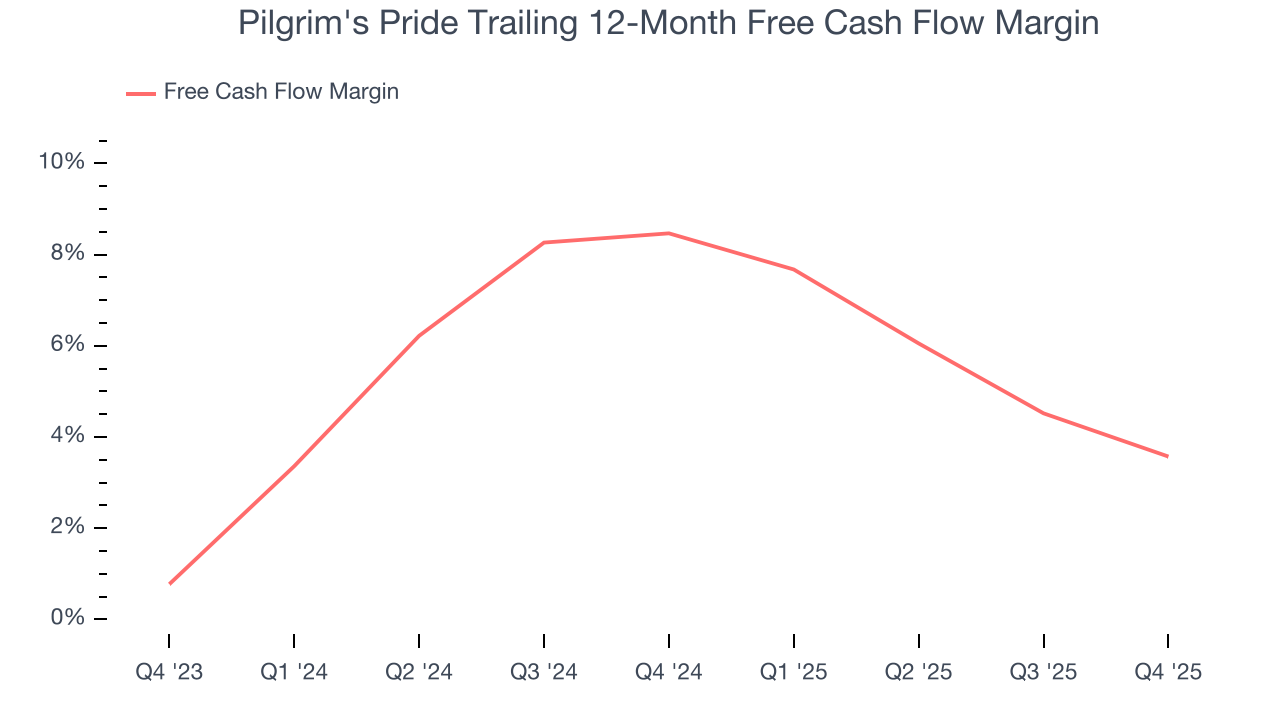
Pilgrim's Pride broke even from a free cash flow perspective in Q4. The company’s cash profitability regressed as it was 3.9 percentage points lower than in the same quarter last year, suggesting its historical struggles have dragged on.
10. Return on Invested Capital (ROIC)
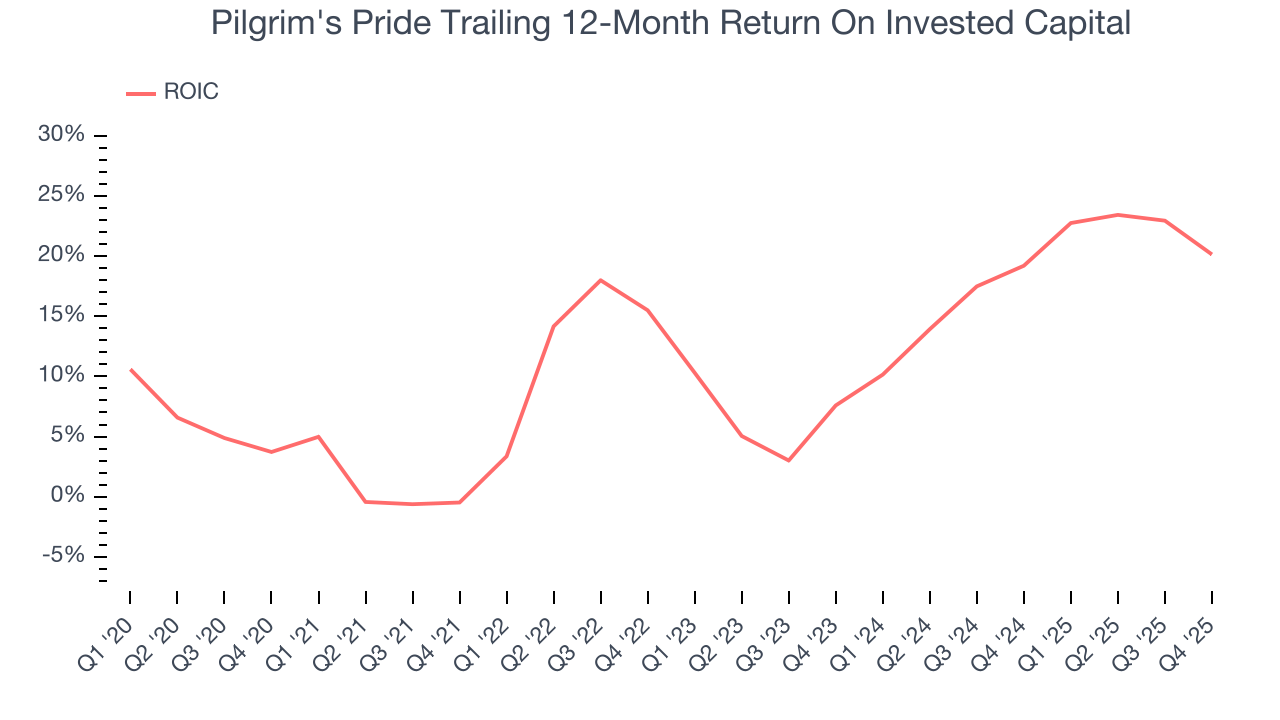
EPS and free cash flow tell us whether a company was profitable while growing its revenue. But was it capital-efficient? Enter ROIC, a metric showing how much operating profit a company generates relative to the money it has raised (debt and equity).
Pilgrim's Pride’s management team makes decent investment decisions and generates value for shareholders. Its five-year average ROIC was 12.4%, slightly better than typical consumer staples business.
11. Balance Sheet Assessment
Pilgrim's Pride reported $640.2 million of cash and $3.29 billion of debt on its balance sheet in the most recent quarter. As investors in high-quality companies, we primarily focus on two things: 1) that a company’s debt level isn’t too high and 2) that its interest payments are not excessively burdening the business.
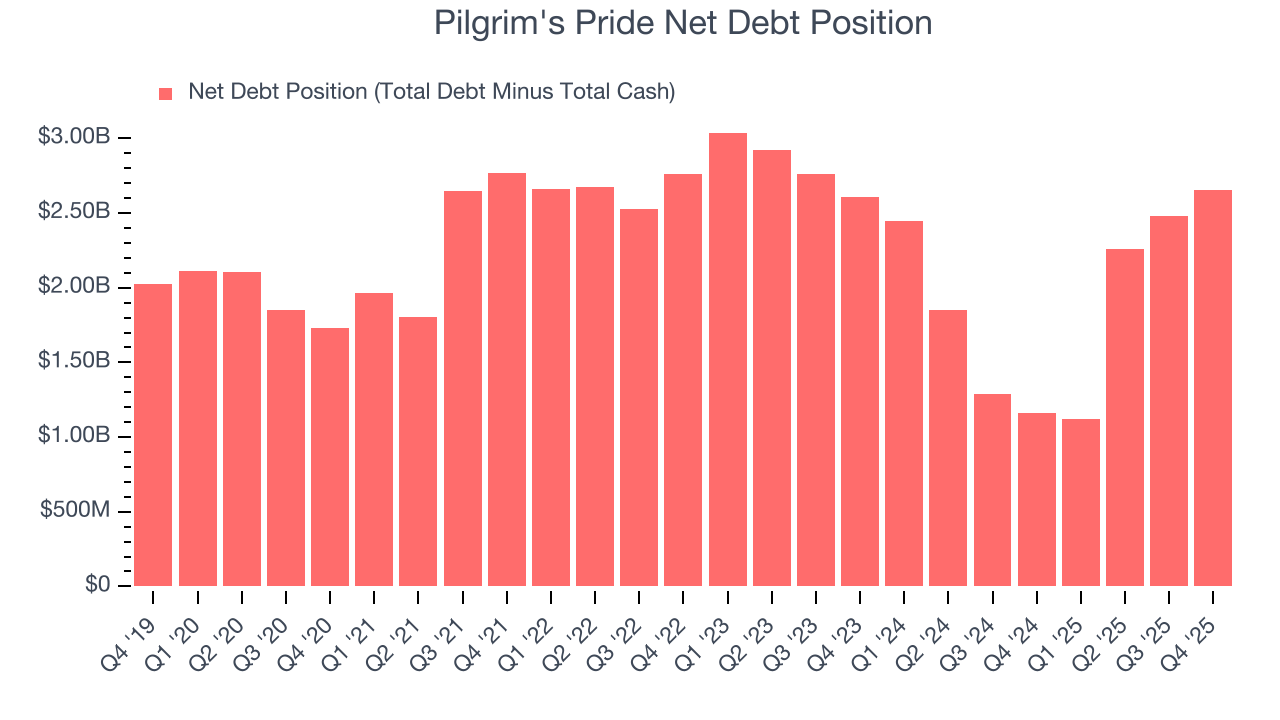
With $2.27 billion of EBITDA over the last 12 months, we view Pilgrim's Pride’s 1.2× net-debt-to-EBITDA ratio as safe. We also see its $110.3 million of annual interest expenses as appropriate. The company’s profits give it plenty of breathing room, allowing it to continue investing in growth initiatives.
12. Key Takeaways from Pilgrim's Pride’s Q4 Results
We enjoyed seeing Pilgrim's Pride beat analysts’ EBITDA expectations this quarter. We were also happy its revenue outperformed Wall Street’s estimates. On the other hand, its EPS missed. Zooming out, we think this was a mixed quarter. The stock remained flat at $43.20 immediately following the results.
13. Is Now The Time To Buy Pilgrim's Pride?
Updated: March 14, 2026 at 10:45 PM EDT
The latest quarterly earnings matters, sure, but we actually think longer-term fundamentals and valuation matter more. Investors should consider all these pieces before deciding whether or not to invest in Pilgrim's Pride.
We see the value of companies helping consumers, but in the case of Pilgrim's Pride, we’re out. First off, its revenue growth was uninspiring over the last three years, and analysts expect its demand to deteriorate over the next 12 months. While its unparalleled brand awareness makes it a household name consumers consistently turn to, the downside is its projected EPS for the next year is lacking. On top of that, its gross margins make it more challenging to reach positive operating profits compared to other consumer staples businesses.
Pilgrim's Pride’s P/E ratio based on the next 12 months is 8.7x. While this valuation is optically cheap, the potential downside is huge given its shaky fundamentals. There are more exciting stocks to buy at the moment.
Wall Street analysts have a consensus one-year price target of $44.38 on the company (compared to the current share price of $36.18).
Although the price target is bullish, readers should exercise caution because analysts tend to be overly optimistic. The firms they work for, often big banks, have relationships with companies that extend into fundraising, M&A advisory, and other rewarding business lines. As a result, they typically hesitate to say bad things for fear they will lose out. We at StockStory do not suffer from such conflicts of interest, so we’ll always tell it like it is.