
Peloton (PTON)
We wouldn’t recommend Peloton. Its falling revenue and negative returns on capital suggest it’s destroying value as demand fizzles out.― StockStory Analyst Team
1. News


2. Summary
Why We Think Peloton Will Underperform
Started as a Kickstarter campaign, Peloton (NASDAQ: PTON) is a fitness technology company known for its at-home exercise equipment and interactive online workout classes.
- Annual revenue declines of 3.8% over the last five years indicate problems with its market positioning
- Sales were less profitable over the last five years as its earnings per share fell by 31.7% annually, worse than its revenue declines
- Persistent operating margin losses suggest the business manages its expenses poorly


Peloton’s quality doesn’t meet our bar. Better stocks can be found in the market.
Why There Are Better Opportunities Than Peloton


At $3.72 per share, Peloton trades at 13x forward P/E. This multiple is lower than most consumer discretionary companies, but for good reason.
Our advice is to pay up for elite businesses whose advantages are tailwinds to earnings growth. Don’t get sucked into lower-quality businesses just because they seem like bargains. These mediocre businesses often never achieve a higher multiple as hoped, a phenomenon known as a “value trap”.
3. Peloton (PTON) Research Report: Q4 CY2025 Update
Exercise equipment company Peloton (NASDAQ:PTON) missed Wall Street’s revenue expectations in Q4 CY2025, with sales falling 2.6% year on year to $656.5 million. Next quarter’s revenue guidance of $615 million underwhelmed, coming in 3.5% below analysts’ estimates. Its GAAP loss of $0.09 per share was 53.8% below analysts’ consensus estimates.
Peloton (PTON) Q4 CY2025 Highlights:
- Revenue: $656.5 million vs analyst estimates of $677.2 million (2.6% year-on-year decline, 3.1% miss)
- EPS (GAAP): -$0.09 vs analyst expectations of -$0.06 (53.8% miss)
- Adjusted EBITDA: $81.4 million vs analyst estimates of $72.61 million (12.4% margin, 12.1% beat)
- The company dropped its revenue guidance for the full year to $2.42 billion at the midpoint from $2.45 billion, a 1.2% decrease
- EBITDA guidance for the full year is $475 million at the midpoint, above analyst estimates of $462 million
- Operating Margin: -2.2%, up from -6.8% in the same quarter last year
- Free Cash Flow Margin: 10.8%, down from 15.7% in the same quarter last year
- Connected Fitness Subscribers: 2.88 million, in line with the same quarter last year
- Market Capitalization: $2.47 billion
Company Overview
Started as a Kickstarter campaign, Peloton (NASDAQ: PTON) is a fitness technology company known for its at-home exercise equipment and interactive online workout classes.
Launched in 2012, Peloton brings immersive fitness experiences into the home. Its products aim to meet the growing need for a convenient and effective workout regimen.
The company offers a suite of interactive fitness equipment, including stationary bicycles and treadmills, complemented by video streams of live and on-demand workout classes. These solutions seek to bring the community and energy of live studio classes into the user's home.
Peloton's revenue streams are multifaceted, including the initial sale of exercise equipment, ongoing subscriptions for class content, and a range of branded apparel.
4. Consumer Electronics
Consumer electronics companies aim to address the evolving leisure and entertainment needs of consumers, who are increasingly familiar with technology in everyday life. Whether it’s speakers for the home or specialized cameras to document everything from a surfing session to a wedding reception, these businesses are trying to provide innovative, high-quality products that are both useful and cool to own. Adding to the degree of difficulty for these companies is technological change, where the latest smartphone could disintermediate a whole category of consumer electronics. Companies that successfully serve customers and innovate can enjoy high customer loyalty and pricing power, while those that struggle with these may go the way of the VHS tape.
Competitors offering at-home fitness products and online workout classes include Nautilus (NYSE:NLS), Lululemon (NASDAQ:LULU), and Planet Fitness (NYSE:PLNT).
5. Revenue Growth
A company’s long-term sales performance can indicate its overall quality. Any business can put up a good quarter or two, but many enduring ones grow for years. Over the last five years, Peloton’s demand was weak and its revenue declined by 3.8% per year. This was below our standards and is a sign of poor business quality.
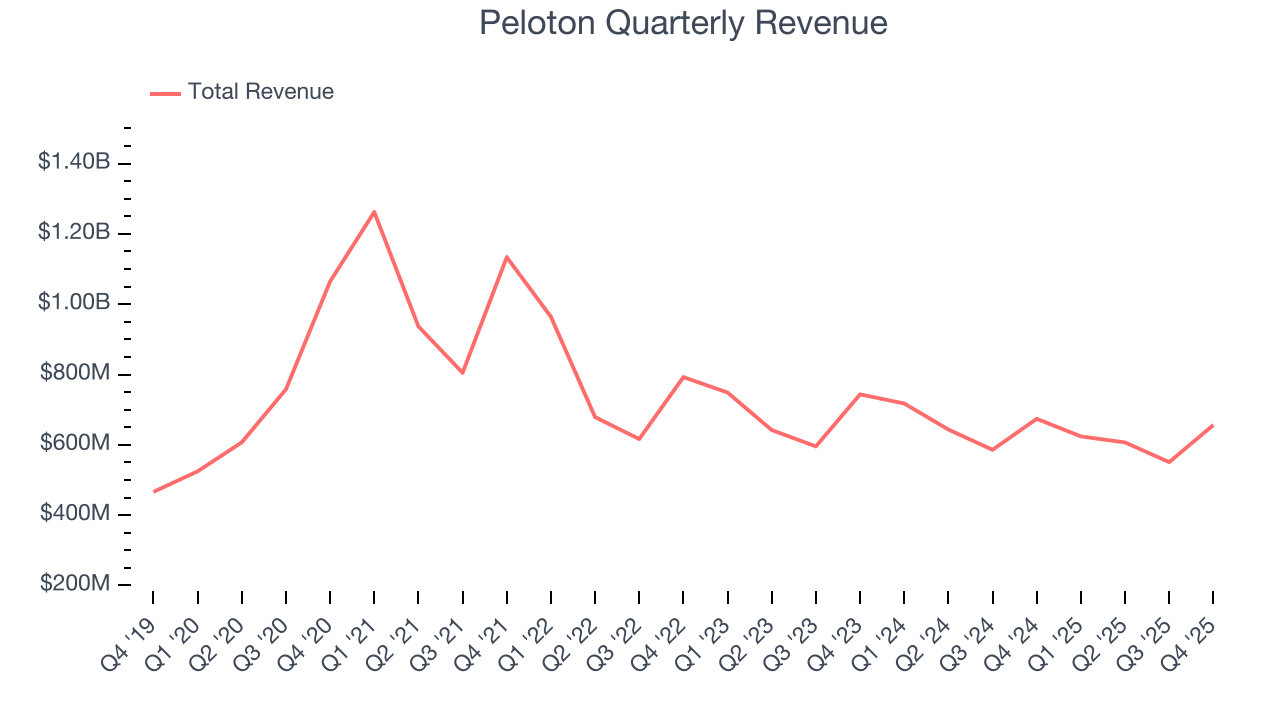
Long-term growth is the most important, but within consumer discretionary, product cycles are short and revenue can be hit-driven due to rapidly changing trends and consumer preferences. Peloton’s recent performance shows its demand remained suppressed as its revenue has declined by 5.5% annually over the last two years. 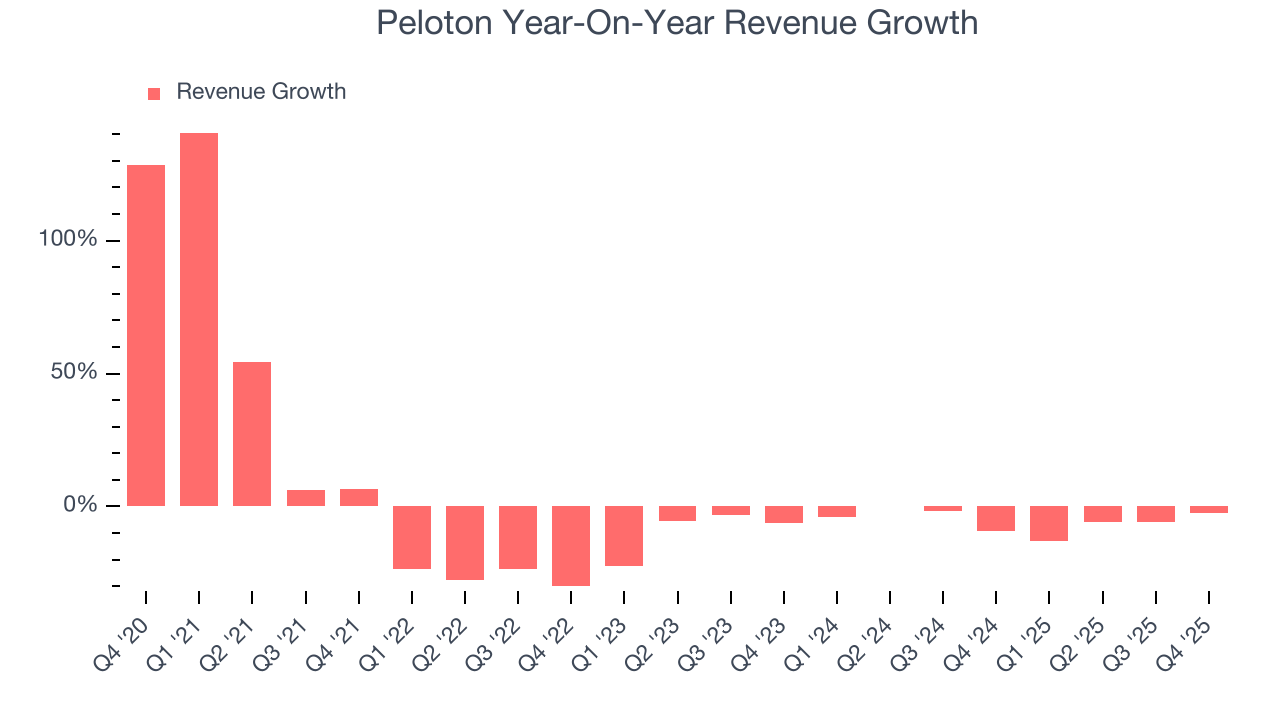
Peloton also discloses its number of connected fitness subscribers, which reached 2.88 million in the latest quarter. Over the last two years, Peloton’s connected fitness subscribers averaged 3.1% year-on-year declines. Because this number is higher than its revenue growth during the same period, we can see the company’s monetization has fallen. 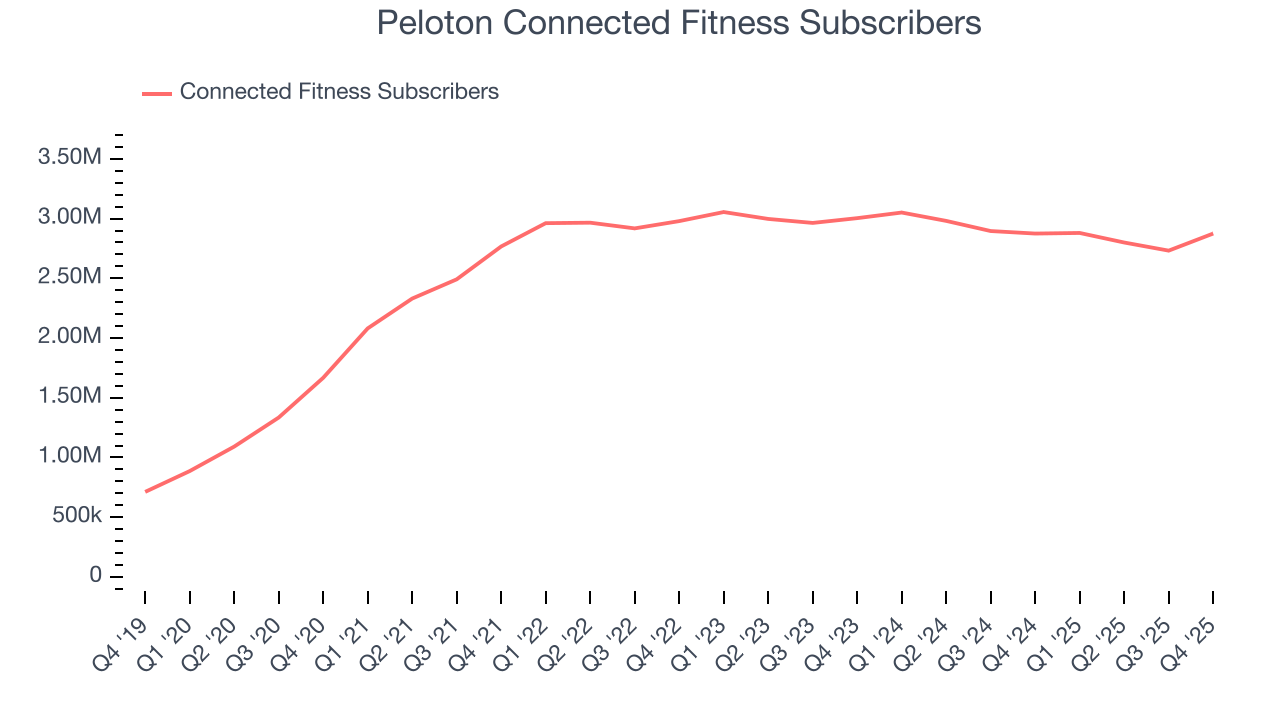
This quarter, Peloton missed Wall Street’s estimates and reported a rather uninspiring 2.6% year-on-year revenue decline, generating $656.5 million of revenue. Company management is currently guiding for a 1.4% year-on-year decline in sales next quarter.
Looking further ahead, sell-side analysts expect revenue to grow 2.7% over the next 12 months. While this projection indicates its newer products and services will catalyze better top-line performance, it is still below average for the sector.
6. Operating Margin
Operating margin is a key measure of profitability. Think of it as net income - the bottom line - excluding the impact of taxes and interest on debt, which are less connected to business fundamentals.
Peloton’s operating margin has risen over the last 12 months, but it still averaged negative 4.3% over the last two years. This is due to its large expense base and inefficient cost structure.
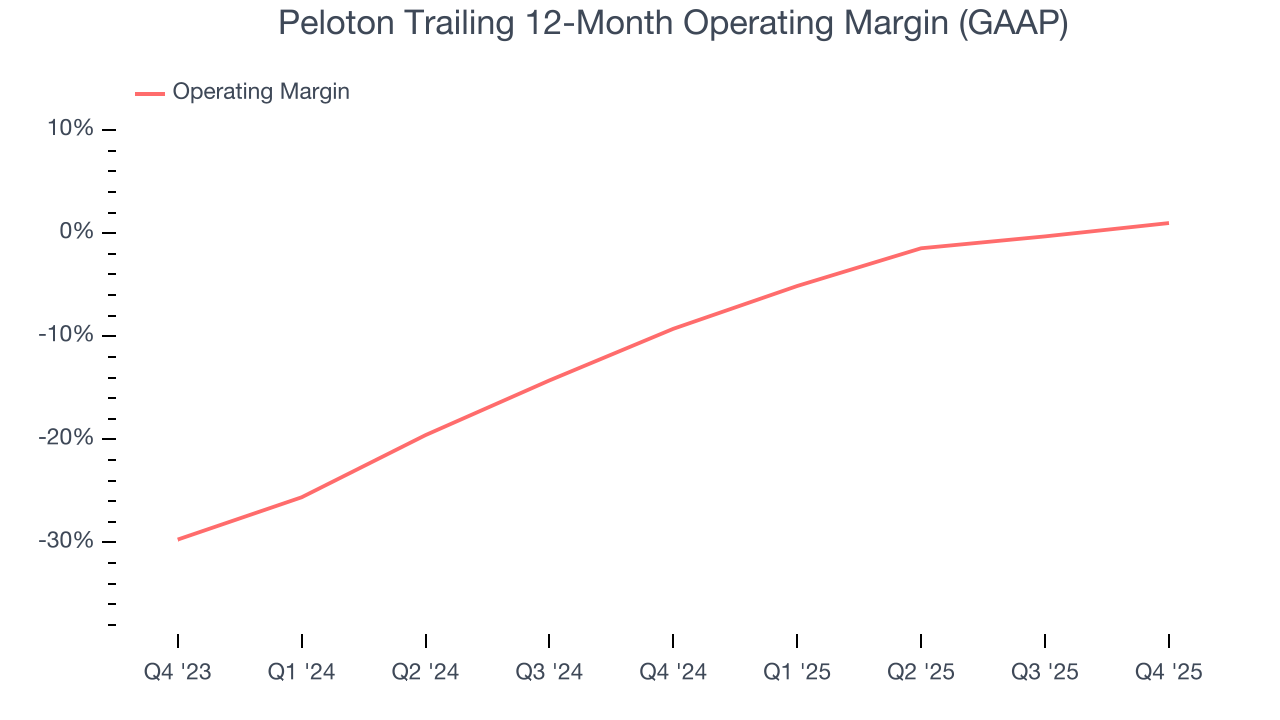
This quarter, Peloton generated a negative 2.2% operating margin. The company's consistent lack of profits raise a flag.
7. Earnings Per Share
We track the long-term change in earnings per share (EPS) for the same reason as long-term revenue growth. Compared to revenue, however, EPS highlights whether a company’s growth is profitable.
Sadly for Peloton, its EPS declined by 18.2% annually over the last five years, more than its revenue. This tells us the company struggled because its fixed cost base made it difficult to adjust to shrinking demand.
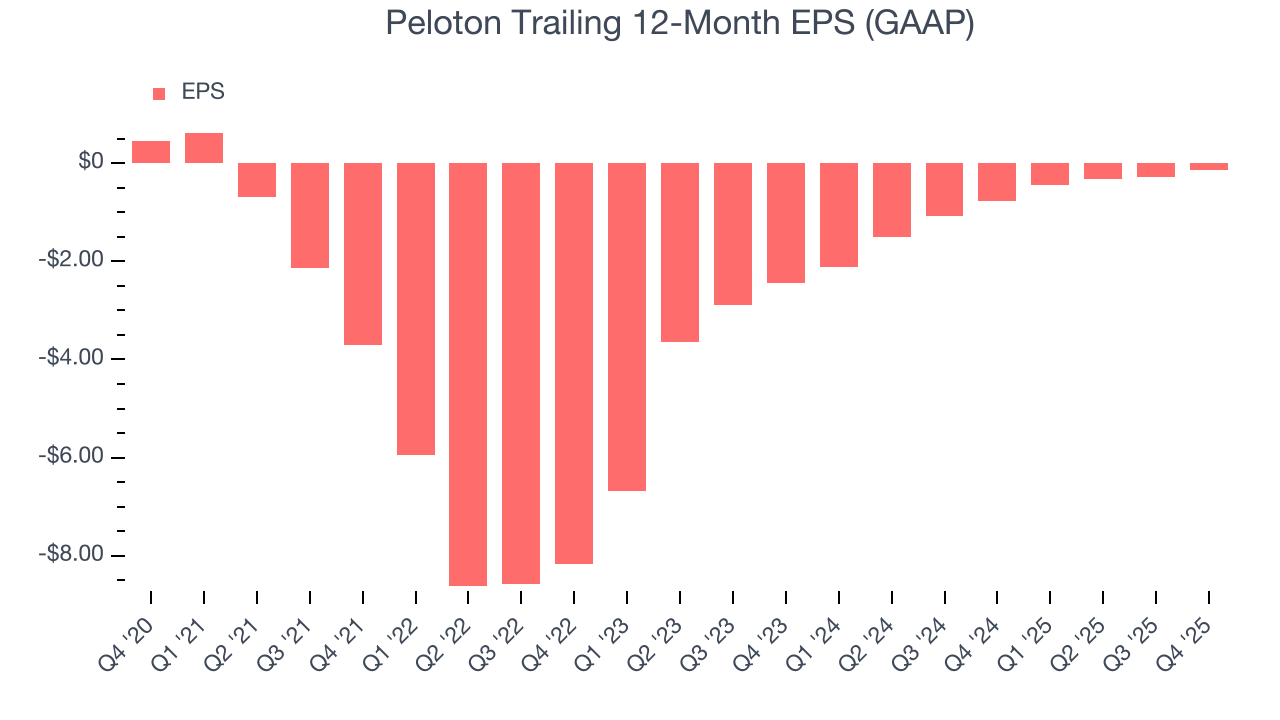
In Q4, Peloton reported EPS of negative $0.09, up from negative $0.24 in the same quarter last year. Despite growing year on year, this print missed analysts’ estimates. Over the next 12 months, Wall Street is optimistic. Analysts forecast Peloton’s full-year EPS of negative $0.14 will flip to positive $0.28.
8. Cash Is King
If you’ve followed StockStory for a while, you know we emphasize free cash flow. Why, you ask? We believe that in the end, cash is king, and you can’t use accounting profits to pay the bills.
Peloton has shown poor cash profitability over the last two years, giving the company limited opportunities to return capital to shareholders. Its free cash flow margin averaged 9.8%, lousy for a consumer discretionary business.
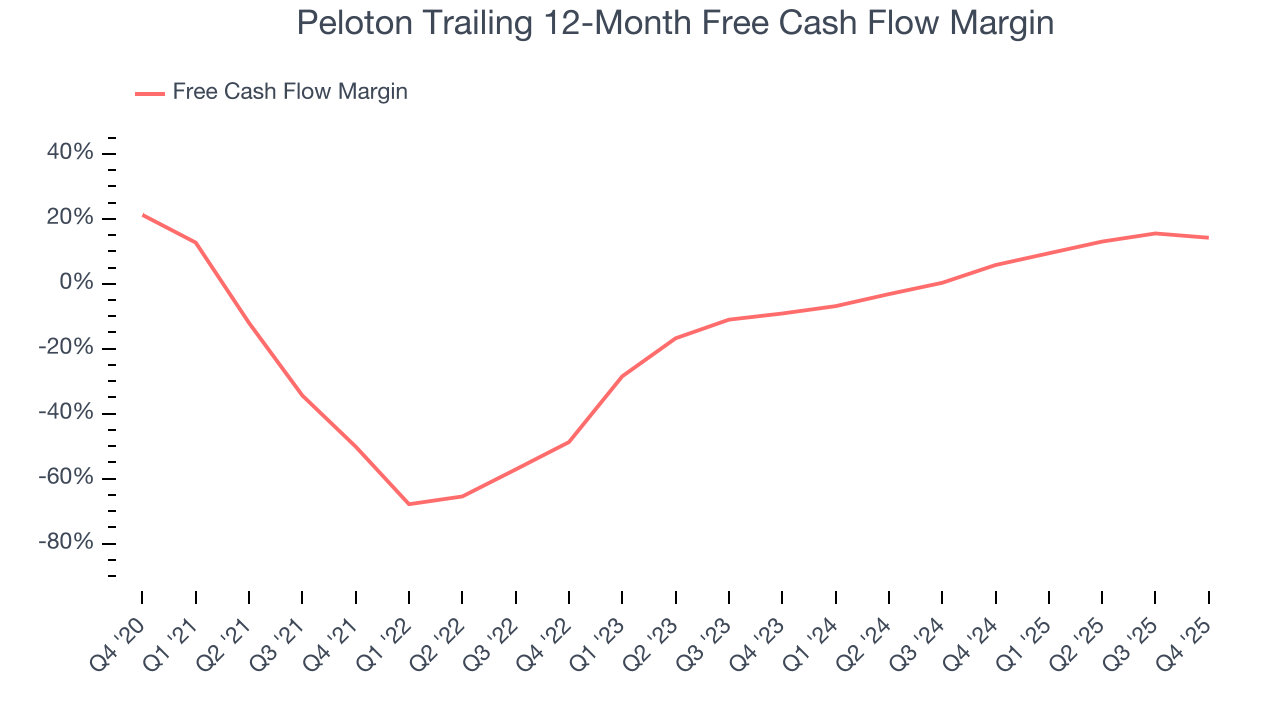
Peloton’s free cash flow clocked in at $71 million in Q4, equivalent to a 10.8% margin. The company’s cash profitability regressed as it was 4.9 percentage points lower than in the same quarter last year, prompting us to pay closer attention. Short-term fluctuations typically aren’t a big deal because investment needs can be seasonal, but we’ll be watching to see if the trend extrapolates into future quarters.
9. Return on Invested Capital (ROIC)
EPS and free cash flow tell us whether a company was profitable while growing its revenue. But was it capital-efficient? A company’s ROIC explains this by showing how much operating profit it makes compared to the money it has raised (debt and equity).
Peloton’s five-year average ROIC was negative 51.2%, meaning management lost money while trying to expand the business. Its returns were among the worst in the consumer discretionary sector.
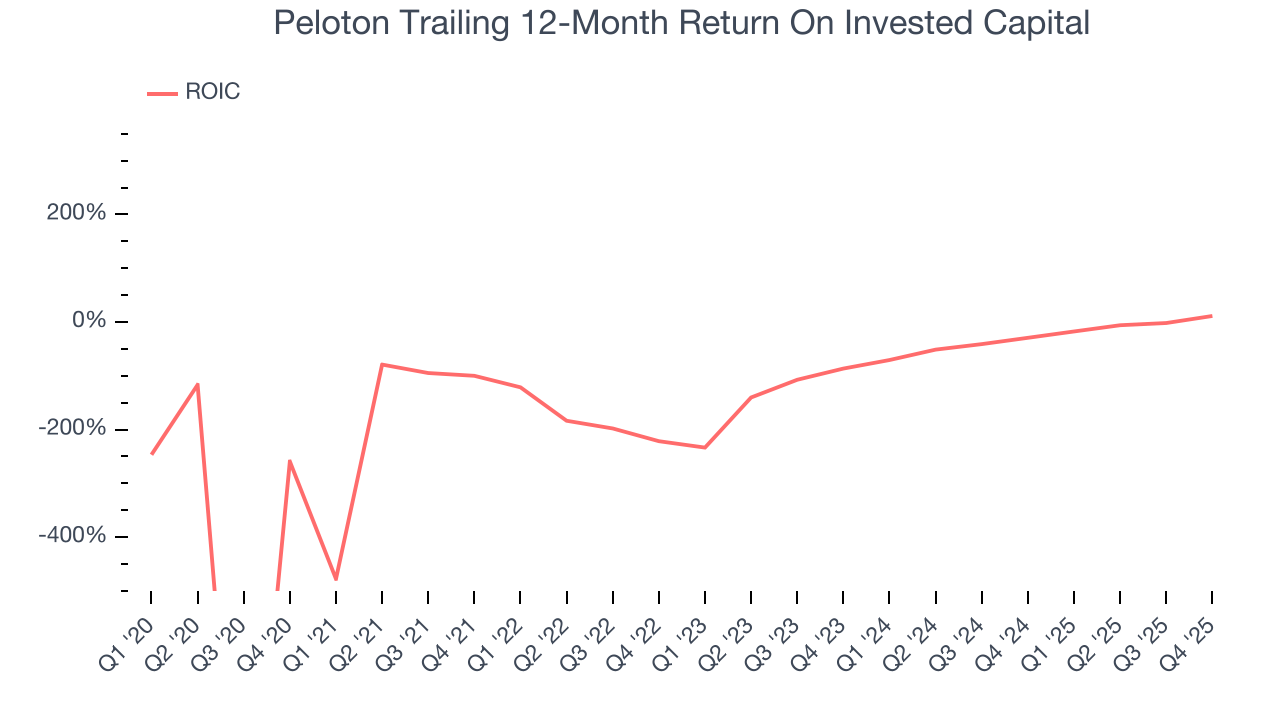
We like to invest in businesses with high returns, but the trend in a company’s ROIC is what often surprises the market and moves the stock price. Over the last few years, Peloton’s ROIC has increased. This is a good sign, but we recognize its lack of profitable growth during the COVID era was the primary reason for the change.
10. Balance Sheet Assessment
One of the best ways to mitigate bankruptcy risk is to hold more cash than debt.
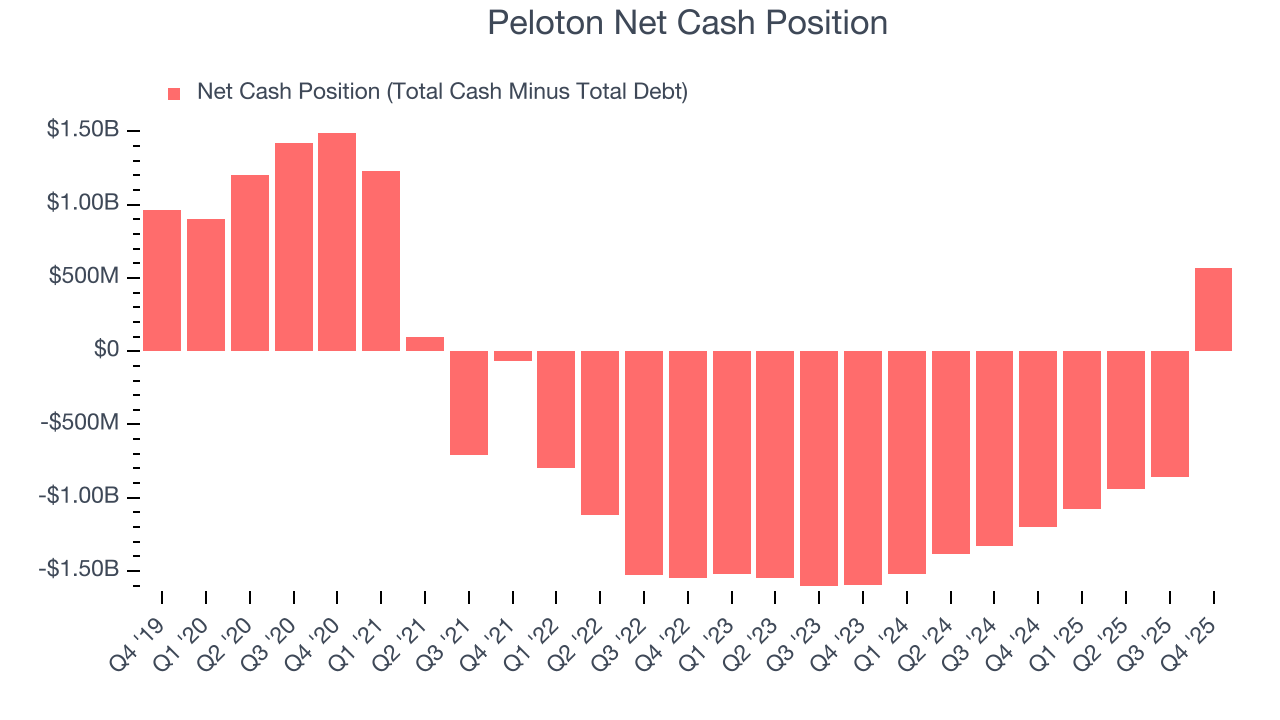
Peloton is a profitable, well-capitalized company with $1.22 billion of cash and $657.1 million of debt on its balance sheet. This $566.1 million net cash position is 22.9% of its market cap and gives it the freedom to borrow money, return capital to shareholders, or invest in growth initiatives. Leverage is not an issue here.
11. Key Takeaways from Peloton’s Q4 Results
We were impressed by Peloton’s optimistic EBITDA guidance for next quarter, which blew past analysts’ expectations. We were also happy its EBITDA outperformed Wall Street’s estimates. On the other hand, its EPS missed and its full-year revenue guidance fell short of Wall Street’s estimates. Overall, this quarter could have been better. The stock traded down 5.3% to $5.60 immediately after reporting.
12. Is Now The Time To Buy Peloton?
Updated: March 14, 2026 at 10:24 PM EDT
The latest quarterly earnings matters, sure, but we actually think longer-term fundamentals and valuation matter more. Investors should consider all these pieces before deciding whether or not to invest in Peloton.
Peloton falls short of our quality standards. While its projected EPS for the next year implies the company’s fundamentals will improve, the downside is its number of connected fitness subscribers has disappointed. On top of that, its declining EPS over the last five years makes it a less attractive asset to the public markets.
Peloton’s P/E ratio based on the next 12 months is 13x. While this valuation is fair, the upside isn’t great compared to the potential downside. There are better investments elsewhere.
Wall Street analysts have a consensus one-year price target of $7.88 on the company (compared to the current share price of $3.72).
Although the price target is bullish, readers should exercise caution because analysts tend to be overly optimistic. The firms they work for, often big banks, have relationships with companies that extend into fundraising, M&A advisory, and other rewarding business lines. As a result, they typically hesitate to say bad things for fear they will lose out. We at StockStory do not suffer from such conflicts of interest, so we’ll always tell it like it is.