
RadNet (RDNT)
RadNet doesn’t impress us. Its sales have underperformed and its low returns on capital show it has few growth opportunities.― StockStory Analyst Team
1. News


2. Summary
Why RadNet Is Not Exciting
With over 350 imaging facilities across seven states and a growing artificial intelligence division, RadNet (NASDAQ:RDNT) operates a network of outpatient diagnostic imaging centers across the United States, offering services like MRI, CT scans, PET scans, mammography, and X-rays.
- Ability to fund investments or reward shareholders with increased buybacks or dividends is restricted by its weak free cash flow margin of 0.7% for the last five years
- Poor expense management has led to an adjusted operating margin that is below the industry average
- One positive is that its incremental sales over the last five years have been highly profitable as its earnings per share increased by 42.7% annually, topping its revenue gains


RadNet doesn’t meet our quality standards. We’re hunting for superior stocks elsewhere.
Why There Are Better Opportunities Than RadNet


RadNet’s stock price of $64.50 implies a valuation ratio of 103.3x forward P/E. The current multiple is quite expensive, especially for the fundamentals of the business.
We prefer to invest in similarly-priced but higher-quality companies with superior earnings growth.
3. RadNet (RDNT) Research Report: Q4 CY2025 Update
Diagnostic imaging company RadNet (NASDAQ:RDNT) beat Wall Street’s revenue expectations in Q4 CY2025, with sales up 14.8% year on year to $547.7 million. Its non-GAAP profit of $0.23 per share was 12.6% above analysts’ consensus estimates.
RadNet (RDNT) Q4 CY2025 Highlights:
- Revenue: $547.7 million vs analyst estimates of $517.9 million (14.8% year-on-year growth, 5.8% beat)
- Adjusted EPS: $0.23 vs analyst estimates of $0.20 (12.6% beat)
- Adjusted EBITDA: $87.71 million vs analyst estimates of $84.08 million (16% margin, 4.3% beat)
- Operating Margin: 5.1%, in line with the same quarter last year
- Free Cash Flow was -$100.3 million compared to -$44.04 million in the same quarter last year
- Market Capitalization: $5.4 billion
Company Overview
With over 350 imaging facilities across seven states and a growing artificial intelligence division, RadNet (NASDAQ:RDNT) operates a network of outpatient diagnostic imaging centers across the United States, offering services like MRI, CT scans, PET scans, mammography, and X-rays.
RadNet's imaging centers serve as critical diagnostic hubs where physicians can send patients for a wide range of imaging procedures that help detect and monitor diseases. The company's multi-modality approach means most centers offer several types of imaging technologies under one roof, creating convenience for patients who might need multiple scans and providing physicians with comprehensive diagnostic capabilities.
When a patient visits a RadNet facility, they might receive anything from a routine X-ray for a potential bone fracture to a specialized PET/CT scan to evaluate cancer treatment effectiveness. A typical patient experience involves checking in, undergoing the prescribed imaging procedure administered by technologists, and having their images interpreted by radiologists who then send detailed reports to the referring physician.
RadNet generates revenue through a mix of payment sources. Commercial insurance companies pay agreed-upon rates for services, while Medicare and Medicaid reimburse according to government-established fee schedules. The company also participates in managed care capitation agreements where it receives fixed monthly payments per member to provide all necessary imaging services.
Beyond traditional imaging services, RadNet has expanded into artificial intelligence through its DeepHealth subsidiary and European acquisitions. These AI initiatives focus on enhancing radiologist interpretations of breast, lung, and prostate images, potentially improving diagnostic accuracy and efficiency.
RadNet also provides teleradiology services internationally through its Heart & Lung Imaging subsidiary, which serves providers within the United Kingdom's National Health Service by remotely interpreting medical images. The company's software division, eRad, develops and sells systems for managing, storing, and distributing digital medical images.
4. Testing & Diagnostics Services
The testing and diagnostics services industry plays a crucial role in disease detection, monitoring, and prevention, serving hospitals, clinics, and individual consumers. This sector benefits from stable demand, driven by an aging population, increased prevalence of chronic diseases, and growing awareness of preventive healthcare. Recurring revenue streams come from routine screenings, lab tests, and diagnostic imaging, with reimbursement from Medicare, Medicaid, private insurance, and out-of-pocket payments. However, the industry faces challenges such as pricing pressures, regulatory compliance, and the need for continuous investment in new testing technologies. Looking ahead, industry tailwinds include the expansion of personalized medicine, increased adoption of at-home and rapid diagnostic tests, and advancements in AI-driven diagnostics that enhance accuracy and efficiency. However, headwinds such as reimbursement uncertainties, competition from decentralized testing solutions, and regulatory scrutiny over test validity and cost-effectiveness may impact profitability. Adapting to evolving healthcare models and integrating automation will be key for sustaining growth and maintaining operational efficiency.
RadNet competes with other outpatient imaging center operators like Akumin (NASDAQ:AKU), as well as hospital-based imaging departments, physician-owned imaging centers, and other healthcare facilities offering diagnostic imaging services.
5. Revenue Scale
Larger companies benefit from economies of scale, where fixed costs like infrastructure, technology, and administration are spread over a higher volume of goods or services, reducing the cost per unit. Scale can also lead to bargaining power with suppliers, greater brand recognition, and more investment firepower. A virtuous cycle can ensue if a scaled company plays its cards right.
With just $2.04 billion in revenue over the past 12 months, RadNet lacks scale in an industry where it matters. This makes it difficult to build trust with customers because healthcare is heavily regulated, complex, and resource-intensive.
6. Revenue Growth
Reviewing a company’s long-term sales performance reveals insights into its quality. Any business can have short-term success, but a top-tier one grows for years. Over the last five years, RadNet grew its sales at a solid 13.7% compounded annual growth rate. Its growth beat the average healthcare company and shows its offerings resonate with customers.
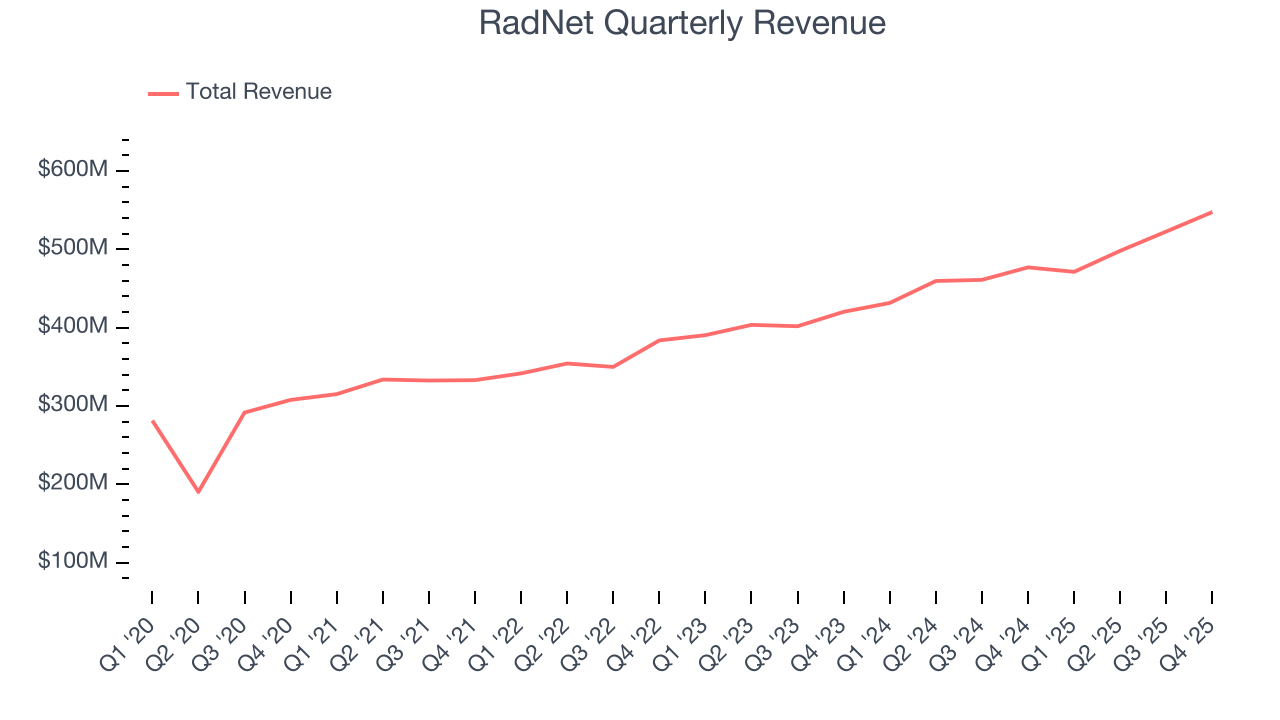
Long-term growth is the most important, but within healthcare, a half-decade historical view may miss new innovations or demand cycles. RadNet’s annualized revenue growth of 12.3% over the last two years is below its five-year trend, but we still think the results suggest healthy demand. 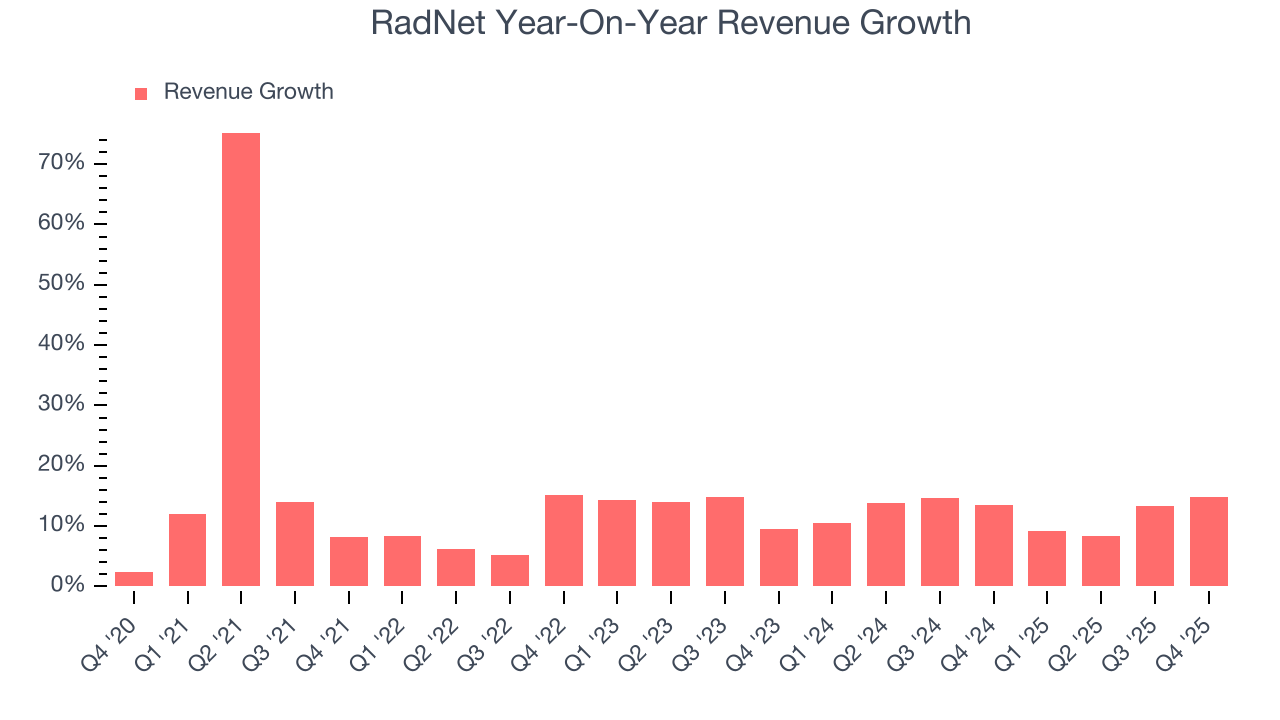
This quarter, RadNet reported year-on-year revenue growth of 14.8%, and its $547.7 million of revenue exceeded Wall Street’s estimates by 5.8%.
Looking ahead, sell-side analysts expect revenue to grow 11.7% over the next 12 months, similar to its two-year rate. This projection is admirable and implies the market is forecasting success for its products and services.
7. Operating Margin
Operating margin is a key measure of profitability. Think of it as net income - the bottom line - excluding the impact of taxes and interest on debt, which are less connected to business fundamentals.
RadNet was profitable over the last five years but held back by its large cost base. Its average operating margin of 4.8% was weak for a healthcare business.
Analyzing the trend in its profitability, RadNet’s operating margin decreased by 3.2 percentage points over the last five years. The company’s two-year trajectory also shows it failed to get its profitability back to the peak as its margin fell by 3.1 percentage points. This performance was poor no matter how you look at it - it shows its expenses were rising and it couldn’t pass those costs onto its customers.
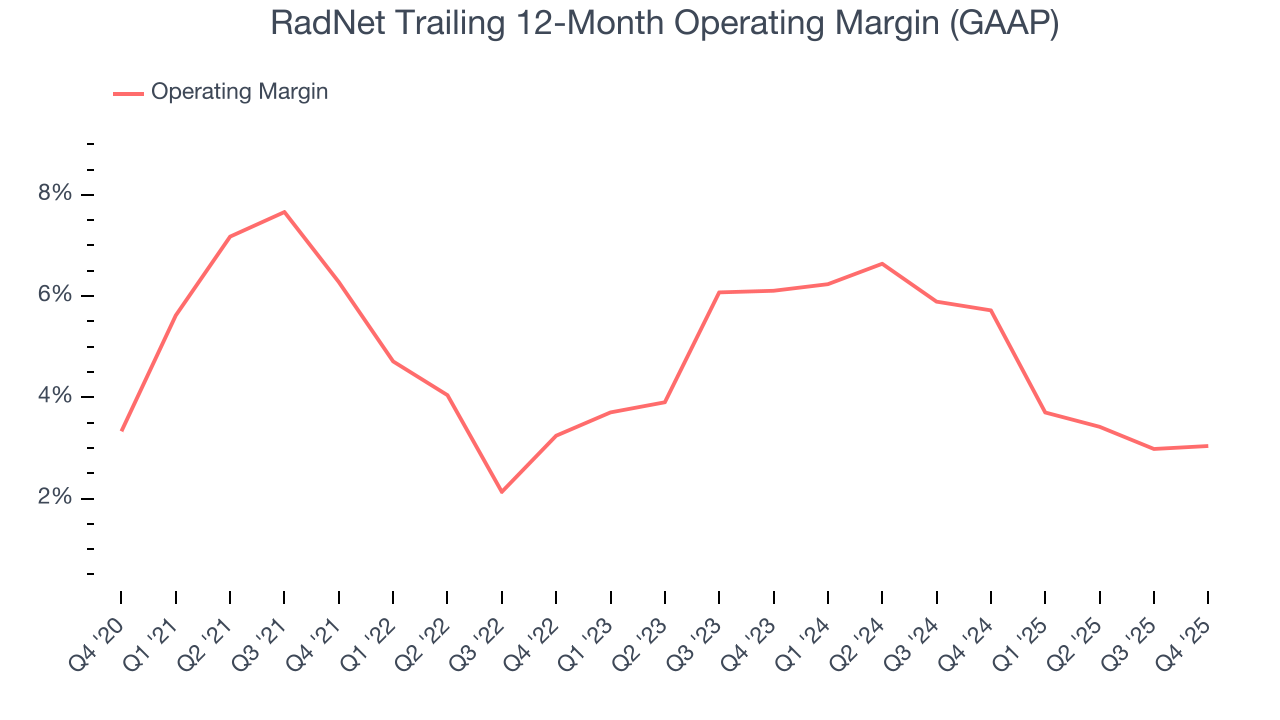
In Q4, RadNet generated an operating margin profit margin of 5.1%, in line with the same quarter last year. This indicates the company’s overall cost structure has been relatively stable.
8. Earnings Per Share
We track the long-term change in earnings per share (EPS) for the same reason as long-term revenue growth. Compared to revenue, however, EPS highlights whether a company’s growth is profitable.
RadNet’s full-year EPS flipped from negative to positive over the last five years. This is encouraging and shows it’s at a critical moment in its life.
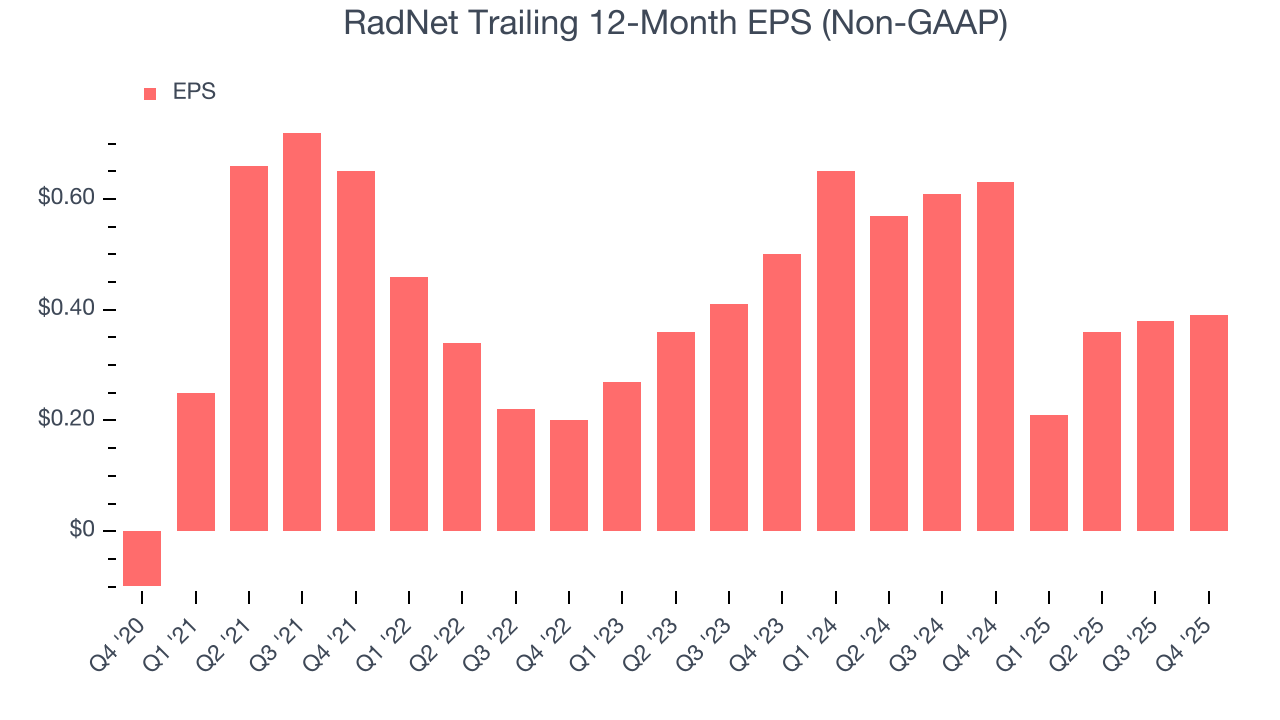
In Q4, RadNet reported adjusted EPS of $0.23, up from $0.22 in the same quarter last year. This print easily cleared analysts’ estimates, and shareholders should be content with the results. Over the next 12 months, Wall Street expects RadNet’s full-year EPS of $0.39 to grow 78.6%.
9. Cash Is King
Although earnings are undoubtedly valuable for assessing company performance, we believe cash is king because you can’t use accounting profits to pay the bills.
RadNet broke even from a free cash flow perspective over the last five years, giving the company limited opportunities to return capital to shareholders.
Taking a step back, an encouraging sign is that RadNet’s margin expanded by 2.7 percentage points during that time. The company’s improvement shows it’s heading in the right direction, and we can see it became a less capital-intensive business because its free cash flow profitability rose while its operating profitability fell.
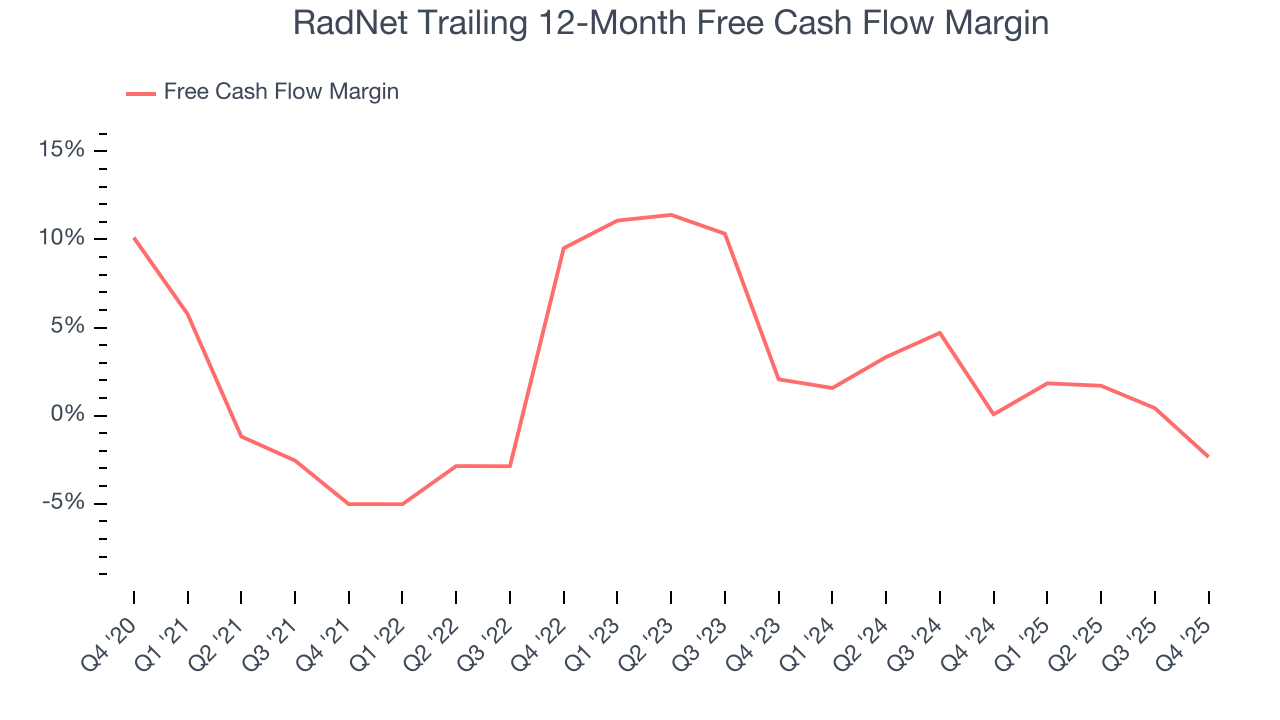
RadNet burned through $100.3 million of cash in Q4, equivalent to a negative 18.3% margin. The company’s cash burn increased from $44.04 million of lost cash in the same quarter last year.
10. Return on Invested Capital (ROIC)
EPS and free cash flow tell us whether a company was profitable while growing its revenue. But was it capital-efficient? Enter ROIC, a metric showing how much operating profit a company generates relative to the money it has raised (debt and equity).
RadNet historically did a mediocre job investing in profitable growth initiatives. Its five-year average ROIC was 6.8%, somewhat low compared to the best healthcare companies that consistently pump out 20%+.
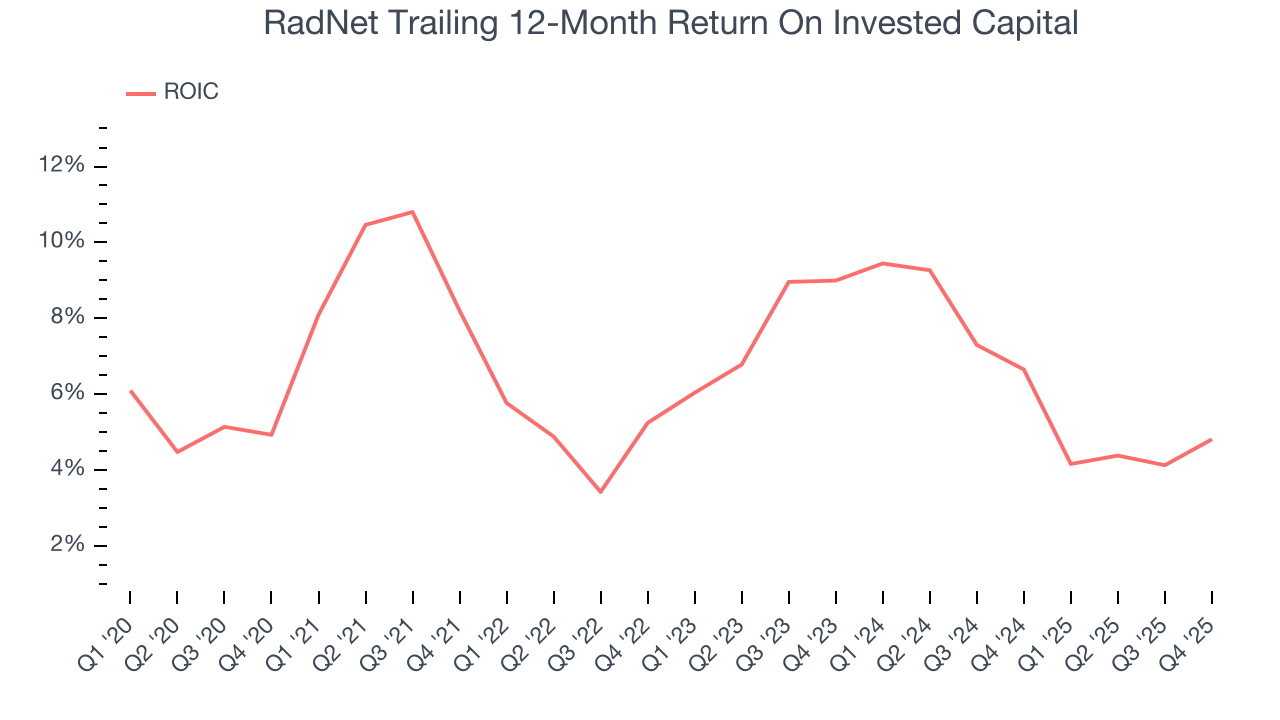
We like to invest in businesses with high returns, but the trend in a company’s ROIC is what often surprises the market and moves the stock price. Unfortunately, RadNet’s ROIC has stayed the same over the last few years. If the company wants to become an investable business, it must improve its returns by generating more profitable growth.
11. Balance Sheet Assessment
RadNet reported $767.2 million of cash and $1.86 billion of debt on its balance sheet in the most recent quarter. As investors in high-quality companies, we primarily focus on two things: 1) that a company’s debt level isn’t too high and 2) that its interest payments are not excessively burdening the business.
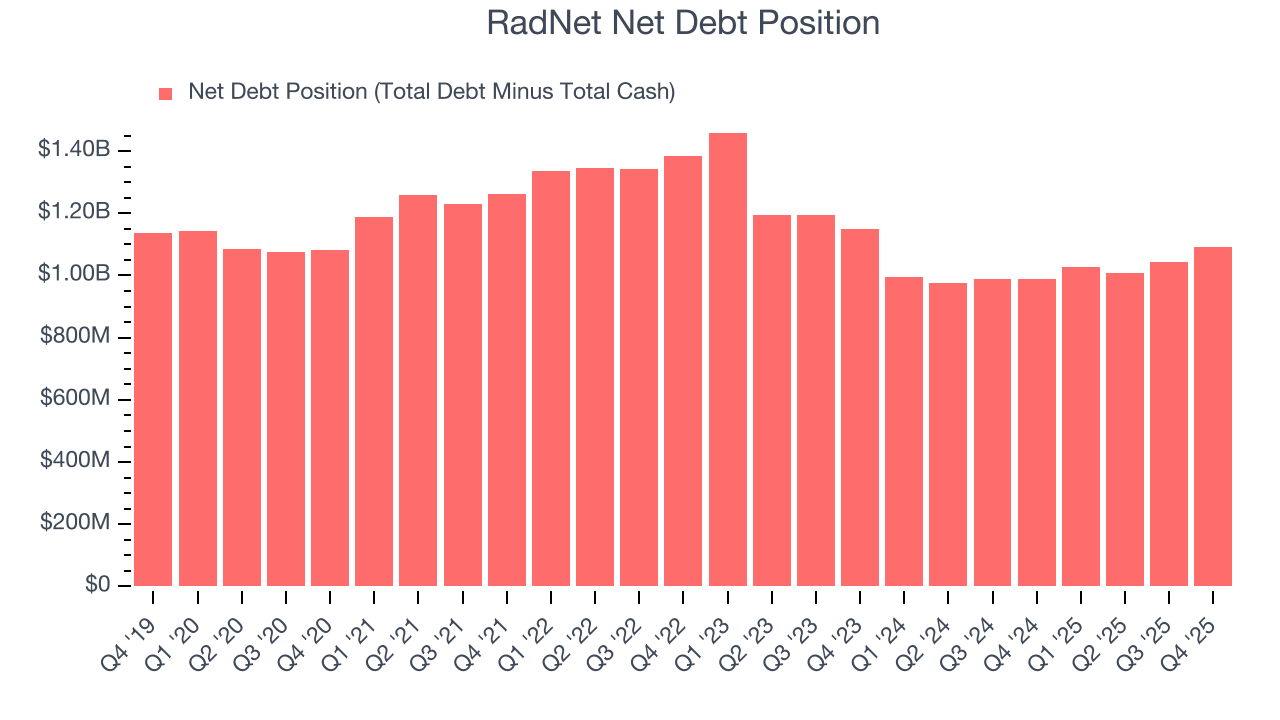
With $300.2 million of EBITDA over the last 12 months, we view RadNet’s 3.6× net-debt-to-EBITDA ratio as safe. We also see its $23.4 million of annual interest expenses as appropriate. The company’s profits give it plenty of breathing room, allowing it to continue investing in growth initiatives.
12. Key Takeaways from RadNet’s Q4 Results
We were impressed by how significantly RadNet blew past analysts’ revenue expectations this quarter. We were also glad its EPS outperformed Wall Street’s estimates. Zooming out, we think this was a solid print. The stock traded up 1.3% to $76.07 immediately following the results.
13. Is Now The Time To Buy RadNet?
Updated: March 17, 2026 at 12:05 AM EDT
Before deciding whether to buy RadNet or pass, we urge investors to consider business quality, valuation, and the latest quarterly results.
RadNet doesn’t top our investment wishlist, but we understand that it’s not a bad business. First off, its revenue growth was solid over the last five years and is expected to accelerate over the next 12 months. And while RadNet’s low free cash flow margins give it little breathing room, its astounding EPS growth over the last five years shows its profits are trickling down to shareholders.
RadNet’s P/E ratio based on the next 12 months is 103.3x. This multiple tells us a lot of good news is priced in - we think other companies feature superior fundamentals at the moment.
Wall Street analysts have a consensus one-year price target of $92.38 on the company (compared to the current share price of $64.50).