SolarEdge (SEDG)
SolarEdge keeps us up at night. Its falling revenue and negative returns on capital suggest it’s destroying value as demand fizzles out.― StockStory Analyst Team
1. News

2. Summary
Why We Think SolarEdge Will Underperform
Established in 2006, SolarEdge (NASDAQ: SEDG) creates advanced systems to improve the efficiency of solar panels.
- Products and services are facing significant end-market challenges during this cycle as sales have declined by 7.2% annually over the last five years
- Falling earnings per share over the last five years has some investors worried as stock prices ultimately follow EPS over the long term
- Negative earnings profile makes it challenging to secure favorable financing terms from lenders


SolarEdge doesn’t meet our quality standards. Better businesses are for sale in the market.
Why There Are Better Opportunities Than SolarEdge


At $37.90 per share, SolarEdge trades at 1.6x forward price-to-sales. The market typically values companies like SolarEdge based on their anticipated profits for the next 12 months, but it expects the business to lose money. We also think the upside isn’t great compared to the potential downside here - there are more exciting stocks to buy.
We’d rather pay up for companies with elite fundamentals than get a decent price on a poor one. High-quality businesses often have more durable earnings power, helping us sleep well at night.
3. SolarEdge (SEDG) Research Report: Q4 CY2025 Update
Solar power systems company SolarEdge (NASDAQ:SEDG) beat Wall Street’s revenue expectations in Q4 CY2025, with sales up 70.9% year on year to $335.4 million. Guidance for next quarter’s revenue was optimistic at $305 million at the midpoint, 3% above analysts’ estimates. Its non-GAAP loss of $0.14 per share was 39% above analysts’ consensus estimates.
SolarEdge (SEDG) Q4 CY2025 Highlights:
- Revenue: $335.4 million vs analyst estimates of $328 million (70.9% year-on-year growth, 2.2% beat)
- Adjusted EPS: -$0.14 vs analyst estimates of -$0.23 (39% beat)
- Adjusted EBITDA: -$41.23 million (-12.3% margin, 73.3% year-on-year growth)
- Revenue Guidance for Q1 CY2026 is $305 million at the midpoint, above analyst estimates of $296.2 million
- Adjusted EBITDA Margin: -12.3%, up from -78.8% in the same quarter last year
- Free Cash Flow Margin: 12.9%, similar to the same quarter last year
- Market Capitalization: $2.22 billion
Company Overview
Established in 2006, SolarEdge (NASDAQ: SEDG) creates advanced systems to improve the efficiency of solar panels.
SolarEdge initially focused on developing methods to improve the efficiency of solar photovoltaic (PV) systems. The company introduced a DC optimized inverter system that significantly enhanced the way solar energy is harvested and managed, contributing to higher energy outputs from PV systems. Over the years, SolarEdge has broadened its offerings to include a variety of energy management products, such as inverters and power optimizers, and has expanded its reach into both residential and commercial solar markets globally.
Today, SolarEdge offers a wide array of products that enhance the efficiency of solar energy systems. Key offerings include solar inverters and battery storage solutions, designed to optimize energy production and management. For example, SolarEdge's DC-optimized inverters improve power output by continuously tracking the maximum power point of each solar panel, ensuring that systems operate efficiently under various conditions. Additionally, SolarEdge provides intelligent energy management software, allowing users to monitor and control their systems in real-time, enhancing the functionality and maximizing the return on investment.
SolarEdge also provides an integrated suite of professional software tools designed to enhance the management of solar PV systems. Its offerings include a cloud-based monitoring platform that collects and analyzes performance data at multiple system levels, enabling precise maintenance and energy management. Additionally, SolarEdge offers mobile and web-based applications that support system design, real-time monitoring, and easy system activation, all of which are crucial for improving system performance and reducing operational costs. These products, coupled with a suite of aftermarket services, including maintenance and upgrades, create recurring customer engagement following initial installation, providing some stability in revenue streams.
SolarEdge primarily targets its products at solar installers and engineering and construction (EPC) firms. The company utilizes a combination of indirect sales through large distributors and direct sales for larger installers and EPCs. Its client base includes providers of solar PV systems for both residential and commercial markets, alongside key solar distributors and electrical equipment wholesalers.
4. Renewable Energy
Renewable energy companies are buoyed by the secular trend of green energy that is upending traditional power generation. Those who innovate and evolve with this dynamic market can win share while those who continue to rely on legacy technologies can see diminishing demand, which includes headwinds from increasing regulation against “dirty” energy. Additionally, these companies are at the whim of economic cycles, as interest rates can impact the willingness to invest in renewable energy projects.
Competitors in the solar industry include Enphase Energy (NASDAQ:ENPH), SunPower (NASDAQ:SPWR), and Sunrun (NASDAQ:RUN).
5. Revenue Growth
A company’s long-term sales performance can indicate its overall quality. Any business can put up a good quarter or two, but the best consistently grow over the long haul. SolarEdge’s demand was weak over the last five years as its sales fell at a 4.1% annual rate. This was below our standards and suggests it’s a low quality business.
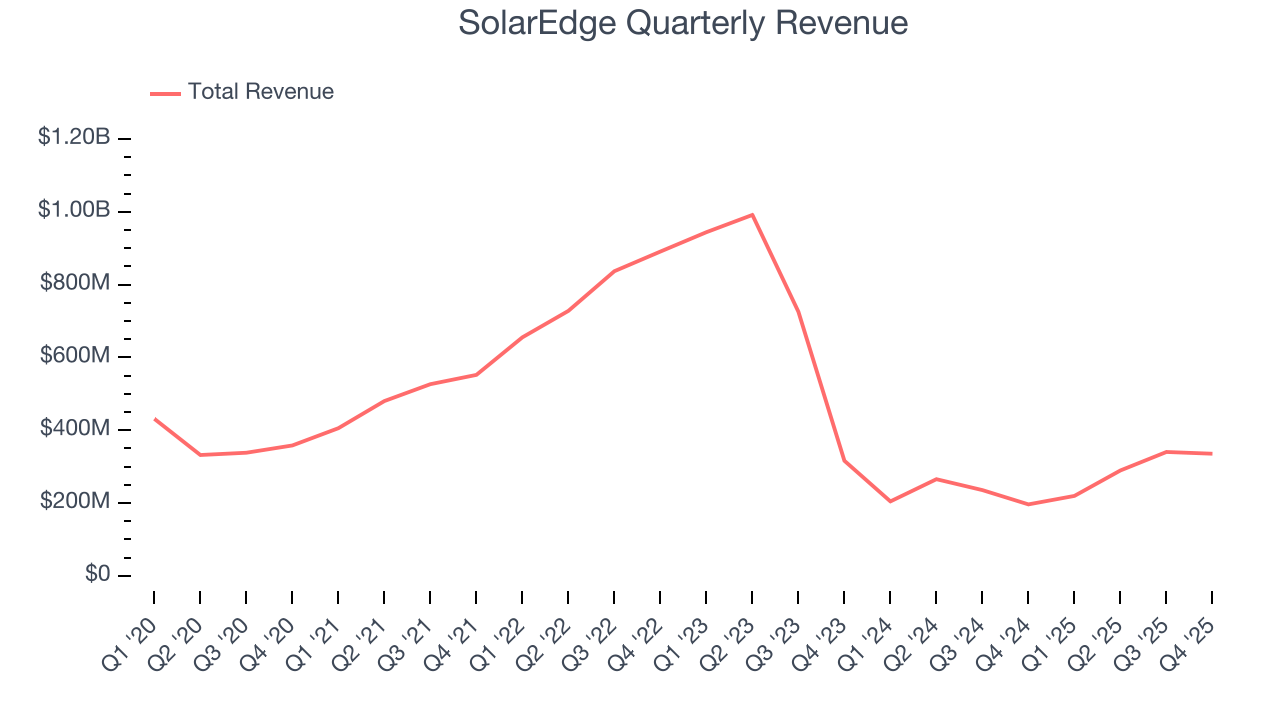
We at StockStory place the most emphasis on long-term growth, but within industrials, a half-decade historical view may miss cycles, industry trends, or a company capitalizing on catalysts such as a new contract win or a successful product line. SolarEdge’s recent performance shows its demand remained suppressed as its revenue has declined by 36.9% annually over the last two years. 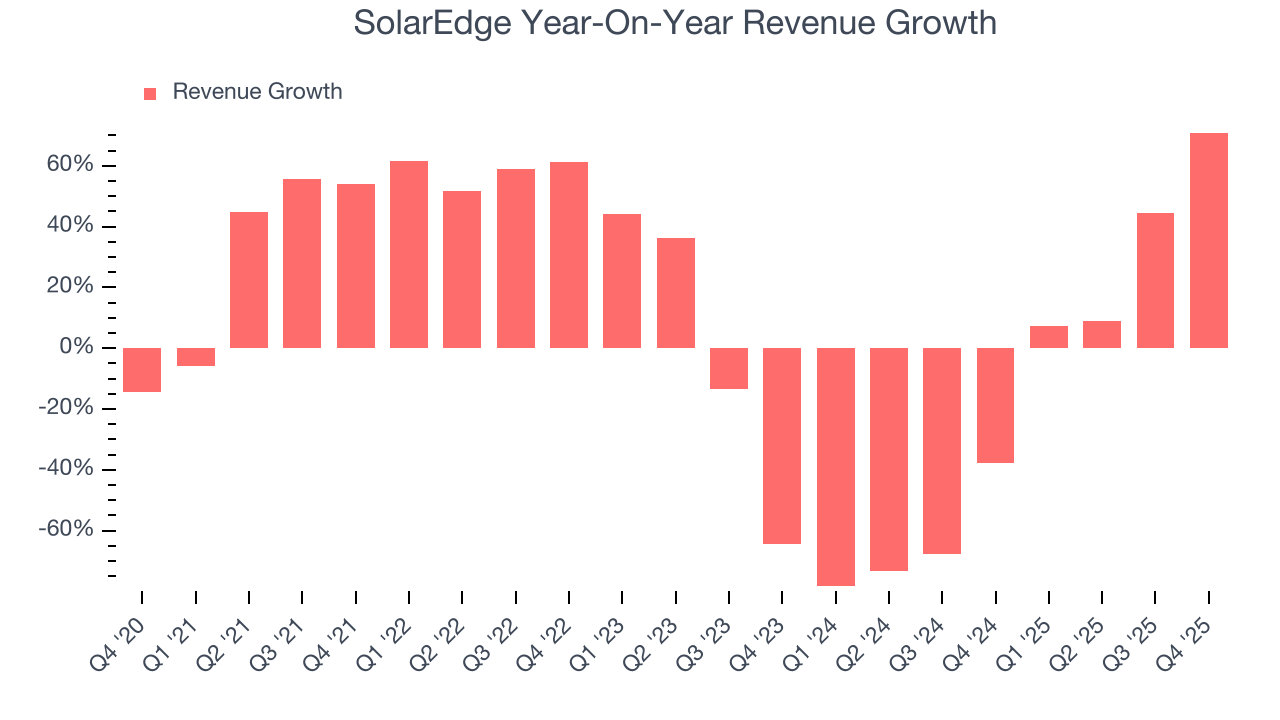
This quarter, SolarEdge reported magnificent year-on-year revenue growth of 70.9%, and its $335.4 million of revenue beat Wall Street’s estimates by 2.2%. Company management is currently guiding for a 39% year-on-year increase in sales next quarter.
Looking further ahead, sell-side analysts expect revenue to grow 14% over the next 12 months, an improvement versus the last two years. This projection is admirable and suggests its newer products and services will fuel better top-line performance.
6. Gross Margin & Pricing Power
SolarEdge has bad unit economics for an industrials business, signaling it operates in a competitive market. As you can see below, it averaged a 15.7% gross margin over the last five years. That means SolarEdge paid its suppliers a lot of money ($84.34 for every $100 in revenue) to run its business. 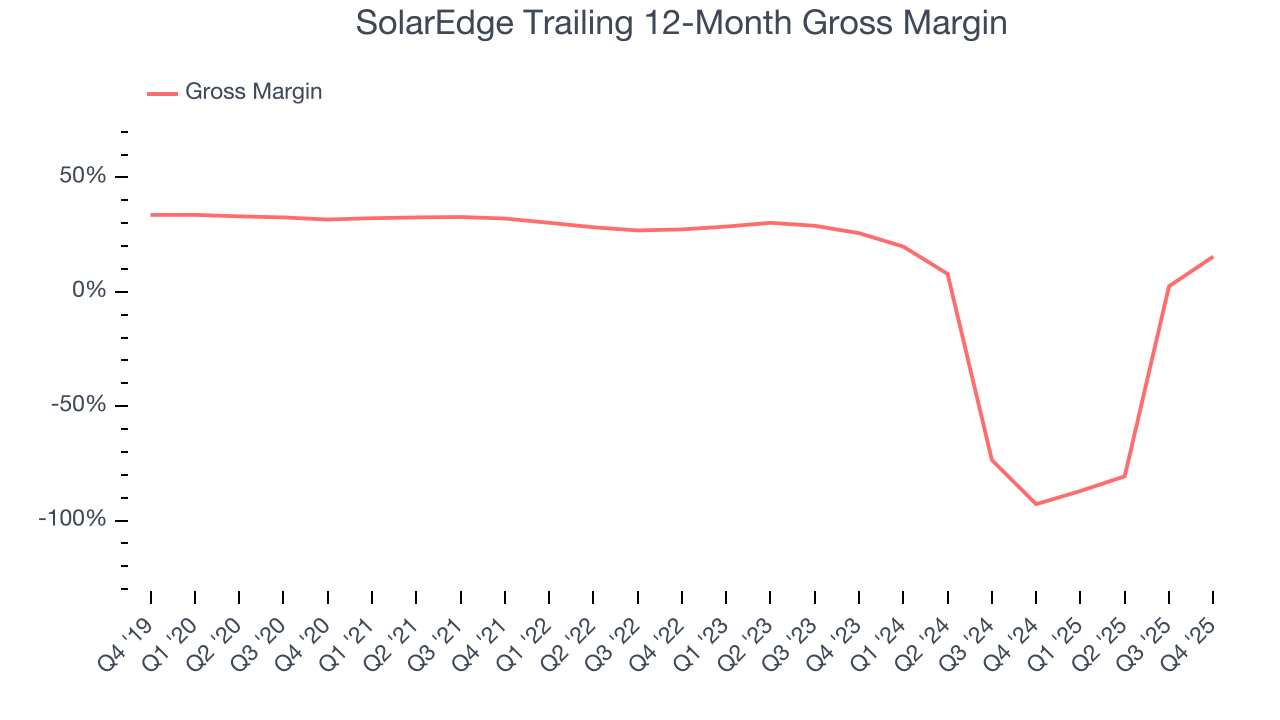
This quarter, SolarEdge’s gross profit margin was 22.2% , marking a 64.2 percentage point increase from -42% in the same quarter last year. SolarEdge’s full-year margin has also been trending up over the past 12 months, increasing by 108.2 percentage points. If this move continues, it could suggest a less competitive environment where the company has better pricing power and leverage from its growing sales on the fixed portion of its cost of goods sold (such as manufacturing expenses).
7. Operating Margin
SolarEdge’s high expenses have contributed to an average operating margin of negative 15.7% over the last five years. Unprofitable industrials companies require extra attention because they could get caught swimming naked when the tide goes out. It’s hard to trust that the business can endure a full cycle.
Looking at the trend in its profitability, SolarEdge’s operating margin decreased by 36 percentage points over the last five years. SolarEdge’s performance was poor no matter how you look at it - it shows that costs were rising and it couldn’t pass them onto its customers.
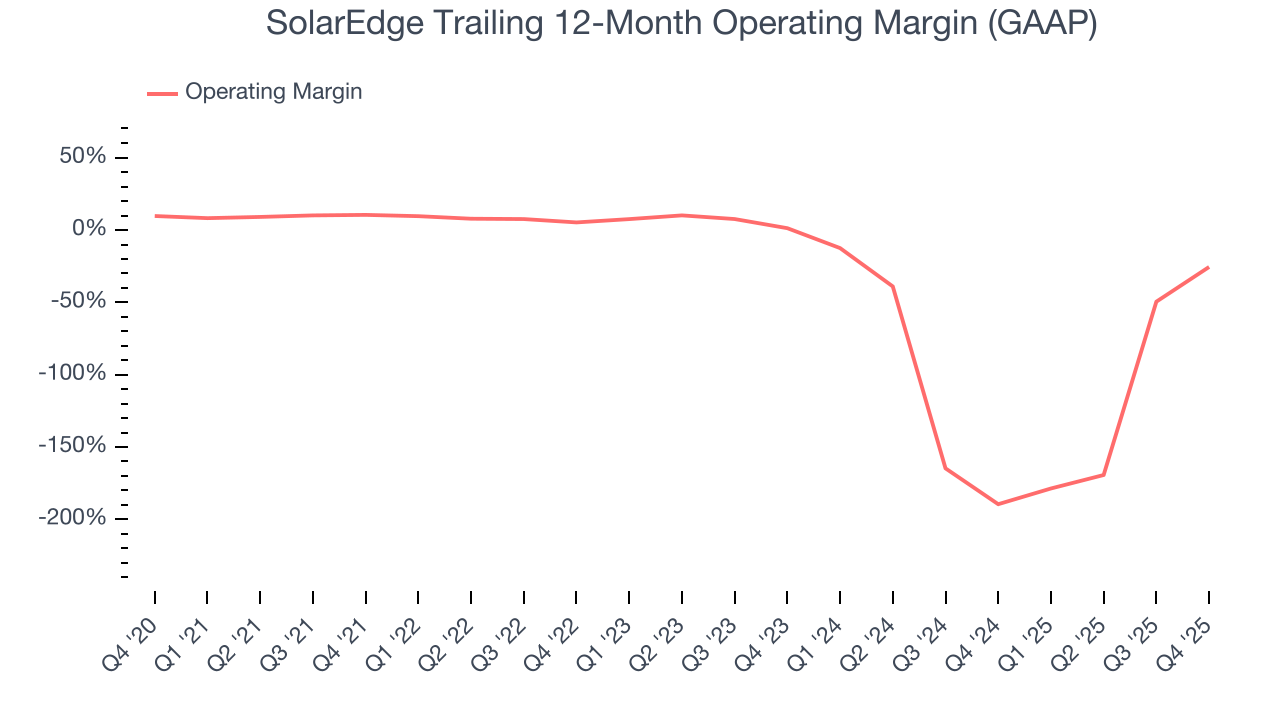
This quarter, SolarEdge generated a negative 14.4% operating margin. The company's consistent lack of profits raise a flag.
8. Earnings Per Share
Revenue trends explain a company’s historical growth, but the long-term change in earnings per share (EPS) points to the profitability of that growth – for example, a company could inflate its sales through excessive spending on advertising and promotions.
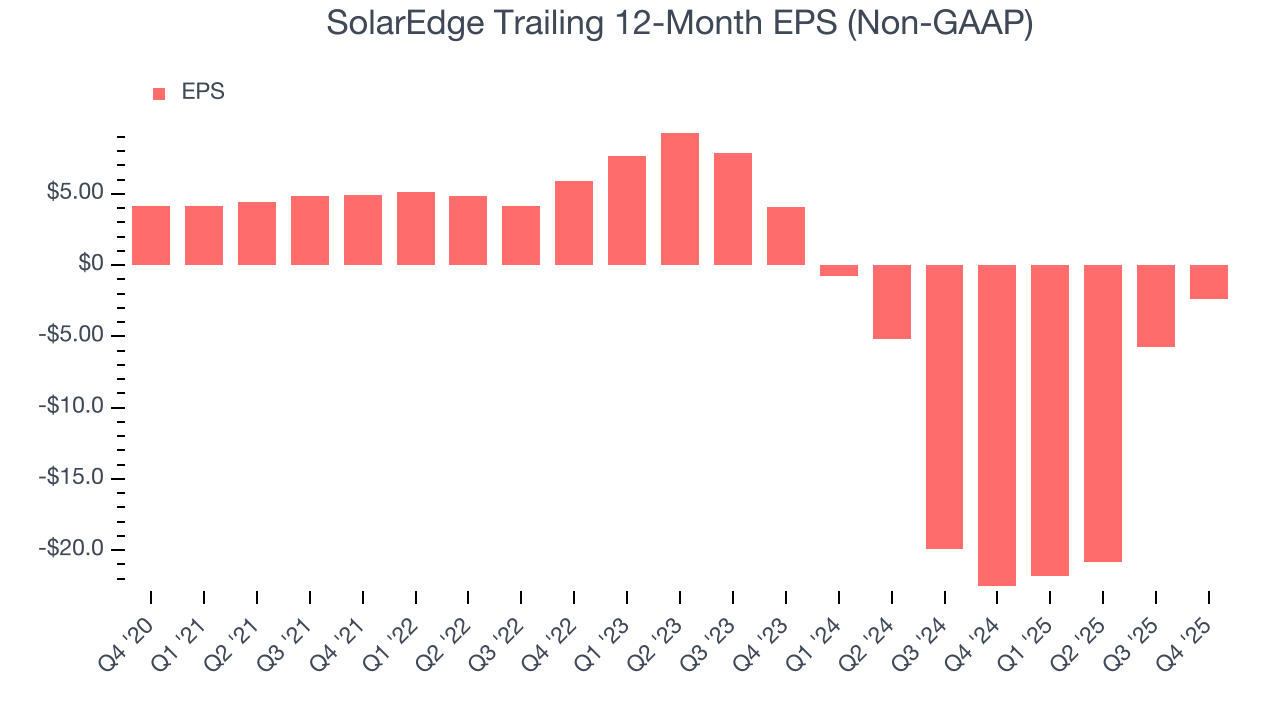
Sadly for SolarEdge, its EPS declined by 20.9% annually over the last five years, more than its revenue. This tells us the company struggled because its fixed cost base made it difficult to adjust to shrinking demand.
We can take a deeper look into SolarEdge’s earnings to better understand the drivers of its performance. As we mentioned earlier, SolarEdge’s operating margin expanded this quarter but declined by 36 percentage points over the last five years. Its share count also grew by 11.8%, meaning the company not only became less efficient with its operating expenses but also diluted its shareholders. 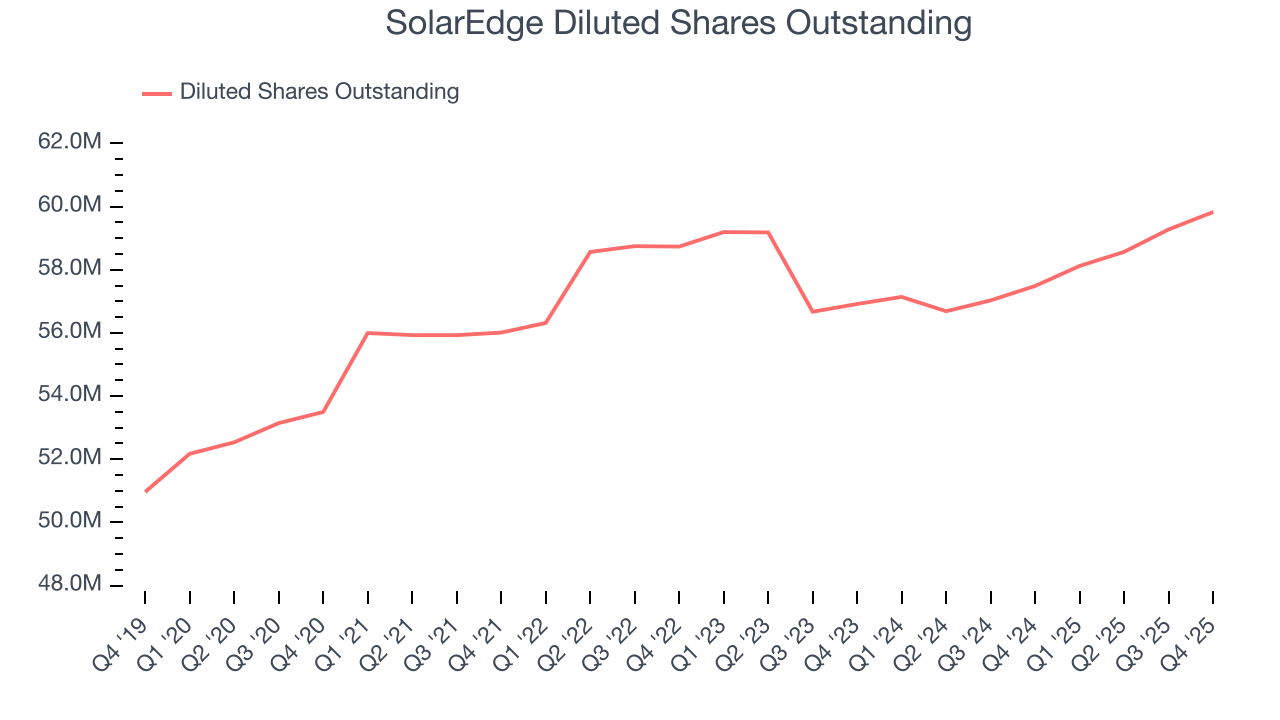
Like with revenue, we analyze EPS over a more recent period because it can provide insight into an emerging theme or development for the business.
For SolarEdge, its two-year annual EPS declines of 61% show it’s continued to underperform. These results were bad no matter how you slice the data.
In Q4, SolarEdge reported adjusted EPS of negative $0.14, up from negative $3.52 in the same quarter last year. This print easily cleared analysts’ estimates, and shareholders should be content with the results. Over the next 12 months, Wall Street is optimistic. Analysts forecast SolarEdge’s full-year EPS of negative $2.40 will flip to positive $0.20.
9. Cash Is King
If you’ve followed StockStory for a while, you know we emphasize free cash flow. Why, you ask? We believe that in the end, cash is king, and you can’t use accounting profits to pay the bills.
While SolarEdge posted positive free cash flow this quarter, the broader story hasn’t been so clean. SolarEdge’s demanding reinvestments have drained its resources over the last five years, putting it in a pinch and limiting its ability to return capital to investors. Its free cash flow margin averaged negative 7.5%, meaning it lit $7.54 of cash on fire for every $100 in revenue.
Taking a step back, an encouraging sign is that SolarEdge’s margin expanded by 3.5 percentage points during that time. Despite its improvement and recent free cash flow generation, we’d like to see more quarters of positive cash flow before recommending the stock.
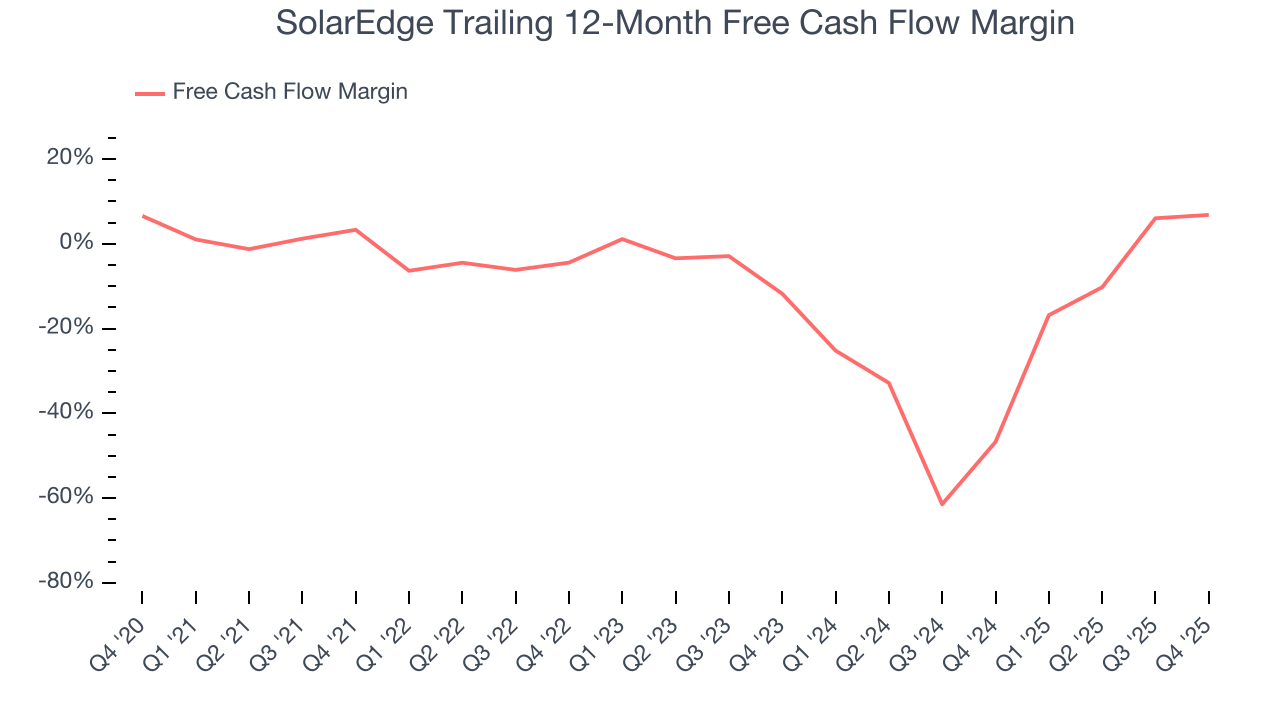
SolarEdge’s free cash flow clocked in at $43.34 million in Q4, equivalent to a 12.9% margin. This cash profitability was in line with the comparable period last year and above its five-year average.
10. Return on Invested Capital (ROIC)
EPS and free cash flow tell us whether a company was profitable while growing its revenue. But was it capital-efficient? Enter ROIC, a metric showing how much operating profit a company generates relative to the money it has raised (debt and equity).
SolarEdge’s five-year average ROIC was negative 14.3%, meaning management lost money while trying to expand the business. Its returns were among the worst in the industrials sector.
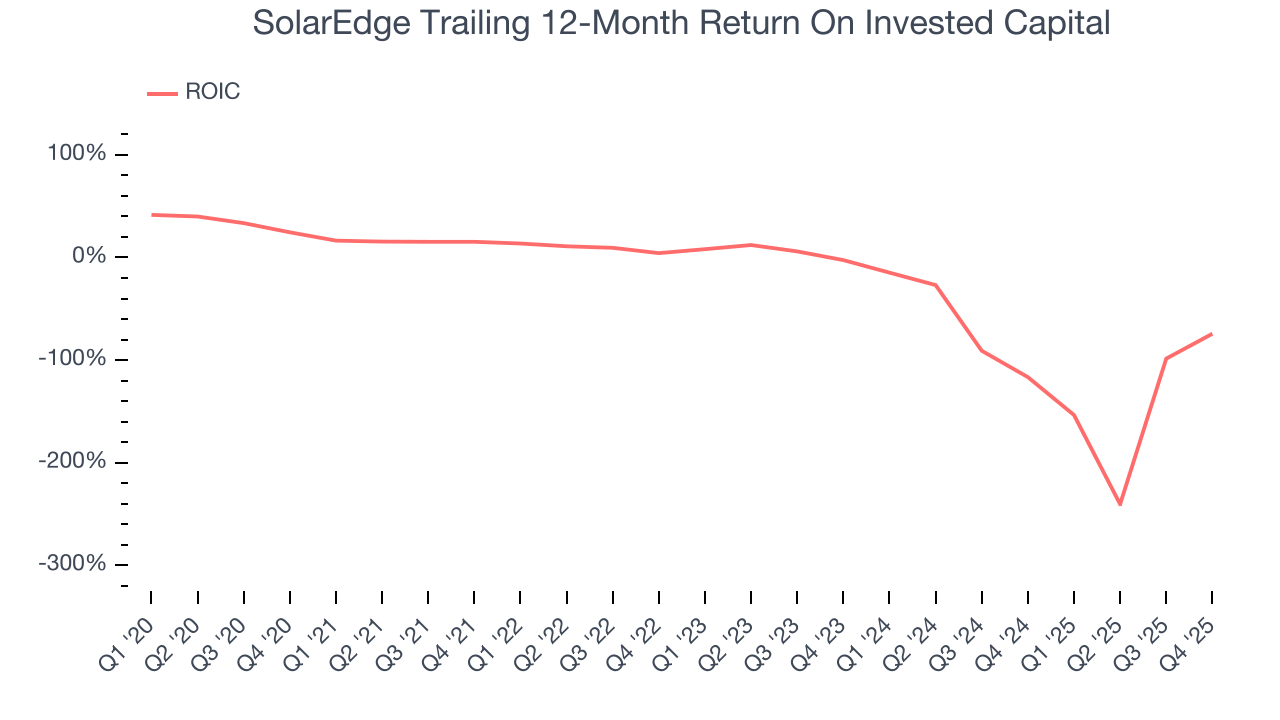
We like to invest in businesses with high returns, but the trend in a company’s ROIC is what often surprises the market and moves the stock price. Unfortunately, SolarEdge’s ROIC has decreased significantly over the last few years. Paired with its already low returns, these declines suggest its profitable growth opportunities are few and far between.
11. Balance Sheet Assessment
Businesses that maintain a cash surplus face reduced bankruptcy risk.
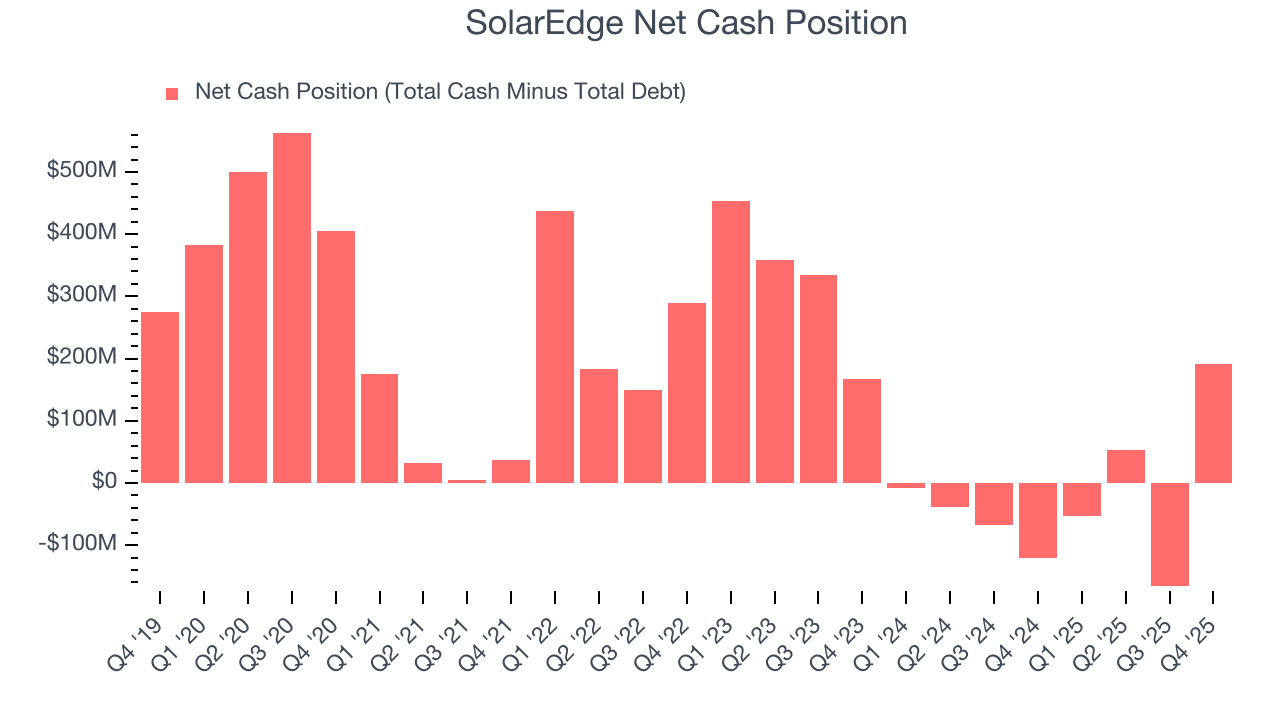
SolarEdge is a well-capitalized company with $577.9 million of cash and $386.8 million of debt on its balance sheet. This $191.2 million net cash position is 8.6% of its market cap and gives it the freedom to borrow money, return capital to shareholders, or invest in growth initiatives. Leverage is not an issue here.
12. Key Takeaways from SolarEdge’s Q4 Results
It was good to see SolarEdge beat analysts’ EPS expectations this quarter. We were also glad its revenue outperformed Wall Street’s estimates. On the other hand, its EBITDA missed. Overall, this print had some key positives. The stock traded up 1.3% to $37.60 immediately following the results.
13. Is Now The Time To Buy SolarEdge?
Updated: February 18, 2026 at 8:07 AM EST
A common mistake we notice when investors are deciding whether to buy a stock or not is that they simply look at the latest earnings results. Business quality and valuation matter more, so we urge you to understand these dynamics as well.
We see the value of companies helping their customers, but in the case of SolarEdge, we’re out. To kick things off, its revenue has declined over the last five years. While its projected EPS for the next year implies the company’s fundamentals will improve, the downside is its diminishing returns show management's prior bets haven't worked out. On top of that, its relatively low ROIC suggests management has struggled to find compelling investment opportunities.
SolarEdge’s P/E ratio based on the next 12 months is 186.3x. This valuation tells us a lot of optimism is priced in - we think there are better stocks to buy right now.
Wall Street analysts have a consensus one-year price target of $32.52 on the company (compared to the current share price of $37.60), implying they don’t see much short-term potential in SolarEdge.