SS&C (SSNC)
SS&C doesn’t impress us. Its poor returns on capital indicate it barely generated any profits, a must for high-quality companies.― StockStory Analyst Team
1. News


2. Summary
Why SS&C Is Not Exciting
Founded in 1986 as a bridge between technology and financial services, SS&C Technologies (NASDAQ:SSNC) provides software and software-enabled services that help financial firms and healthcare organizations automate complex business processes.
- Below-average returns on capital indicate management struggled to find compelling investment opportunities
- Earnings growth underperformed the sector average over the last five years as its EPS grew by just 7.4% annually
- On the bright side, its excellent adjusted operating margin highlights the strength of its business model


SS&C falls below our quality standards. We’re hunting for superior stocks elsewhere.
Why There Are Better Opportunities Than SS&C


SS&C’s stock price of $71.81 implies a valuation ratio of 10.4x forward P/E. This multiple is cheaper than most business services peers, but we think this is justified.
Cheap stocks can look like great bargains at first glance, but you often get what you pay for. These mediocre businesses often have less earnings power, meaning there is more reliance on a re-rating to generate good returns - an unlikely scenario for low-quality companies.
3. SS&C (SSNC) Research Report: Q4 CY2025 Update
Financial software provider SS&C Technologies (NASDAQ:SSNC) announced better-than-expected revenue in Q4 CY2025, with sales up 8% year on year to $1.65 billion. Guidance for next quarter’s revenue was better than expected at $1.63 billion at the midpoint, 0.9% above analysts’ estimates. Its non-GAAP profit of $1.69 per share was 5% above analysts’ consensus estimates.
SS&C (SSNC) Q4 CY2025 Highlights:
- Revenue: $1.65 billion vs analyst estimates of $1.62 billion (8% year-on-year growth, 1.8% beat)
- Adjusted EPS: $1.69 vs analyst estimates of $1.61 (5% beat)
- Adjusted EBITDA: $651.8 million vs analyst estimates of $653.4 million (39.4% margin, in line)
- Revenue Guidance for Q1 CY2026 is $1.63 billion at the midpoint, above analyst estimates of $1.61 billion
- Adjusted EPS guidance for the upcoming financial year 2026 is $6.86 at the midpoint, beating analyst estimates by 3.9%
- Operating Margin: 22.3%, down from 23.4% in the same quarter last year
- Free Cash Flow Margin: 38.3%, up from 27.6% in the same quarter last year
- Market Capitalization: $17.98 billion
Company Overview
Founded in 1986 as a bridge between technology and financial services, SS&C Technologies (NASDAQ:SSNC) provides software and software-enabled services that help financial firms and healthcare organizations automate complex business processes.
SS&C operates through two main business models: software licensing and software-enabled services. The latter represents the majority of its revenue, where SS&C not only provides the technology but also handles mission-critical processes for clients. For financial services clients, these processes include fund administration, portfolio accounting, transfer agency services, and regulatory compliance reporting.
The company serves a diverse range of financial institutions including hedge funds, private equity firms, asset managers, insurance companies, banks, and wealth managers. For example, a hedge fund might use SS&C's Geneva platform to manage its investment portfolio while outsourcing middle and back-office operations to SS&C GlobeOp, allowing the fund to focus on investment decisions rather than administrative tasks.
In the healthcare sector, SS&C provides claims processing, pharmacy benefit management, and care management solutions to health plans and pharmacy benefit managers. Its DomaniRx platform, developed through a joint venture with Humana and Elevance Health, helps healthcare organizations navigate complex regulatory environments through data analytics.
SS&C's technology stack spans the entire operational lifecycle of its clients, from front-office functions like trading and modeling to middle-office functions such as portfolio management and reporting, and back-office functions including accounting, reconciliation, and compliance reporting.
The company has expanded its capabilities significantly through strategic acquisitions, adding specialized technologies like robotic process automation through Blue Prism and virtual data room services through Intralinks. SS&C maintains a global footprint with approximately 27% of its revenues coming from clients outside North America, allowing it to serve multinational clients with operations across different jurisdictions.
4. Data & Business Process Services
A combination of increasing reliance on data and analytics across various industries and the desire for cost efficiency through outsourcing could mean that companies in this space gain. As functions such as payroll, HR, and credit risk assessment rely on more digitization, key players in the data & business process services industry could be increased demand. On the other hand, the sector faces headwinds from growing regulatory scrutiny on data privacy and security, with laws like GDPR and evolving U.S. regulations potentially limiting data collection and monetization strategies. Additionally, rising cyber threats pose risks to firms handling sensitive personal and financial information, creating outsized headline risk when things go wrong in this area.
In the financial services sector, SS&C competes with FIS, Broadridge Financial Solutions, and BlackRock's eFront in fund administration; Envestnet, Orion, and Addepar in wealth management; and SEI Investments in multiple segments. In healthcare, SS&C faces competition from Evernorth Express Scripts/Cigna, CVS Caremark, and UnitedHealth/OptumRx.
5. Revenue Growth
A company’s long-term sales performance is one signal of its overall quality. Any business can experience short-term success, but top-performing ones enjoy sustained growth for years.
With $6.28 billion in revenue over the past 12 months, SS&C is one of the larger companies in the business services industry and benefits from a well-known brand that influences purchasing decisions.
As you can see below, SS&C grew its sales at a decent 6% compounded annual growth rate over the last five years. This shows its offerings generated slightly more demand than the average business services company, a useful starting point for our analysis.
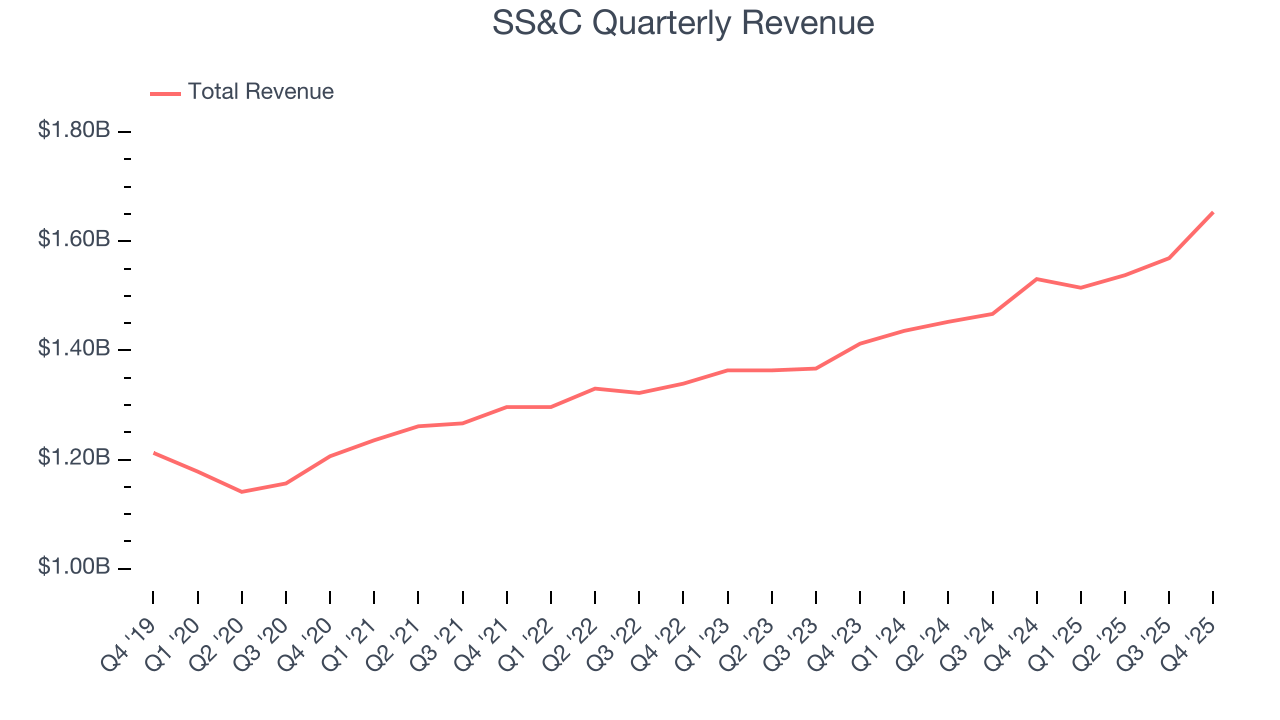
We at StockStory place the most emphasis on long-term growth, but within business services, a half-decade historical view may miss recent innovations or disruptive industry trends. SS&C’s annualized revenue growth of 6.8% over the last two years aligns with its five-year trend, suggesting its demand was stable. 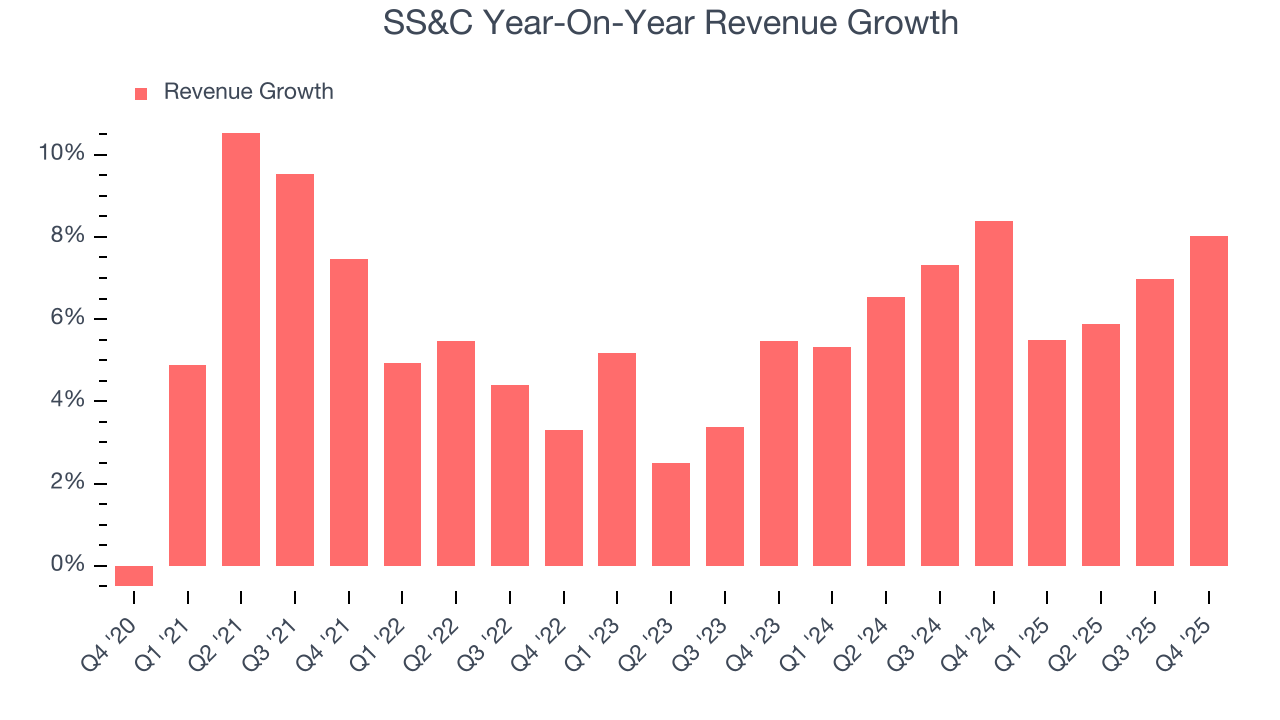
This quarter, SS&C reported year-on-year revenue growth of 8%, and its $1.65 billion of revenue exceeded Wall Street’s estimates by 1.8%. Company management is currently guiding for a 7.5% year-on-year increase in sales next quarter.
Looking further ahead, sell-side analysts expect revenue to grow 5.4% over the next 12 months, similar to its two-year rate. Still, this projection is above the sector average and indicates the market is baking in some success for its newer products and services.
6. Operating Margin
Operating margin is one of the best measures of profitability because it tells us how much money a company takes home after subtracting all core expenses, like marketing and R&D.
SS&C has been a well-oiled machine over the last five years. It demonstrated elite profitability for a business services business, boasting an average operating margin of 22.8%.
Looking at the trend in its profitability, SS&C’s operating margin decreased by 1.7 percentage points over the last five years. This raises questions about the company’s expense base because its revenue growth should have given it leverage on its fixed costs, resulting in better economies of scale and profitability.
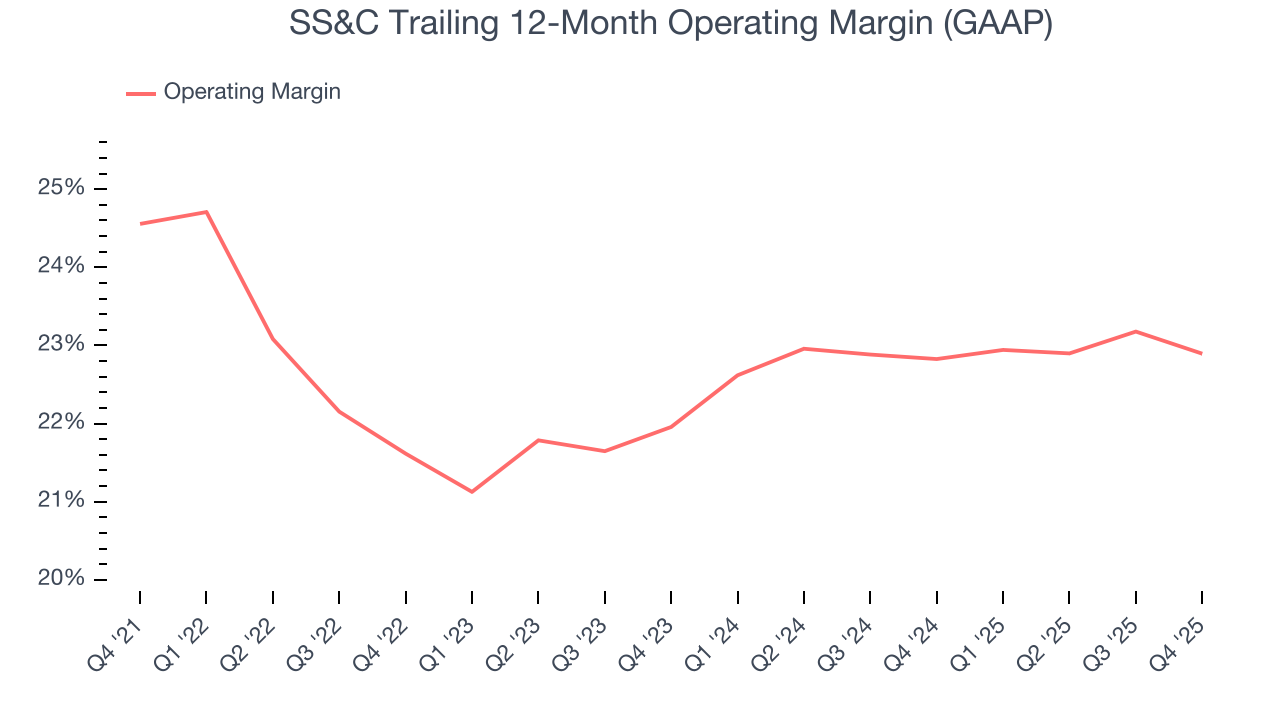
This quarter, SS&C generated an operating margin profit margin of 22.3%, down 1.1 percentage points year on year. This reduction is quite minuscule and indicates the company’s overall cost structure has been relatively stable.
7. Earnings Per Share
We track the long-term change in earnings per share (EPS) for the same reason as long-term revenue growth. Compared to revenue, however, EPS highlights whether a company’s growth is profitable.
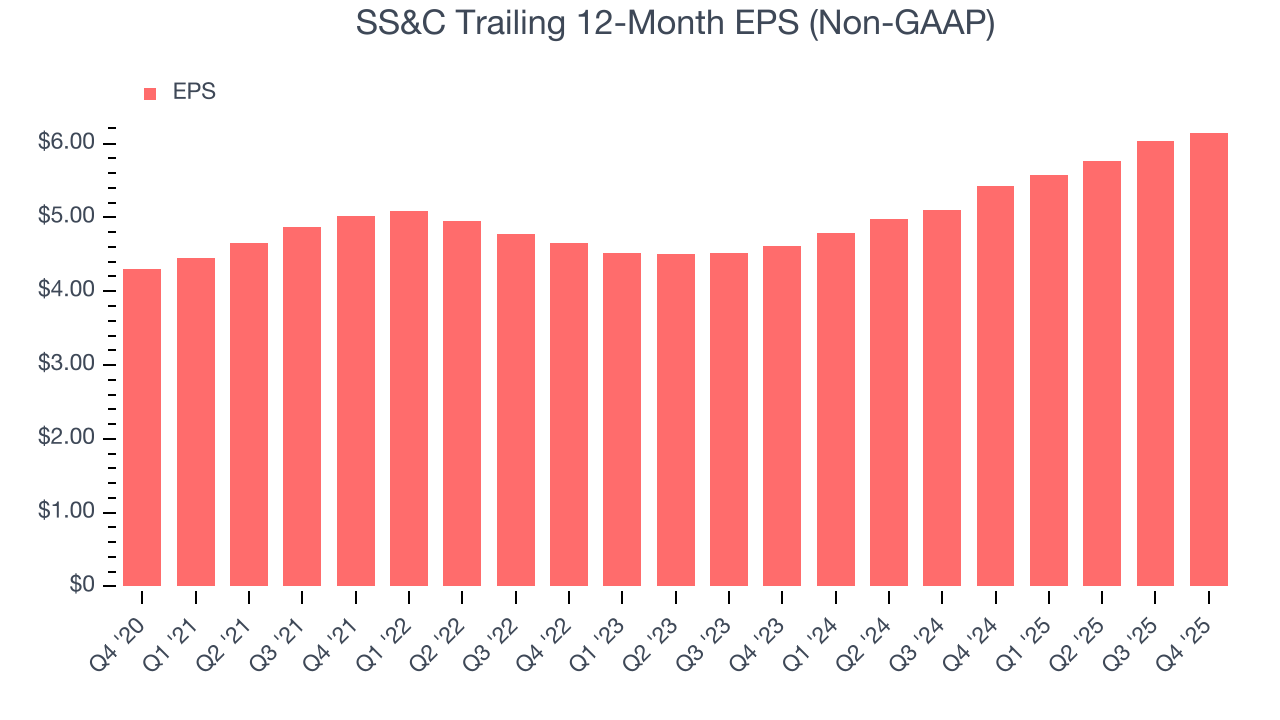
SS&C’s unimpressive 7.4% annual EPS growth over the last five years aligns with its revenue performance. This tells us it maintained its per-share profitability as it expanded.
Like with revenue, we analyze EPS over a shorter period to see if we are missing a change in the business.
For SS&C, its two-year annual EPS growth of 15.4% was higher than its five-year trend. This acceleration made it one of the faster-growing business services companies in recent history.
In Q4, SS&C reported adjusted EPS of $1.69, up from $1.58 in the same quarter last year. This print beat analysts’ estimates by 5%. Over the next 12 months, Wall Street expects SS&C’s full-year EPS of $6.15 to grow 8%.
8. Cash Is King
Although earnings are undoubtedly valuable for assessing company performance, we believe cash is king because you can’t use accounting profits to pay the bills.
SS&C has shown terrific cash profitability, enabling it to reinvest, return capital to investors, and stay ahead of the competition while maintaining an ample cushion. The company’s free cash flow margin was among the best in the business services sector, averaging 20.8% over the last five years.
Taking a step back, we can see that SS&C’s margin dropped by 1.5 percentage points during that time. It may have ticked higher more recently, but shareholders are likely hoping for its margin to at least revert to its historical level. If the longer-term trend returns, it could signal it is in the middle of an investment cycle.
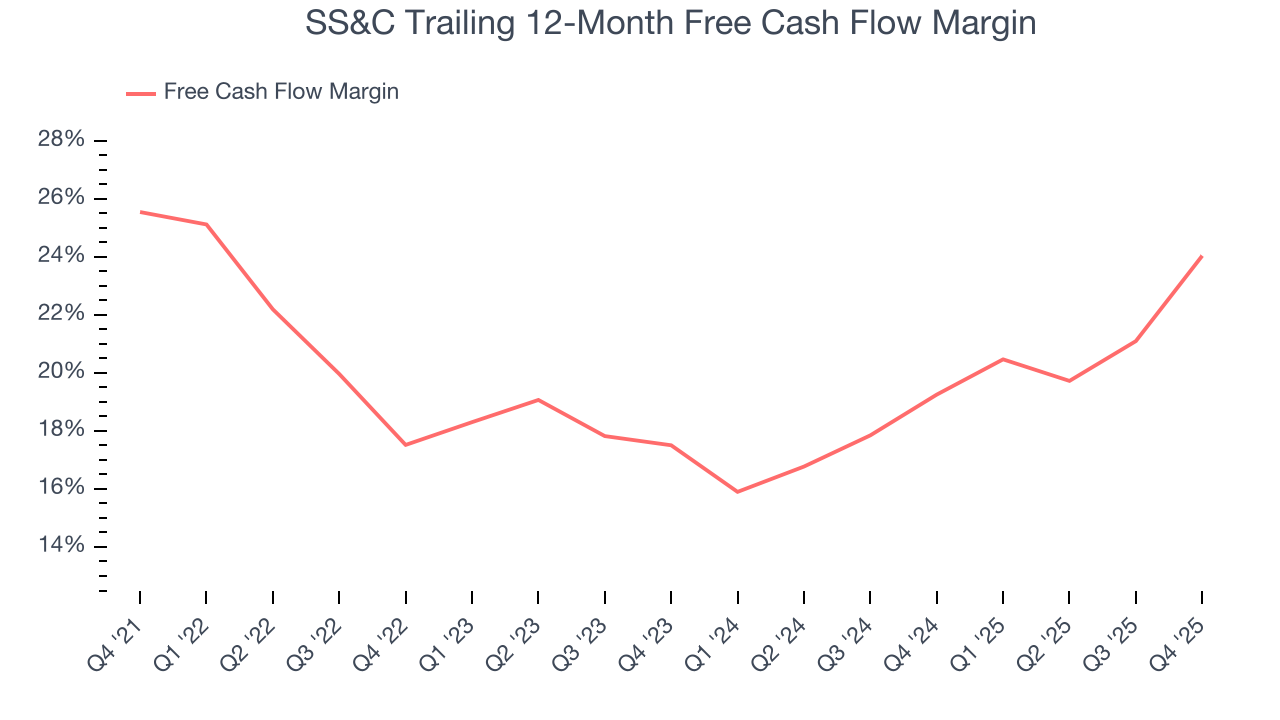
SS&C’s free cash flow clocked in at $633 million in Q4, equivalent to a 38.3% margin. This result was good as its margin was 10.7 percentage points higher than in the same quarter last year, but we wouldn’t read too much into the short term because investment needs can be seasonal, leading to temporary swings. Long-term trends are more important.
9. Return on Invested Capital (ROIC)
EPS and free cash flow tell us whether a company was profitable while growing its revenue. But was it capital-efficient? Enter ROIC, a metric showing how much operating profit a company generates relative to the money it has raised (debt and equity).
SS&C historically did a mediocre job investing in profitable growth initiatives. Its five-year average ROIC was 6.8%, somewhat low compared to the best business services companies that consistently pump out 25%+.
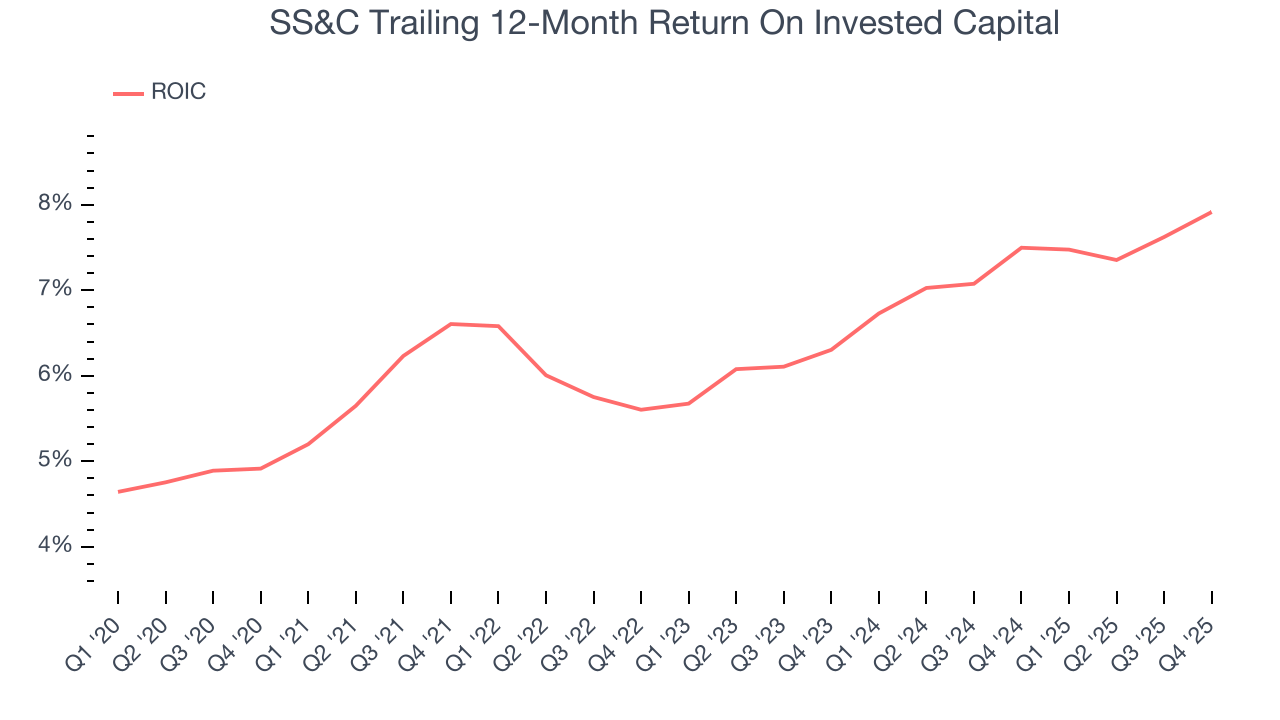
We like to invest in businesses with high returns, but the trend in a company’s ROIC is what often surprises the market and moves the stock price. On average, SS&C’s ROIC increased by 1.6 percentage points annually each year over the last few years. This is a good sign, and if its returns keep rising, there’s a chance it could evolve into an investable business.
10. Balance Sheet Assessment
SS&C reported $466.6 million of cash and $7.65 billion of debt on its balance sheet in the most recent quarter. As investors in high-quality companies, we primarily focus on two things: 1) that a company’s debt level isn’t too high and 2) that its interest payments are not excessively burdening the business.
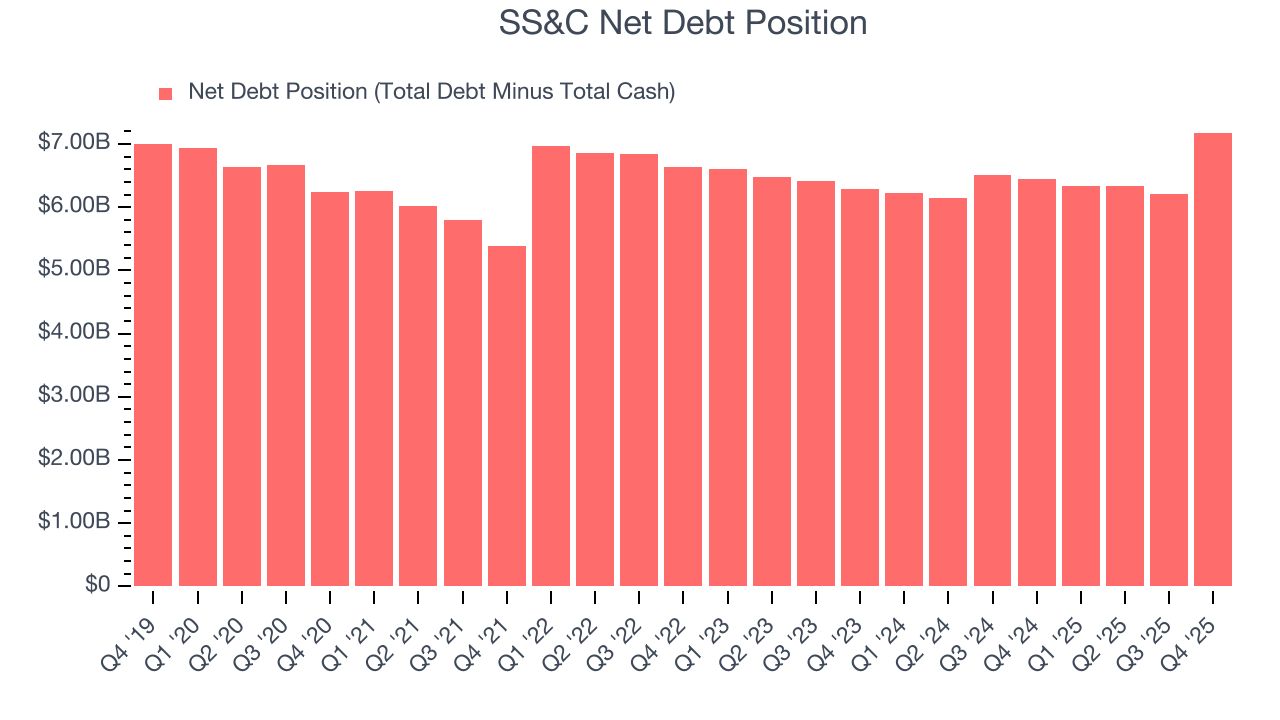
With $2.47 billion of EBITDA over the last 12 months, we view SS&C’s 2.9× net-debt-to-EBITDA ratio as safe. We also see its $410.4 million of annual interest expenses as appropriate. The company’s profits give it plenty of breathing room, allowing it to continue investing in growth initiatives.
11. Key Takeaways from SS&C’s Q4 Results
Revenue and EPS both beat, which is a good start. We enjoyed seeing SS&C beat analysts’ full-year EPS guidance expectations this quarter. We were also glad its full-year revenue guidance exceeded Wall Street’s estimates. Overall, we think this was a solid quarter with some key areas of upside. The stock remained flat at $74.89 immediately after reporting.
12. Is Now The Time To Buy SS&C?
Updated: March 14, 2026 at 12:19 AM EDT
Are you wondering whether to buy SS&C or pass? We urge investors to not only consider the latest earnings results but also longer-term business quality and valuation as well.
SS&C doesn’t top our investment wishlist, but we understand that it’s not a bad business. First off, its revenue growth was good over the last five years and is expected to accelerate over the next 12 months. And while SS&C’s relatively low ROIC suggests management has struggled to find compelling investment opportunities, its powerful free cash flow generation enables it to stay ahead of the competition through consistent reinvestment of profits.
SS&C’s P/E ratio based on the next 12 months is 10.4x. While this valuation is fair, the upside isn’t great compared to the potential downside. We're fairly confident there are better stocks to buy right now.
Wall Street analysts have a consensus one-year price target of $99 on the company (compared to the current share price of $71.81).