
AGCO (AGCO)
We wouldn’t recommend AGCO. Its weak sales growth and declining returns on capital show its demand and profits are shrinking.― StockStory Analyst Team
1. News


2. Summary
Why We Think AGCO Will Underperform
With a history that features both organic growth and acquisitions, AGCO (NYSE:AGCO) designs, manufactures, and sells agricultural machinery and related technology.
- Products and services are facing significant end-market challenges during this cycle as sales have declined by 16.4% annually over the last two years
- Falling earnings per share over the last two years has some investors worried as stock prices ultimately follow EPS over the long term
- Estimated sales growth of 4.5% for the next 12 months is soft and implies weaker demand


AGCO doesn’t live up to our standards. We see more favorable opportunities in the market.
Why There Are Better Opportunities Than AGCO


AGCO is trading at $109.14 per share, or 19.1x forward P/E. This multiple is lower than most industrials companies, but for good reason.
Cheap stocks can look like a great deal at first glance, but they can be value traps. They often have less earnings power, meaning there is more reliance on a re-rating to generate good returns - an unlikely scenario for low-quality companies.
3. AGCO (AGCO) Research Report: Q4 CY2025 Update
Agricultural and farm machinery company AGCO (NYSE:AGCO) reported Q4 CY2025 results topping the market’s revenue expectations, with sales up 1.1% year on year to $2.92 billion. The company’s full-year revenue guidance of $10.55 billion at the midpoint came in 5% above analysts’ estimates. Its GAAP profit of $1.30 per share was 25.5% below analysts’ consensus estimates.
AGCO (AGCO) Q4 CY2025 Highlights:
- Revenue: $2.92 billion vs analyst estimates of $2.66 billion (1.1% year-on-year growth, 9.6% beat)
- EPS (GAAP): $1.30 vs analyst expectations of $1.74 (25.5% miss)
- EPS (GAAP) guidance for the upcoming financial year 2026 is $5.75 at the midpoint, missing analyst estimates by 2.9%
- Operating Margin: 7.9%, up from -9.3% in the same quarter last year
- Free Cash Flow Margin: 23.1%, similar to the same quarter last year
- Market Capitalization: $9.08 billion
Company Overview
With a history that features both organic growth and acquisitions, AGCO (NYSE:AGCO) designs, manufactures, and sells agricultural machinery and related technology.
The company's portfolio encompasses a wide range of agricultural equipment, including tractors, combines, self-propelled sprayers, hay tools, and equipment for foraging, seeding, and tilling. AGCO goes to market with a number of recognizable brands in the agriculture world such as Fendt, Grain & Protein, Massey Ferguson, and Precision Planting. Given trends in digitization, AGCO is investing in adding technology such as sensors and automation to its equipment to help customers such as farmers increase yields, minimize waste, and reduce manual labor.
AGCO's customer base spans smaller, independent farmers to larger-scale commercial agricultural enterprises and agribusinesses. The company distributes its products through a network of thousands of dealers, distributors, and service providers globally.
As mentioned, acquisitions have been an important part of the company's history. Major ones include the 1993 purchase of the North American distribution rights to Massey Ferguson (a global agricultural equipment company) and the 2001 purchase of Ag-Chem Equipment (application equipment).
4. Agricultural Machinery
Agricultural machinery companies are investing to develop and produce more precise machinery, automated systems, and connected equipment that collects analyzable data to help farmers and other customers improve yields and increase efficiency. On the other hand, agriculture is seasonal and natural disasters or bad weather can impact the entire industry. Additionally, macroeconomic factors such as commodity prices or changes in interest rates–which dictate the willingness of these companies or their customers to invest–can impact demand for agricultural machinery.
AGCO’s peers and competitors include Deere (NYSE:DE) and CNH Industrial (NYSE:CNH).
5. Revenue Growth
A company’s long-term performance is an indicator of its overall quality. Any business can have short-term success, but a top-tier one grows for years. Unfortunately, AGCO’s 2% annualized revenue growth over the last five years was sluggish. This was below our standards and is a poor baseline for our analysis.
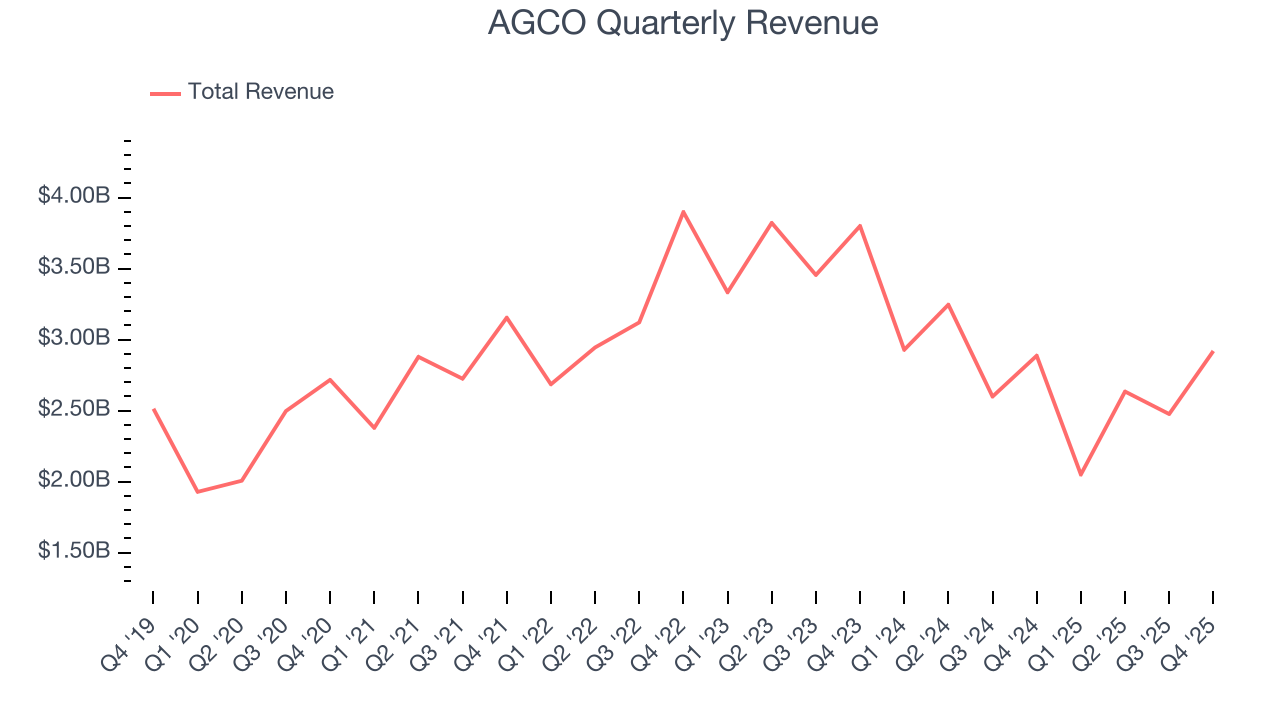
We at StockStory place the most emphasis on long-term growth, but within industrials, a half-decade historical view may miss cycles, industry trends, or a company capitalizing on catalysts such as a new contract win or a successful product line. AGCO’s performance shows it grew in the past but relinquished its gains over the last two years, as its revenue fell by 16.4% annually. AGCO isn’t alone in its struggles as the Agricultural Machinery industry experienced a cyclical downturn, with many similar businesses observing lower sales at this time. 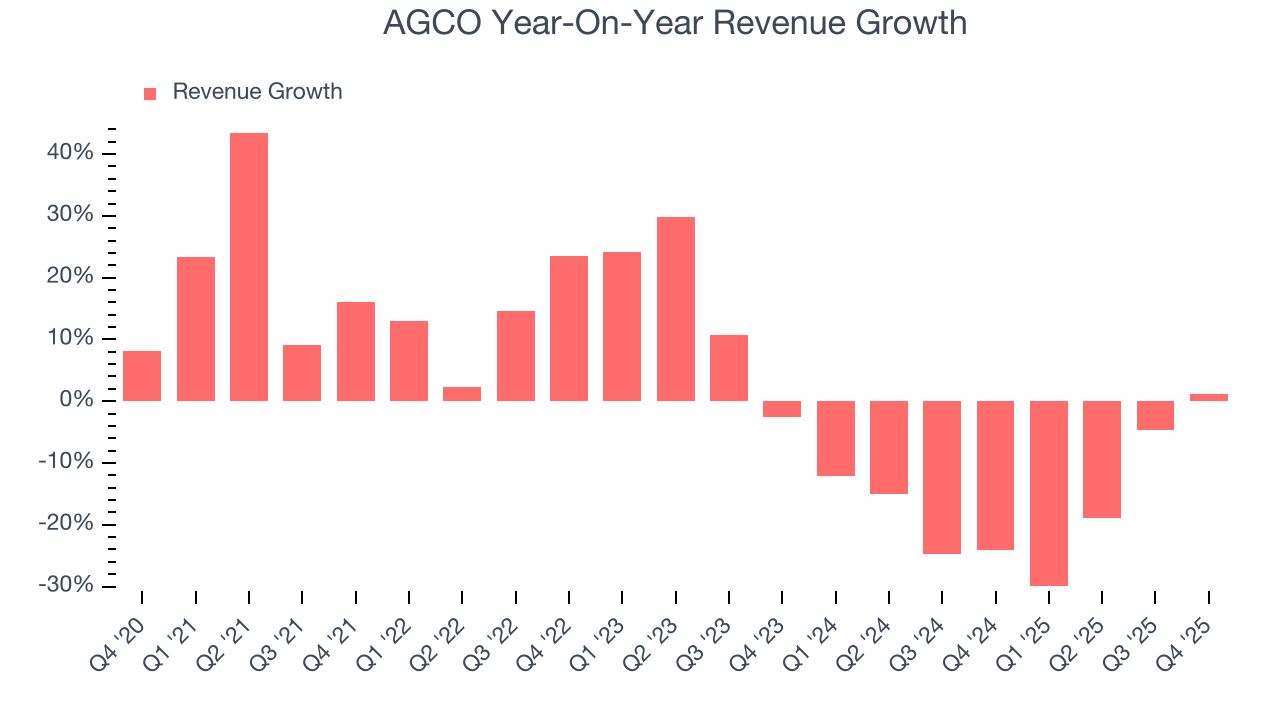
This quarter, AGCO reported modest year-on-year revenue growth of 1.1% but beat Wall Street’s estimates by 9.6%.
Looking ahead, sell-side analysts expect revenue to remain flat over the next 12 months. While this projection implies its newer products and services will catalyze better top-line performance, it is still below the sector average.
6. Gross Margin & Pricing Power
At StockStory, we prefer high gross margin businesses because they indicate the company has pricing power or differentiated products, giving it a chance to generate higher operating profits.
AGCO has bad unit economics for an industrials company, giving it less room to reinvest and develop new offerings. As you can see below, it averaged a 24.7% gross margin over the last five years. That means AGCO paid its suppliers a lot of money ($75.28 for every $100 in revenue) to run its business. 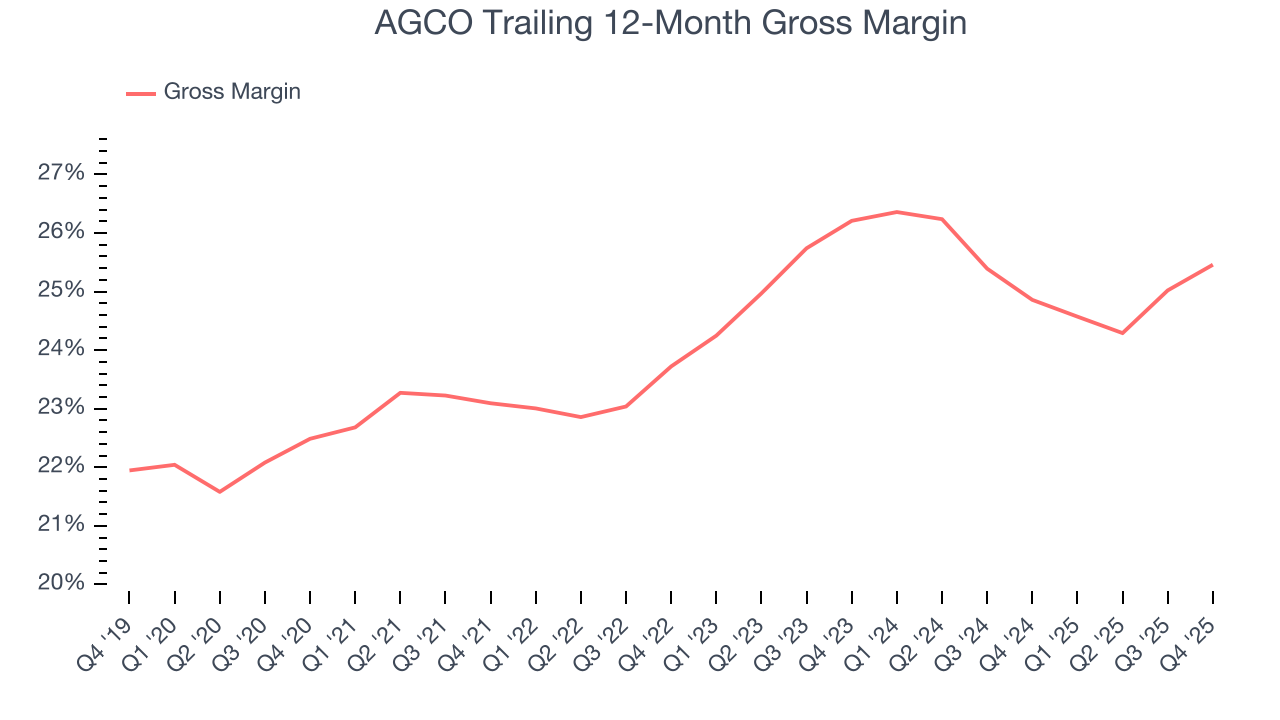
AGCO produced a 25.4% gross profit margin in Q4, up 1.5 percentage points year on year. On a wider time horizon, the company’s full-year margin has remained steady over the past four quarters, suggesting its input costs (such as raw materials and manufacturing expenses) have been stable and it isn’t under pressure to lower prices.
7. Operating Margin
AGCO was profitable over the last five years but held back by its large cost base. Its average operating margin of 7.4% was weak for an industrials business. This result isn’t too surprising given its low gross margin as a starting point.
Looking at the trend in its profitability, AGCO’s operating margin decreased by 3.1 percentage points over the last five years. This raises questions about the company’s expense base because its revenue growth should have given it leverage on its fixed costs, resulting in better economies of scale and profitability. AGCO’s performance was poor no matter how you look at it - it shows that costs were rising and it couldn’t pass them onto its customers.
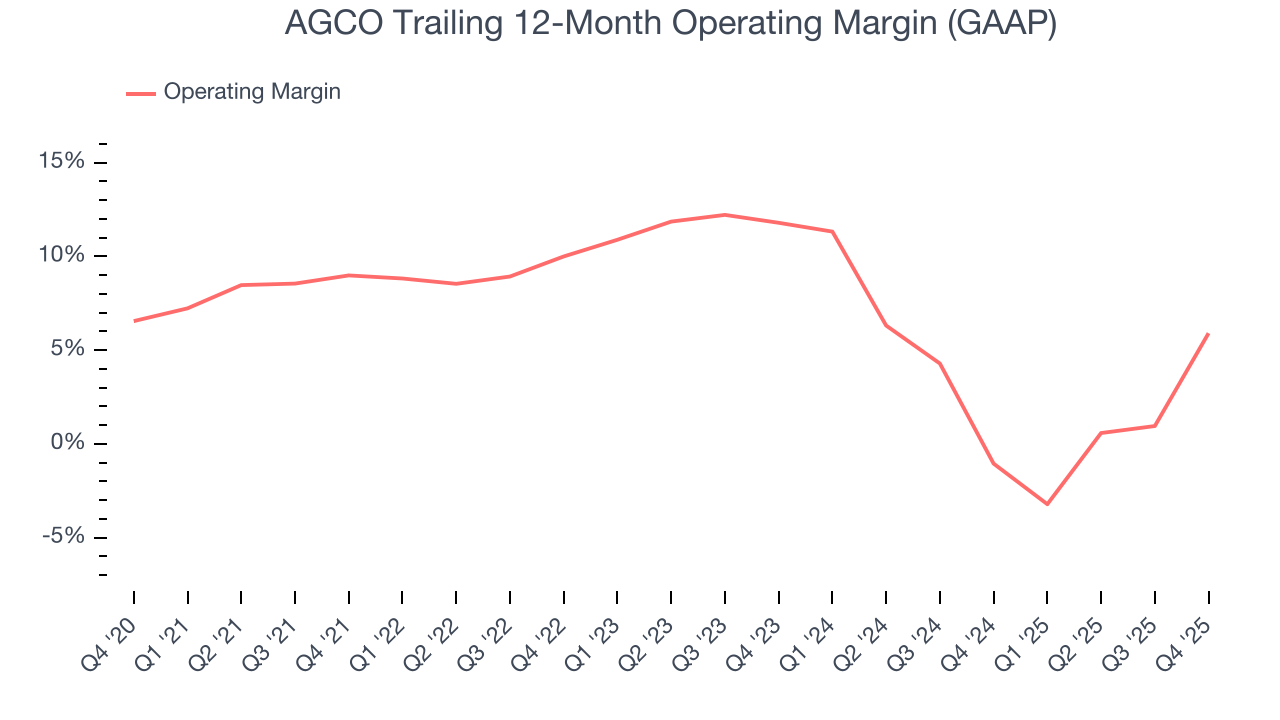
This quarter, AGCO generated an operating margin profit margin of 7.9%, up 17.2 percentage points year on year. The increase was solid, and because its operating margin rose more than its gross margin, we can infer it was more efficient with expenses such as marketing, R&D, and administrative overhead.
8. Earnings Per Share
We track the long-term change in earnings per share (EPS) for the same reason as long-term revenue growth. Compared to revenue, however, EPS highlights whether a company’s growth is profitable.
AGCO’s EPS grew at a solid 11.5% compounded annual growth rate over the last five years, higher than its 2% annualized revenue growth. This tells us the company became more profitable on a per-share basis as it expanded.
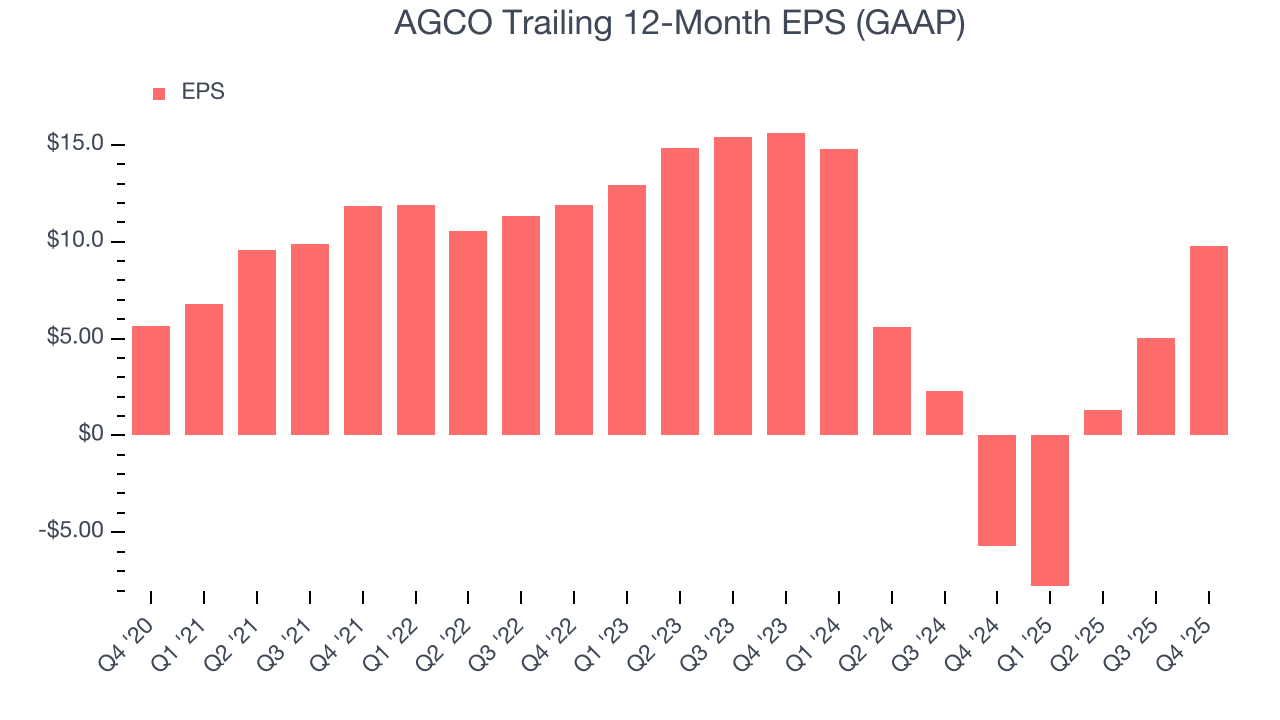
We can take a deeper look into AGCO’s earnings to better understand the drivers of its performance. A five-year view shows that AGCO has repurchased its stock, shrinking its share count by 2.6%. This tells us its EPS outperformed its revenue not because of increased operational efficiency but financial engineering, as buybacks boost per share earnings. 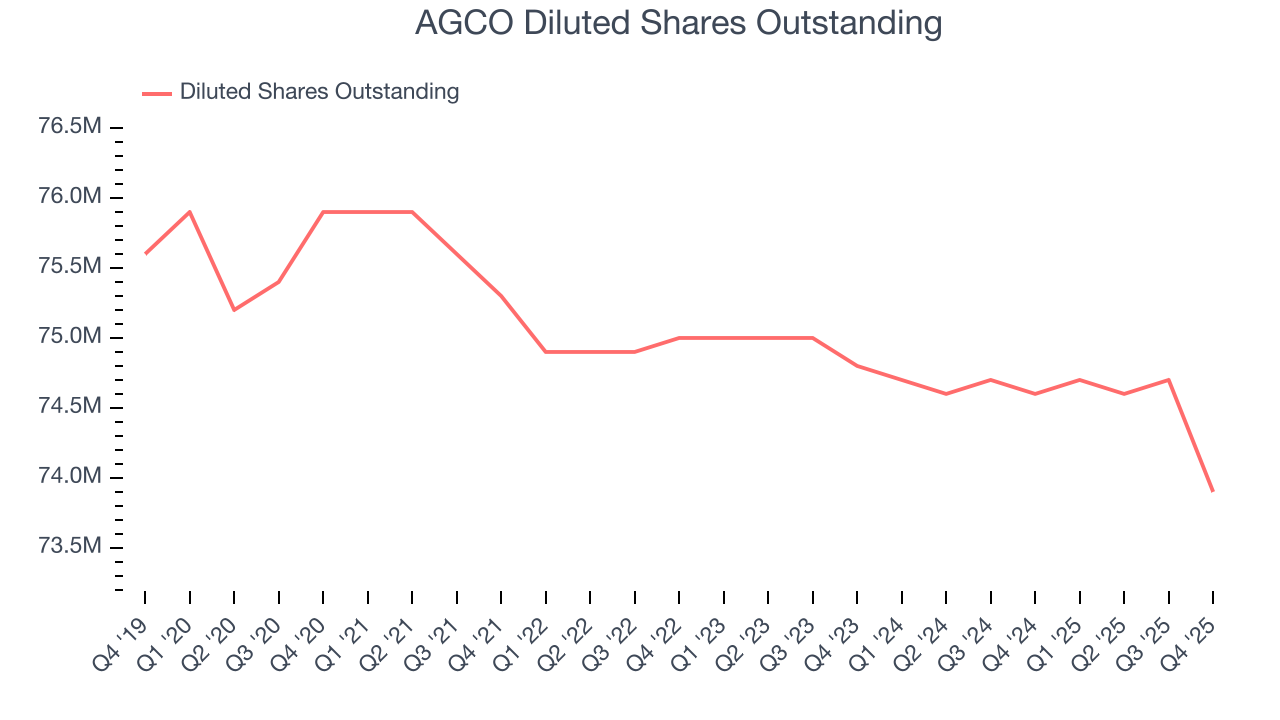
Like with revenue, we analyze EPS over a shorter period to see if we are missing a change in the business.
For AGCO, its two-year annual EPS declines of 21% mark a reversal from its (seemingly) healthy five-year trend. We hope AGCO can return to earnings growth in the future.
In Q4, AGCO reported EPS of $1.30, up from negative $3.43 in the same quarter last year. Despite growing year on year, this print missed analysts’ estimates, but we care more about long-term EPS growth than short-term movements. Over the next 12 months, Wall Street expects AGCO’s full-year EPS of $9.75 to shrink by 41.6%.
9. Cash Is King
Free cash flow isn't a prominently featured metric in company financials and earnings releases, but we think it's telling because it accounts for all operating and capital expenses, making it tough to manipulate. Cash is king.
AGCO has shown weak cash profitability over the last five years, giving the company limited opportunities to return capital to shareholders. Its free cash flow margin averaged 4.1%, subpar for an industrials business.
Taking a step back, an encouraging sign is that AGCO’s margin expanded by 3.6 percentage points during that time. The company’s improvement shows it’s heading in the right direction, and we can see it became a less capital-intensive business because its free cash flow profitability rose while its operating profitability fell.
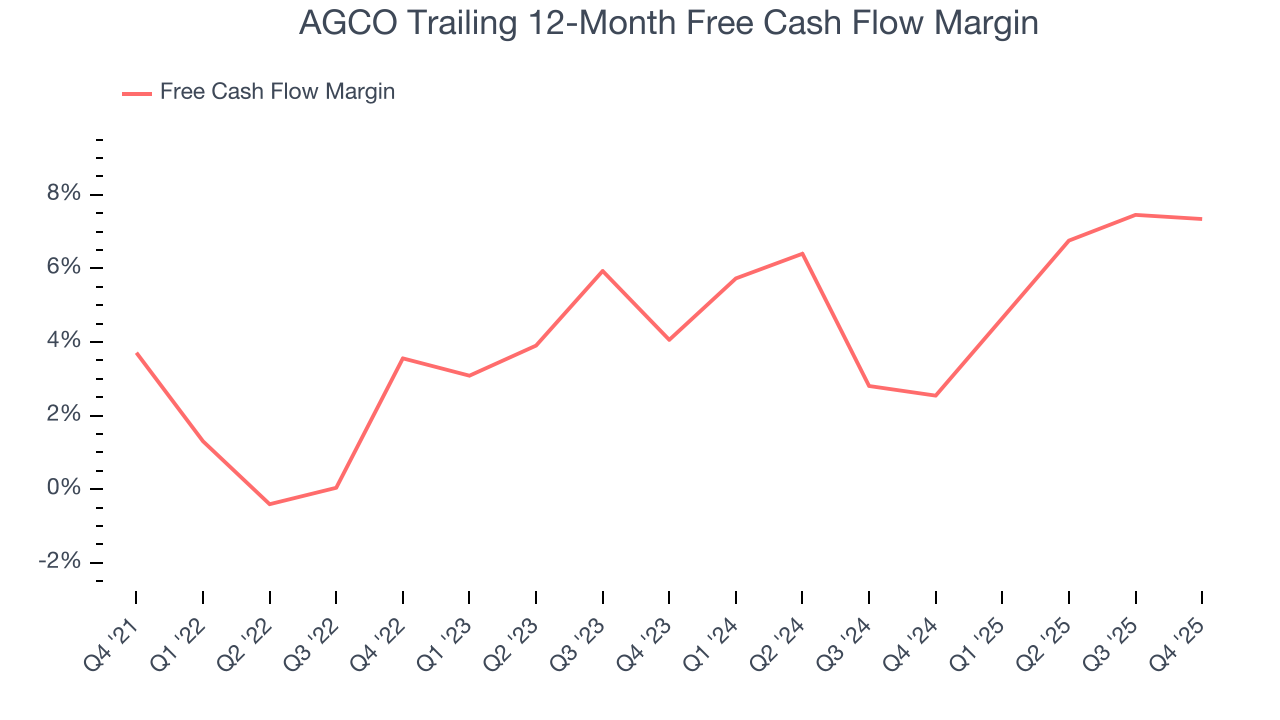
AGCO’s free cash flow clocked in at $675 million in Q4, equivalent to a 23.1% margin. This cash profitability was in line with the comparable period last year and above its five-year average.
10. Return on Invested Capital (ROIC)
EPS and free cash flow tell us whether a company was profitable while growing its revenue. But was it capital-efficient? Enter ROIC, a metric showing how much operating profit a company generates relative to the money it has raised (debt and equity).
Although AGCO hasn’t been the highest-quality company lately because of its poor top-line performance, it historically found a few growth initiatives that worked. Its five-year average ROIC was 12.9%, higher than most industrials businesses.
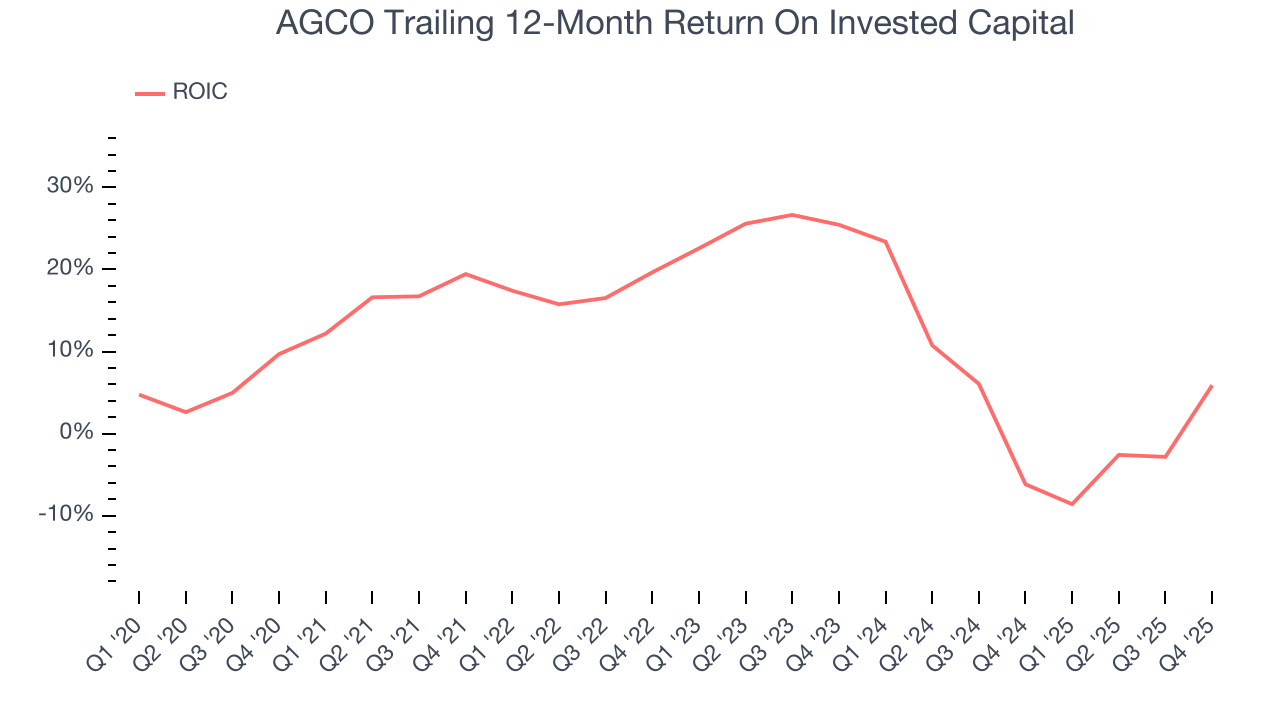
We like to invest in businesses with high returns, but the trend in a company’s ROIC is what often surprises the market and moves the stock price. Over the last few years, AGCO’s ROIC has unfortunately decreased significantly. We like what management has done in the past, but its declining returns are perhaps a symptom of fewer profitable growth opportunities.
11. Balance Sheet Assessment
AGCO reported $861.8 million of cash and $2.44 billion of debt on its balance sheet in the most recent quarter. As investors in high-quality companies, we primarily focus on two things: 1) that a company’s debt level isn’t too high and 2) that its interest payments are not excessively burdening the business.
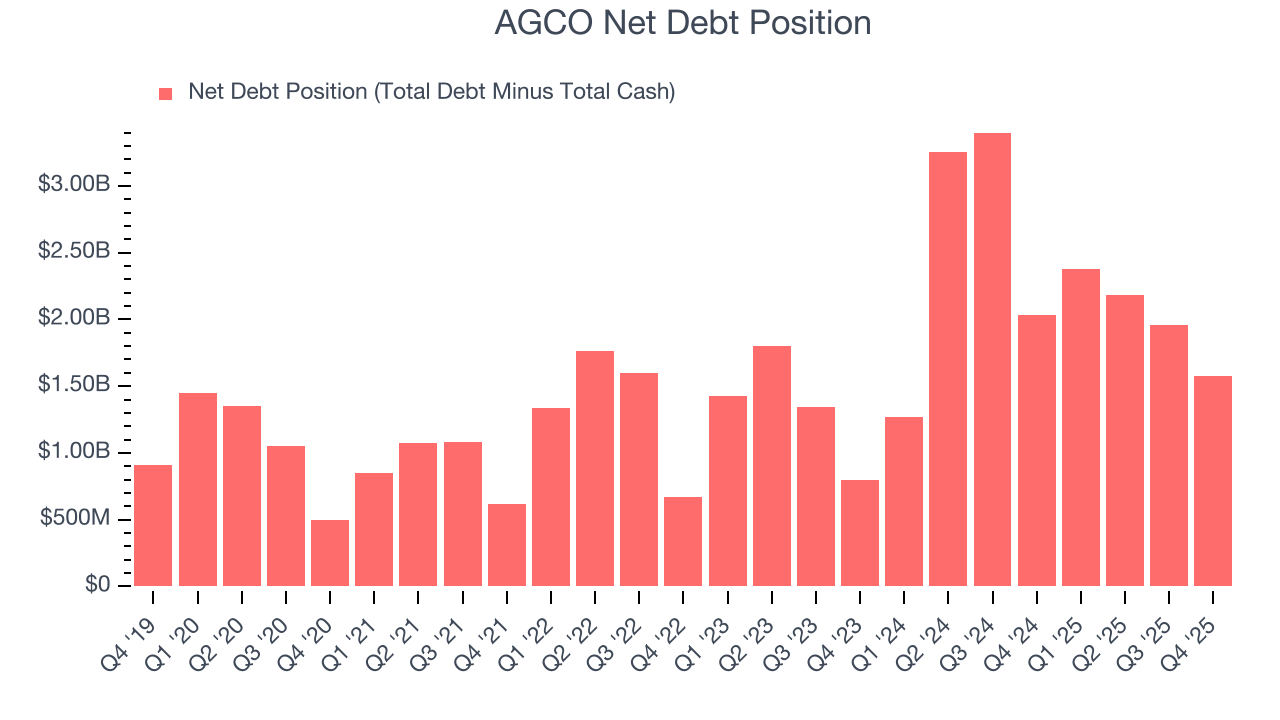
With $1.11 billion of EBITDA over the last 12 months, we view AGCO’s 1.4× net-debt-to-EBITDA ratio as safe. We also see its $37.2 million of annual interest expenses as appropriate. The company’s profits give it plenty of breathing room, allowing it to continue investing in growth initiatives.
12. Key Takeaways from AGCO’s Q4 Results
We were impressed by how significantly AGCO blew past analysts’ revenue expectations this quarter. We were also glad its full-year revenue guidance trumped Wall Street’s estimates. On the other hand, its EPS missed and its full-year EPS guidance fell short of Wall Street’s estimates. Overall, this print was mixed but still had some key positives. The stock traded up 1.9% to $124.04 immediately following the results.
13. Is Now The Time To Buy AGCO?
Updated: March 22, 2026 at 10:55 PM EDT
The latest quarterly earnings matters, sure, but we actually think longer-term fundamentals and valuation matter more. Investors should consider all these pieces before deciding whether or not to invest in AGCO.
AGCO falls short of our quality standards. To kick things off, its revenue growth was weak over the last five years. While its rising cash profitability gives it more optionality, the downside is its diminishing returns show management's prior bets haven't worked out. On top of that, its projected EPS for the next year is lacking.
AGCO’s P/E ratio based on the next 12 months is 19.1x. While this valuation is fair, the upside isn’t great compared to the potential downside. There are better stocks to buy right now.
Wall Street analysts have a consensus one-year price target of $128.57 on the company (compared to the current share price of $109.14).
Although the price target is bullish, readers should exercise caution because analysts tend to be overly optimistic. The firms they work for, often big banks, have relationships with companies that extend into fundraising, M&A advisory, and other rewarding business lines. As a result, they typically hesitate to say bad things for fear they will lose out. We at StockStory do not suffer from such conflicts of interest, so we’ll always tell it like it is.