Albany (AIN)
Albany is up against the odds. Its sales have underperformed and its low returns on capital show it has few growth opportunities.― StockStory Analyst Team
1. News

2. Summary
Why We Think Albany Will Underperform
Founded in 1895, Albany (NYSE:AIN) is a global textiles and materials processing company, specializing in machine clothing for paper mills and engineered composite structures for aerospace and other industries.
- Incremental sales over the last five years were much less profitable as its earnings per share fell by 6.5% annually while its revenue grew
- Forecasted revenue decline of 11.1% for the upcoming 12 months implies demand will fall off a cliff
- Annual revenue growth of 1.5% over the last two years was below our standards for the industrials sector


Albany’s quality doesn’t meet our hurdle. We’ve identified better opportunities elsewhere.
Why There Are Better Opportunities Than Albany


Albany’s stock price of $53.57 implies a valuation ratio of 22.6x forward P/E. This multiple expensive for its subpar fundamentals.
Paying a premium for high-quality companies with strong long-term earnings potential is preferable to owning challenged businesses with questionable prospects. That helps the prudent investor sleep well at night.
3. Albany (AIN) Research Report: Q4 CY2025 Update
Industrial equipment and engineered products manufacturer Albany (NYSE:AIN) reported Q4 CY2025 results topping the market’s revenue expectations, with sales up 12% year on year to $321.2 million. Its non-GAAP profit of $0.65 per share was 7.4% below analysts’ consensus estimates.
Albany (AIN) Q4 CY2025 Highlights:
- Revenue: $321.2 million vs analyst estimates of $276.8 million (12% year-on-year growth, 16% beat)
- Adjusted EPS: $0.65 vs analyst expectations of $0.70 (7.4% miss)
- Adjusted EBITDA: $57.3 million vs analyst estimates of $60.36 million (17.8% margin, 5.1% miss)
- Operating Margin: 9.3%, in line with the same quarter last year
- Free Cash Flow Margin: 16%, down from 21% in the same quarter last year
- Market Capitalization: $1.66 billion
Company Overview
Founded in 1895, Albany (NYSE:AIN) is a global textiles and materials processing company, specializing in machine clothing for paper mills and engineered composite structures for aerospace and other industries.
Albany originally focused on the production of felts for papermaking machines. Over the decades, it evolved to encompass a broader range of machine clothing necessary for all phases of paper production. This expansion was fueled by technological advances in materials science and strategic acquisitions.
Today, Albany’s paper machine clothing products include fabrics and belts essential to the paper-making process. As consumable products, these goods are regularly replaced due to wear and tear.
For the aerospace sector, Albany delivers highly engineered composite products for aerospace applications. Notable products include fan blades and cases for the LEAP engine, used in Airbus A320neo and Boeing 737 MAX aircraft. The segment serves end markets such as commercial and defense aerospace, with significant contributions from U.S. government contracts. Albany derives its revenue from long-term contracts that often span multiple years, providing stable and predictable revenue streams.
Moving forward, Albany views its aerospace products as its primary growth engineThe company has historically made acquisitions to boost its aerospace product portfolio, such as its 2016 acquisition of Harris Corp.'s aero-structures division, which makes composites used primarily in airframes.
4. General Industrial Machinery
Automation that increases efficiency and connected equipment that collects analyzable data have been trending, creating new demand for general industrial machinery companies. Those who innovate and create digitized solutions can spur sales and speed up replacement cycles, but all general industrial machinery companies are still at the whim of economic cycles. Consumer spending and interest rates, for example, can greatly impact the industrial production that drives demand for these companies’ offerings.
Competitors offering similar products include Hexcel (NYSE:HXL), Ducommun (NYSE:DCO), and Park Aerospace (NYSE:PKE).
5. Revenue Growth
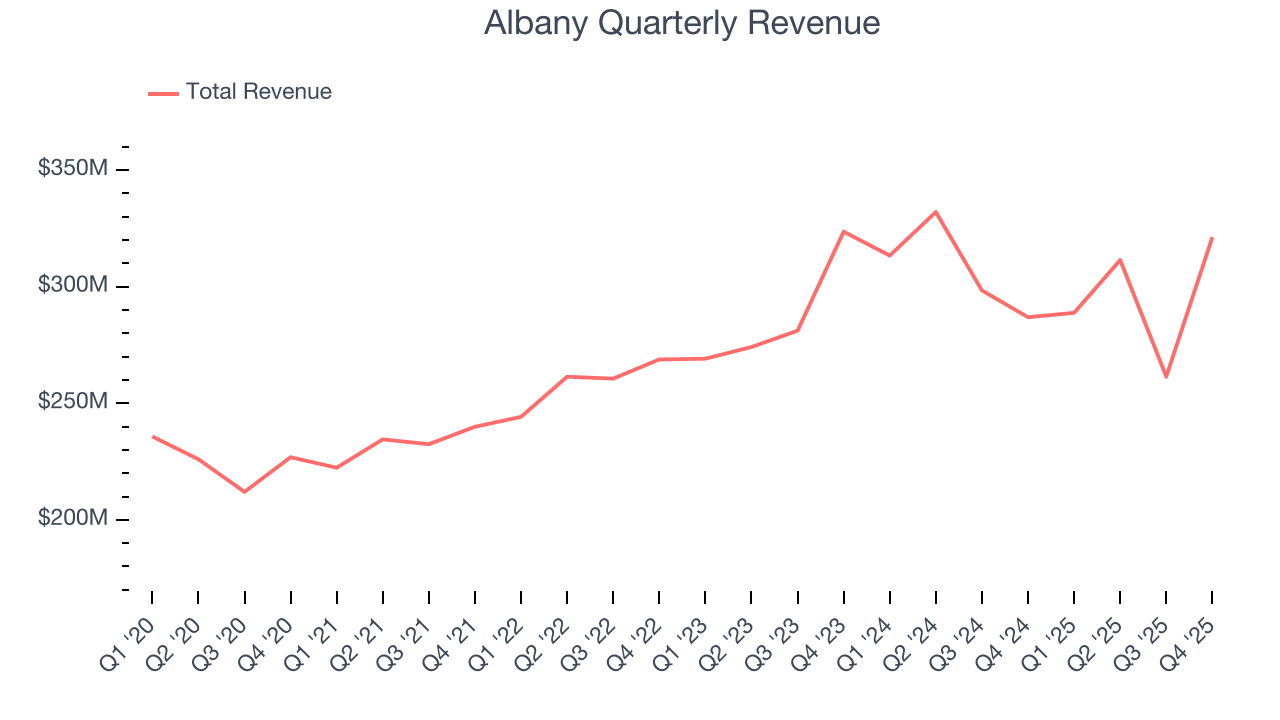
A company’s long-term performance is an indicator of its overall quality. Any business can experience short-term success, but top-performing ones enjoy sustained growth for years. Over the last five years, Albany grew its sales at a tepid 5.6% compounded annual growth rate. This fell short of our benchmark for the industrials sector and is a tough starting point for our analysis.
We at StockStory place the most emphasis on long-term growth, but within industrials, a half-decade historical view may miss cycles, industry trends, or a company capitalizing on catalysts such as a new contract win or a successful product line. Albany’s recent performance shows its demand has slowed as its annualized revenue growth of 1.5% over the last two years was below its five-year trend. We’re wary when companies in the sector see decelerations in revenue growth, as it could signal changing consumer tastes aided by low switching costs. 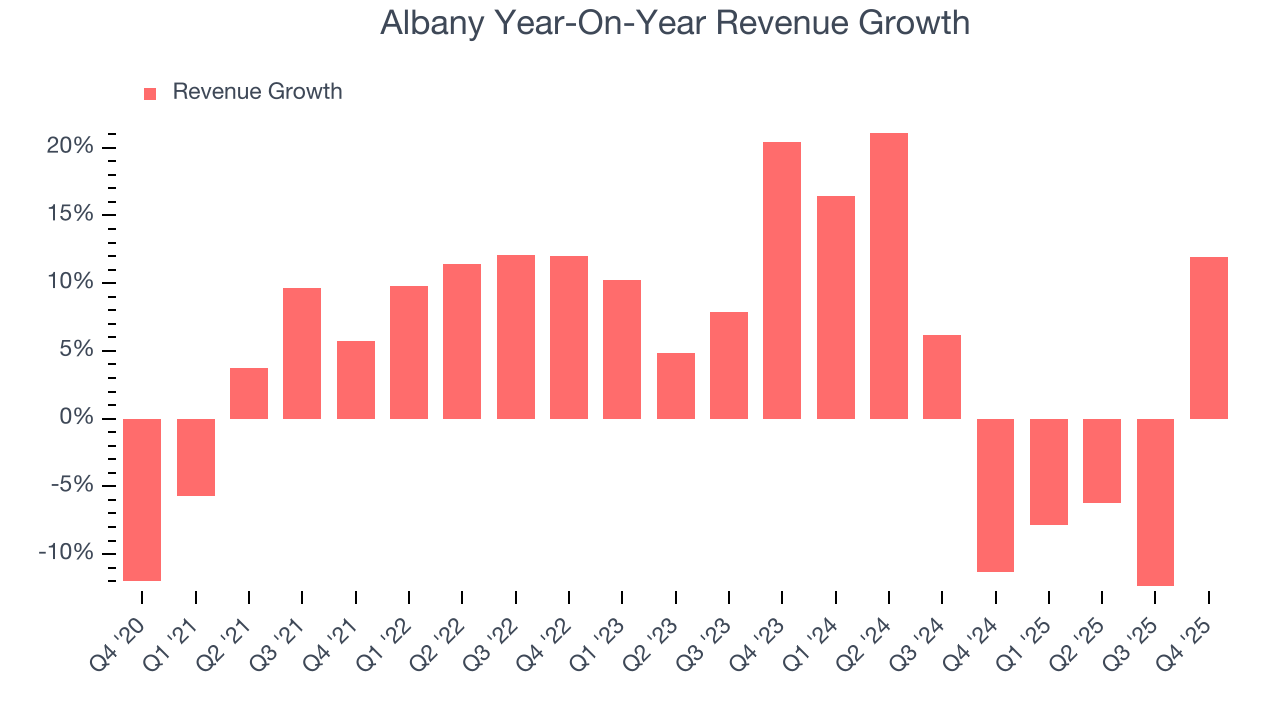
We can better understand the company’s revenue dynamics by analyzing its most important segments, Machine Clothing and Engineered Composites, which are 55.3% and 44.7% of revenue. Over the last two years, Albany’s Machine Clothing revenue (paper manufacturing belts) averaged 4.8% year-on-year declines while its Engineered Composites revenue (aerospace components) averaged 4.3% declines. 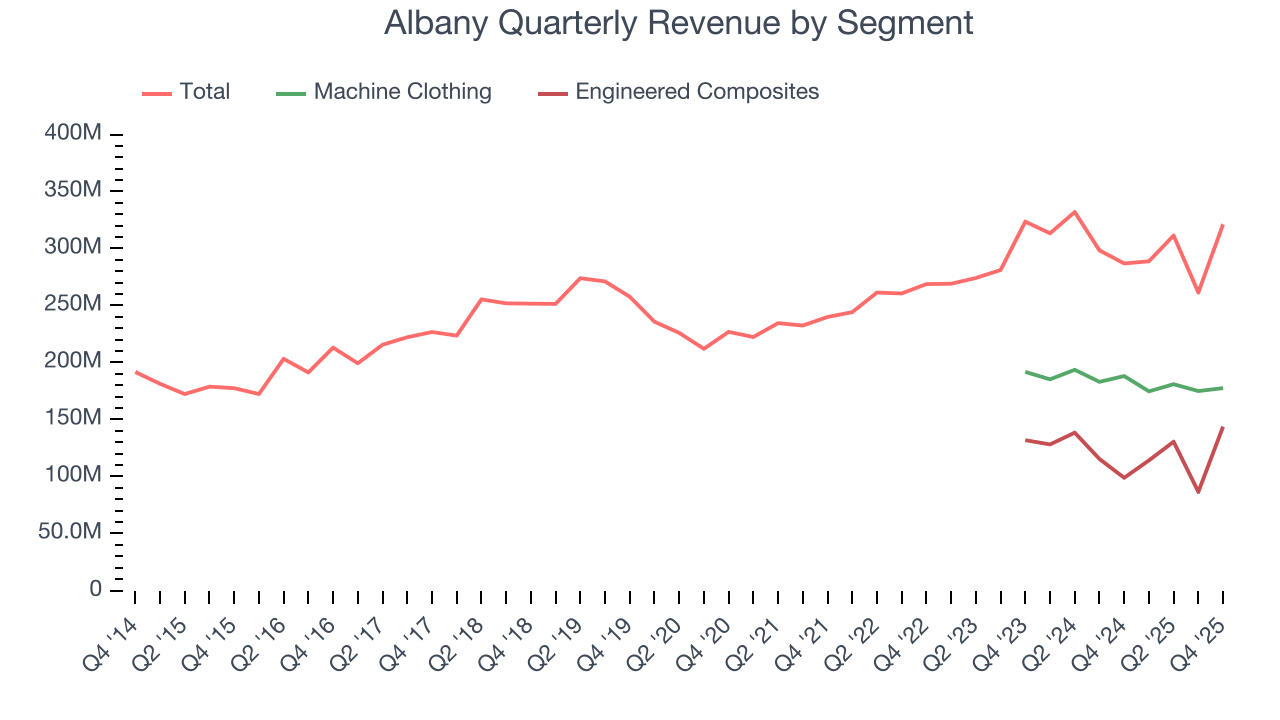
This quarter, Albany reported year-on-year revenue growth of 12%, and its $321.2 million of revenue exceeded Wall Street’s estimates by 16%.
Looking ahead, sell-side analysts expect revenue to decline by 11.1% over the next 12 months, a deceleration versus the last two years. This projection doesn't excite us and indicates its products and services will see some demand headwinds.
6. Gross Margin & Pricing Power
Albany’s gross margin is good compared to other industrials businesses and signals it sells differentiated products, not commodities. As you can see below, it averaged an impressive 33.3% gross margin over the last five years. That means for every $100 in revenue, roughly $33.26 was left to spend on selling, marketing, R&D, and general administrative overhead. 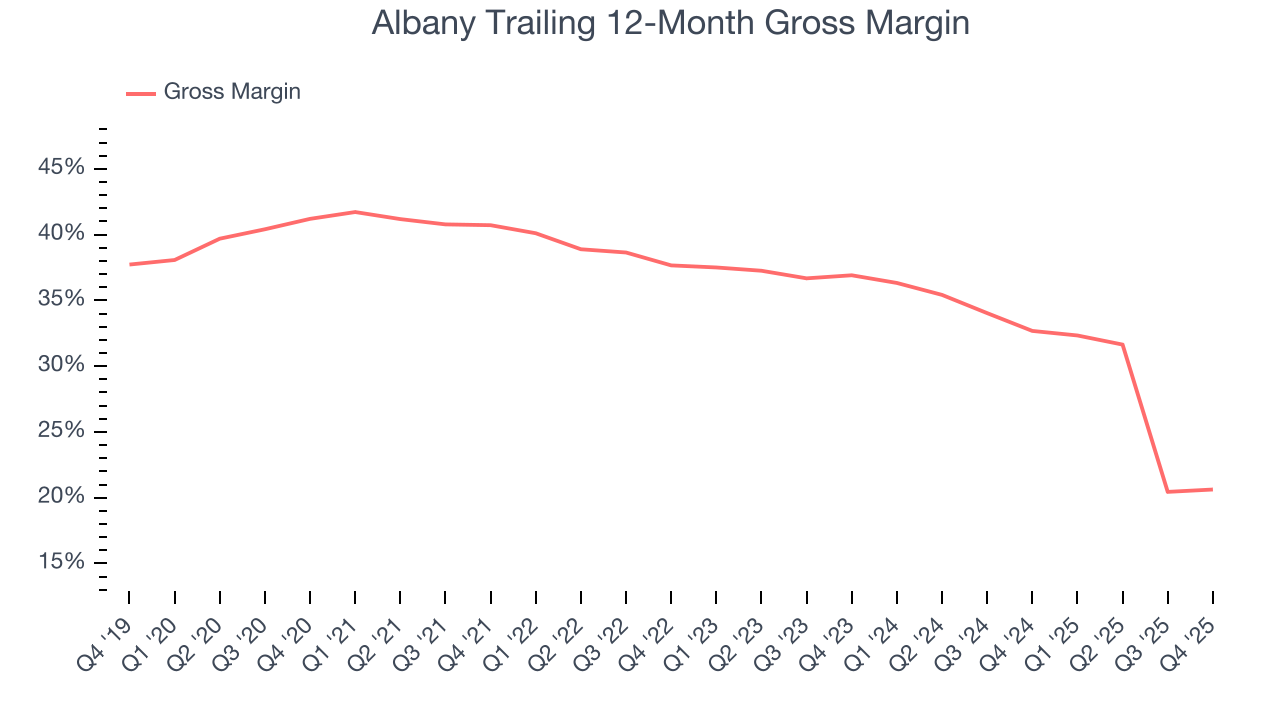
In Q4, Albany produced a 31.1% gross profit margin, in line with the same quarter last year. On a wider time horizon, Albany’s full-year margin has been trending down over the past 12 months, decreasing by 12.1 percentage points. If this move continues, it could suggest deteriorating pricing power and higher input costs (such as raw materials and manufacturing expenses).
7. Operating Margin
Operating margin is an important measure of profitability as it shows the portion of revenue left after accounting for all core expenses – everything from the cost of goods sold to advertising and wages. It’s also useful for comparing profitability across companies with different levels of debt and tax rates because it excludes interest and taxes.
Albany has managed its cost base well over the last five years. It demonstrated solid profitability for an industrials business, producing an average operating margin of 11.3%. This result isn’t too surprising as its gross margin gives it a favorable starting point.
Analyzing the trend in its profitability, Albany’s operating margin decreased by 22.2 percentage points over the last five years. This raises questions about the company’s expense base because its revenue growth should have given it leverage on its fixed costs, resulting in better economies of scale and profitability.
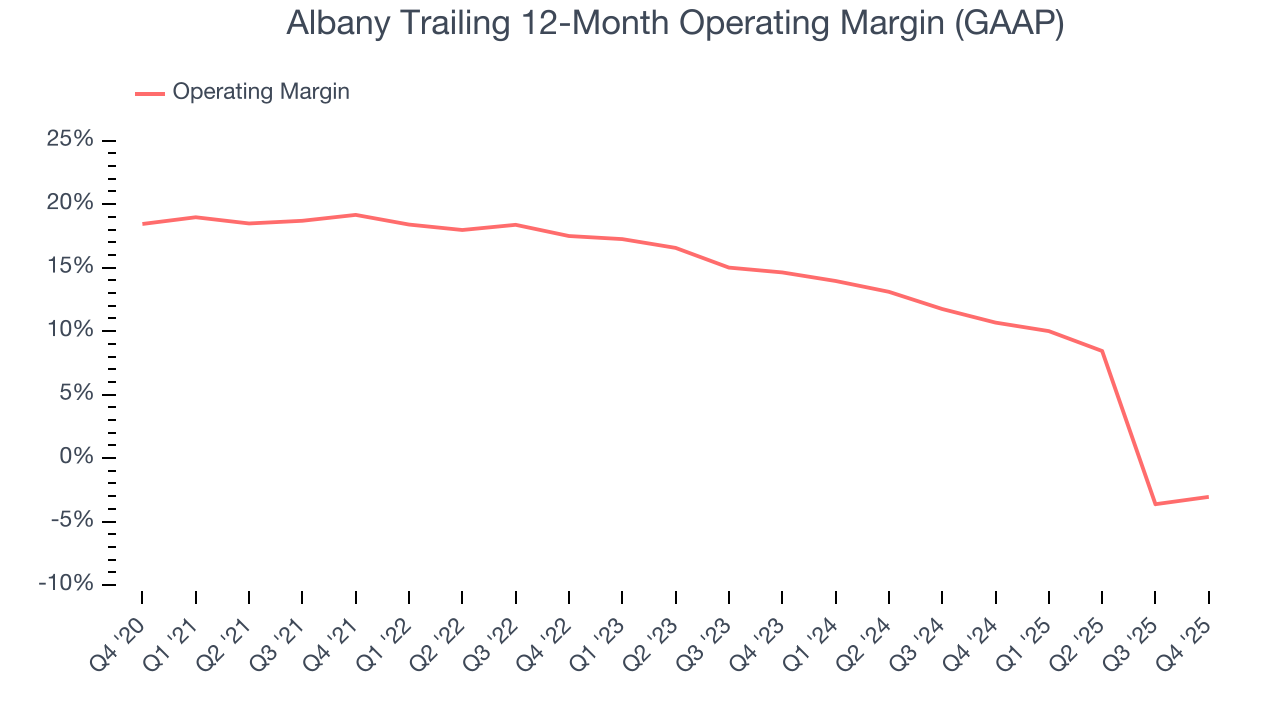
In Q4, Albany generated an operating margin profit margin of 9.3%, in line with the same quarter last year. This indicates the company’s cost structure has recently been stable.
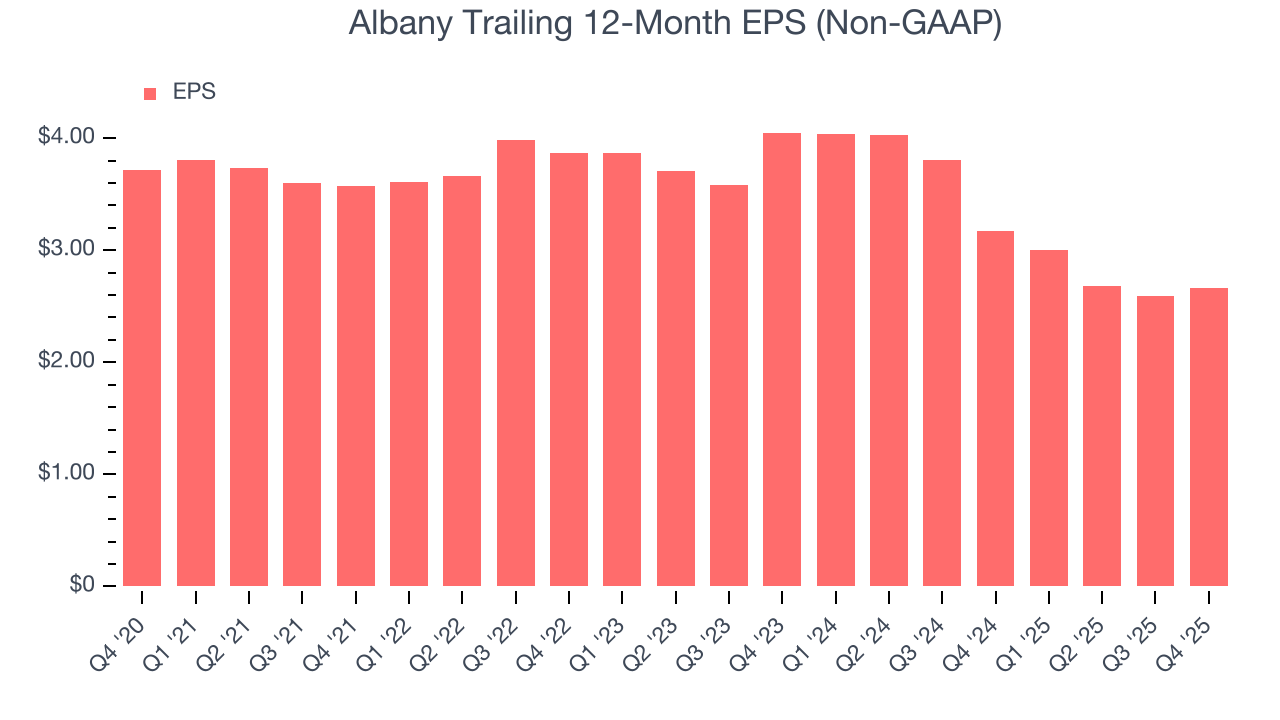
8. Earnings Per Share
Revenue trends explain a company’s historical growth, but the long-term change in earnings per share (EPS) points to the profitability of that growth – for example, a company could inflate its sales through excessive spending on advertising and promotions.
Sadly for Albany, its EPS declined by 6.5% annually over the last five years while its revenue grew by 5.6%. This tells us the company became less profitable on a per-share basis as it expanded due to non-fundamental factors such as interest expenses and taxes.
Diving into the nuances of Albany’s earnings can give us a better understanding of its performance. As we mentioned earlier, Albany’s operating margin was flat this quarter but declined by 22.2 percentage points over the last five years. This was the most relevant factor (aside from the revenue impact) behind its lower earnings; interest expenses and taxes can also affect EPS but don’t tell us as much about a company’s fundamentals.
Like with revenue, we analyze EPS over a more recent period because it can provide insight into an emerging theme or development for the business.
For Albany, its two-year annual EPS declines of 19% show it’s continued to underperform. These results were bad no matter how you slice the data.
In Q4, Albany reported adjusted EPS of $0.65, up from $0.58 in the same quarter last year. Despite growing year on year, this print missed analysts’ estimates. Over the next 12 months, Wall Street expects Albany’s full-year EPS of $2.66 to grow 7.5%.
9. Cash Is King
Although earnings are undoubtedly valuable for assessing company performance, we believe cash is king because you can’t use accounting profits to pay the bills.
Albany has shown impressive cash profitability, enabling it to ride out cyclical downturns more easily while maintaining its investments in new and existing offerings. The company’s free cash flow margin averaged 8.8% over the last five years, better than the broader industrials sector.
Taking a step back, we can see that Albany’s margin dropped by 10.7 percentage points during that time. Continued declines could signal it is in the middle of an investment cycle.
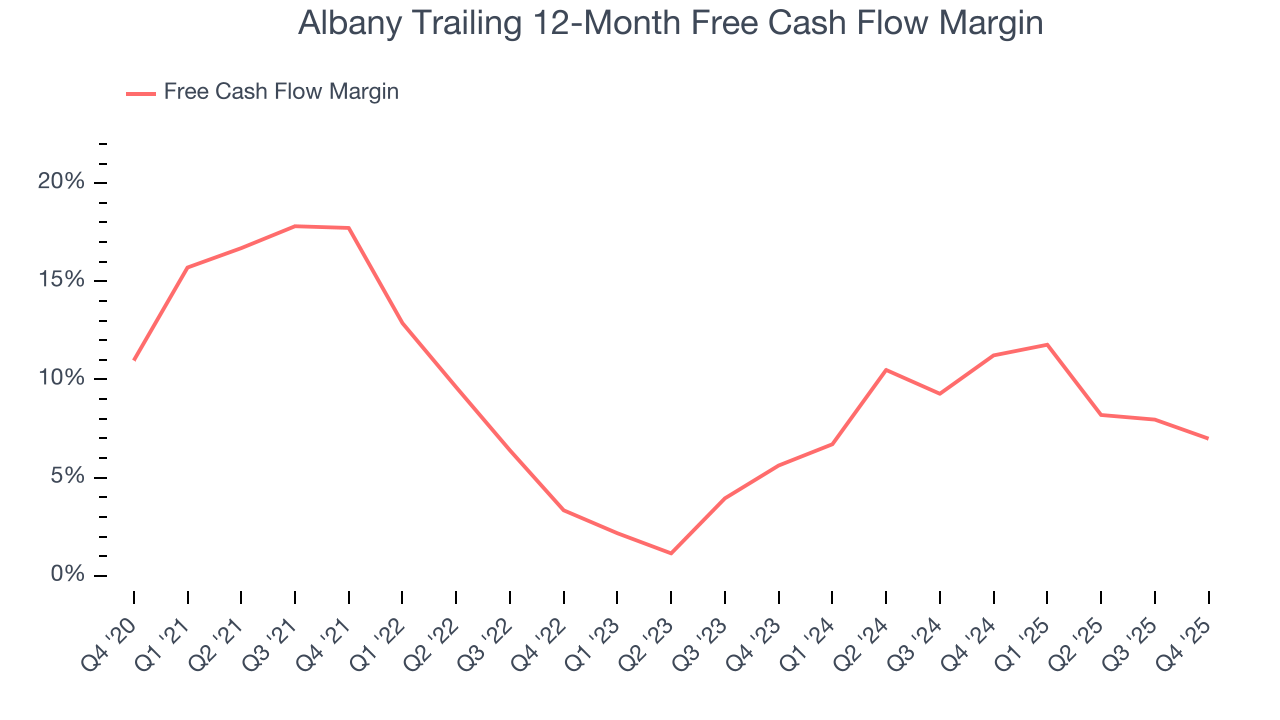
Albany’s free cash flow clocked in at $51.43 million in Q4, equivalent to a 16% margin. The company’s cash profitability regressed as it was 5 percentage points lower than in the same quarter last year, but it’s still above its five-year average. We wouldn’t read too much into this quarter’s decline because investment needs can be seasonal, causing short-term swings. Long-term trends are more important.
10. Return on Invested Capital (ROIC)
EPS and free cash flow tell us whether a company was profitable while growing its revenue. But was it capital-efficient? Enter ROIC, a metric showing how much operating profit a company generates relative to the money it has raised (debt and equity).
Albany historically did a mediocre job investing in profitable growth initiatives. Its five-year average ROIC was 8.9%, somewhat low compared to the best industrials companies that consistently pump out 20%+.
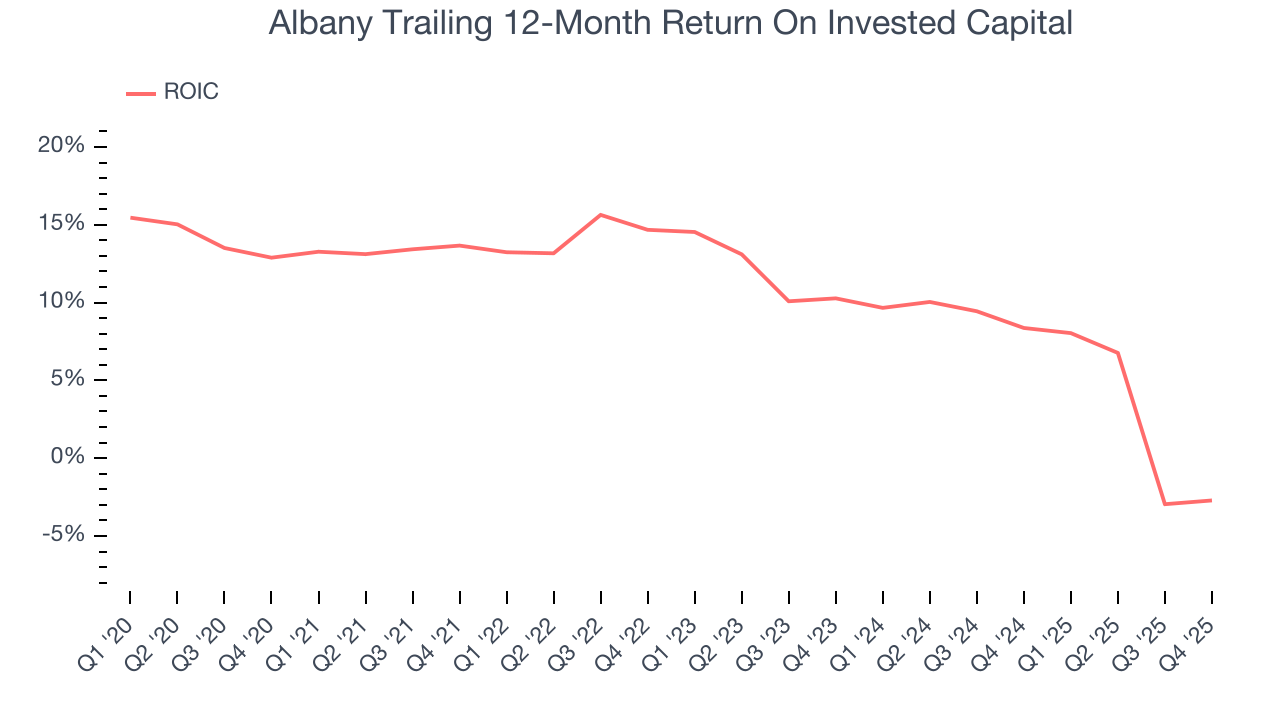
We like to invest in businesses with high returns, but the trend in a company’s ROIC is what often surprises the market and moves the stock price. Unfortunately, Albany’s ROIC has decreased significantly over the last few years. Paired with its already low returns, these declines suggest its profitable growth opportunities are few and far between.
11. Balance Sheet Assessment
Albany reported $112.4 million of cash and $455.7 million of debt on its balance sheet in the most recent quarter. As investors in high-quality companies, we primarily focus on two things: 1) that a company’s debt level isn’t too high and 2) that its interest payments are not excessively burdening the business.
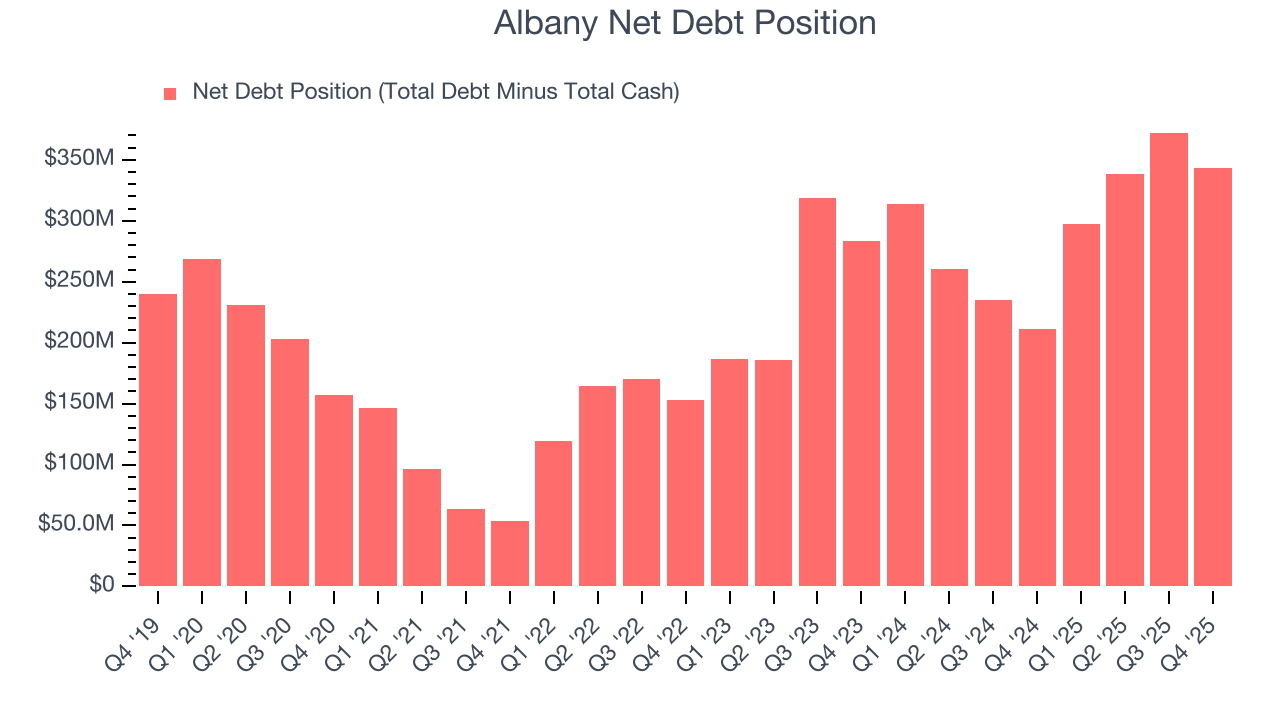
With $221.1 million of EBITDA over the last 12 months, we view Albany’s 1.6× net-debt-to-EBITDA ratio as safe. We also see its $8.8 million of annual interest expenses as appropriate. The company’s profits give it plenty of breathing room, allowing it to continue investing in growth initiatives.
12. Key Takeaways from Albany’s Q4 Results
We were impressed by how significantly Albany blew past analysts’ revenue expectations this quarter. On the other hand, its EBITDA missed and its EPS fell short of Wall Street’s estimates. Overall, this was a mixed quarter. The stock traded up 2.1% to $59.23 immediately after reporting.
13. Is Now The Time To Buy Albany?
Updated: March 15, 2026 at 11:44 PM EDT
The latest quarterly earnings matters, sure, but we actually think longer-term fundamentals and valuation matter more. Investors should consider all these pieces before deciding whether or not to invest in Albany.
We cheer for all companies making their customers lives easier, but in the case of Albany, we’ll be cheering from the sidelines. First off, its revenue growth was uninspiring over the last five years, and analysts expect its demand to deteriorate over the next 12 months. While its sturdy operating margins show it has disciplined cost controls, the downside is its diminishing returns show management's prior bets haven't worked out. On top of that, its projected EPS for the next year is lacking.
Albany’s P/E ratio based on the next 12 months is 22.6x. This valuation tells us a lot of optimism is priced in - you can find more timely opportunities elsewhere.
Wall Street analysts have a consensus one-year price target of $56.25 on the company (compared to the current share price of $53.57).