
L.B. Foster (FSTR)
We’re cautious of L.B. Foster. Its sales have underperformed and its low returns on capital show it has few growth opportunities.― StockStory Analyst Team
1. News


2. Summary
Why We Think L.B. Foster Will Underperform
Founded with a $2,500 loan, L.B. Foster (NASDAQ:FSTR) is a provider of products and services for the transportation and energy infrastructure sectors, including rail products, construction materials, and coating solutions.
- ROIC of 3.7% reflects management’s challenges in identifying attractive investment opportunities
- Flat earnings per share over the last five years lagged its peers
- Muted 1.7% annual revenue growth over the last five years shows its demand lagged behind its industrials peers


L.B. Foster fails to meet our quality criteria. Better stocks can be found in the market.
Why There Are Better Opportunities Than L.B. Foster


At $28.06 per share, L.B. Foster trades at 18.7x forward P/E. Yes, this valuation multiple is lower than that of other industrials peers, but we’ll remind you that you often get what you pay for.
It’s better to pay up for high-quality businesses with higher long-term earnings potential rather than to buy lower-quality stocks because they appear cheap. These challenged businesses often don’t re-rate, a phenomenon known as a “value trap”.
3. L.B. Foster (FSTR) Research Report: Q4 CY2025 Update
Railway infrastructure company L.B. Foster (NASDAQ:FSTR) beat Wall Street’s revenue expectations in Q4 CY2025, with sales up 25.1% year on year to $160.4 million. The company’s full-year revenue guidance of $560 million at the midpoint came in 1.3% above analysts’ estimates. Its GAAP profit of $0.22 per share was 66.9% below analysts’ consensus estimates.
L.B. Foster (FSTR) Q4 CY2025 Highlights:
- Revenue: $160.4 million vs analyst estimates of $158.8 million (25.1% year-on-year growth, 1% beat)
- EPS (GAAP): $0.22 vs analyst expectations of $0.67 (66.9% miss)
- Adjusted EBITDA: $13.68 million vs analyst estimates of $15.05 million (8.5% margin, 9.1% miss)
- EBITDA guidance for the upcoming financial year 2026 is $43.5 million at the midpoint, in line with analyst expectations
- Operating Margin: 4.9%, up from 2.8% in the same quarter last year
- Free Cash Flow Margin: 12.3%, down from 17.4% in the same quarter last year
- Backlog: $189.3 million at quarter end, up 1.8% year on year
- Market Capitalization: $334.6 million
Company Overview
Founded with a $2,500 loan, L.B. Foster (NASDAQ:FSTR) is a provider of products and services for the transportation and energy infrastructure sectors, including rail products, construction materials, and coating solutions.
L.B. Foster initially capitalized on the resale of used rail from abandoned and replaced railroads to serve transportation needs. Over the decades, the company expanded, entering new markets like steel sheet piling in 1926 and later bridge component fabrication in 1967. Significant growth occurred through strategic acquisitions, such as the purchase of Portec Rail Products in 2010, enhancing its rail product offerings and international presence. In recent years, L.B. Foster has continued to diversify, acquiring companies like Skratch Enterprises and Intelligent Video in 2022 to expand into digital display and security solutions to complement its traditional infrastructure and coating businesses.
For the rail industry, L.B. Foster manufactures and distributes a variety of rail products, including track components, track lubricant for friction management, and digital technology services across global markets. This segment includes engineering solutions and aftermarket services that enhance rail and industrial operations, ensuring ongoing demand for maintenance and upgrades.
In the infrastructure industry, the company delivers advanced technologies for the built environment, focusing on precast concrete products, bridge components, and protective coatings for pipelines. L.B. Foster’s precast concrete offerings include buildings for public use, sound walls, and structural components that support civil infrastructure. Additionally, its steel products business provides engineered solutions that maintain and construct critical infrastructure.
Revenue for L.B. Foster is generated from the sale of these engineered products and bolstered by aftermarket services, which provide a steady stream of recurring revenue. These services include maintenance, parts replacement, and system upgrades, which are critical for the longevity and efficiency of the infrastructure supported by their products.
4. General Industrial Machinery
Automation that increases efficiency and connected equipment that collects analyzable data have been trending, creating new demand for general industrial machinery companies. Those who innovate and create digitized solutions can spur sales and speed up replacement cycles, but all general industrial machinery companies are still at the whim of economic cycles. Consumer spending and interest rates, for example, can greatly impact the industrial production that drives demand for these companies’ offerings.
Competitors offering similar products include Trinity Industries (NYSE:TRN), Quanta Services (NYSE:PWR), and Aegion (NASDAQ:AEGN).
5. Revenue Growth
Examining a company’s long-term performance can provide clues about its quality. Even a bad business can shine for one or two quarters, but a top-tier one grows for years. Unfortunately, L.B. Foster’s 1.7% annualized revenue growth over the last five years was sluggish. This fell short of our benchmarks and is a rough starting point for our analysis.
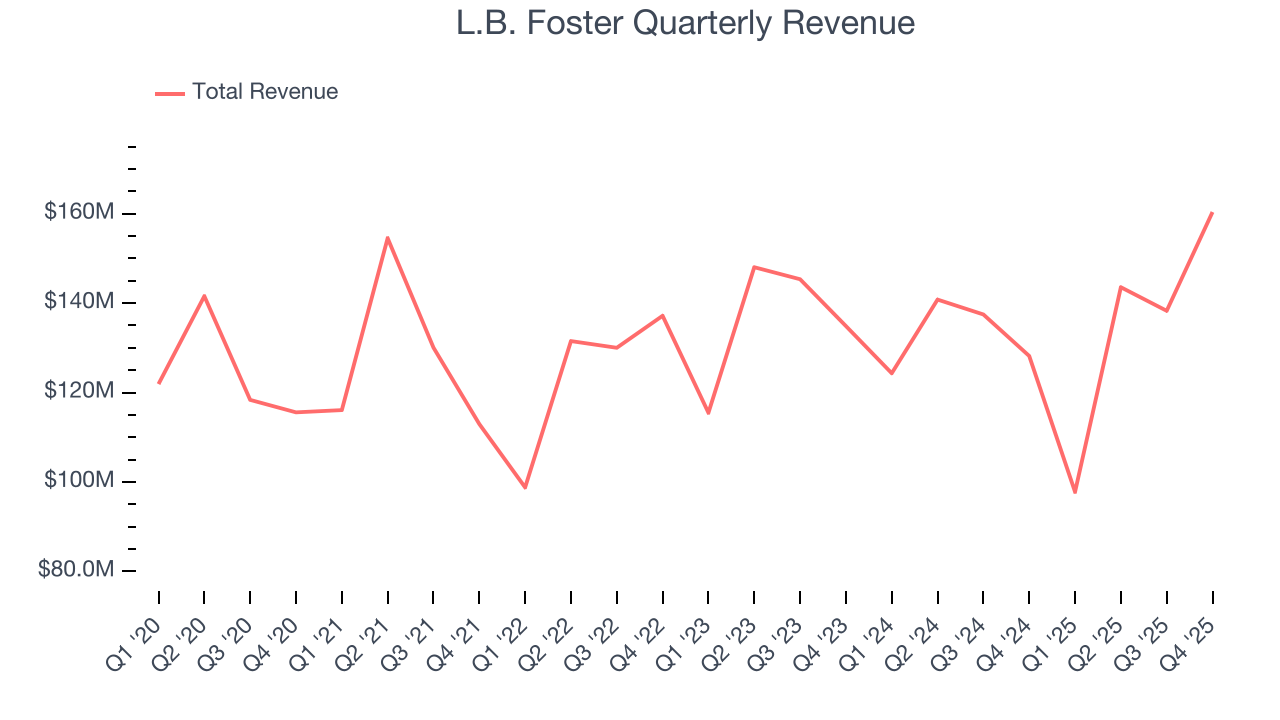
We at StockStory place the most emphasis on long-term growth, but within industrials, a half-decade historical view may miss cycles, industry trends, or a company capitalizing on catalysts such as a new contract win or a successful product line. L.B. Foster’s recent performance shows its demand has slowed as its revenue was flat over the last two years. 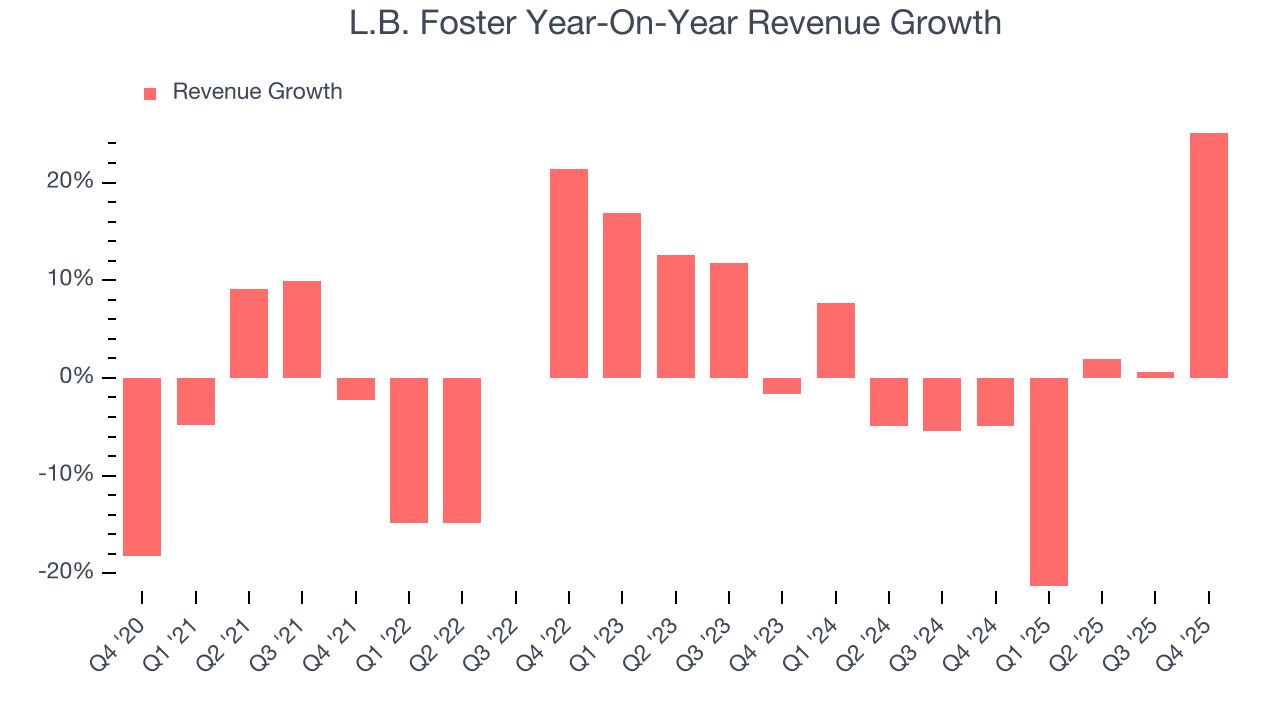
We can dig further into the company’s revenue dynamics by analyzing its backlog, or the value of its outstanding orders that have not yet been executed or delivered. L.B. Foster’s backlog reached $189.3 million in the latest quarter and averaged 4.4% year-on-year growth over the last two years. Because this number is better than its revenue growth, we can see the company accumulated more orders than it could fulfill and deferred revenue to the future. This could imply elevated demand for L.B. Foster’s products and services but raises concerns about capacity constraints. 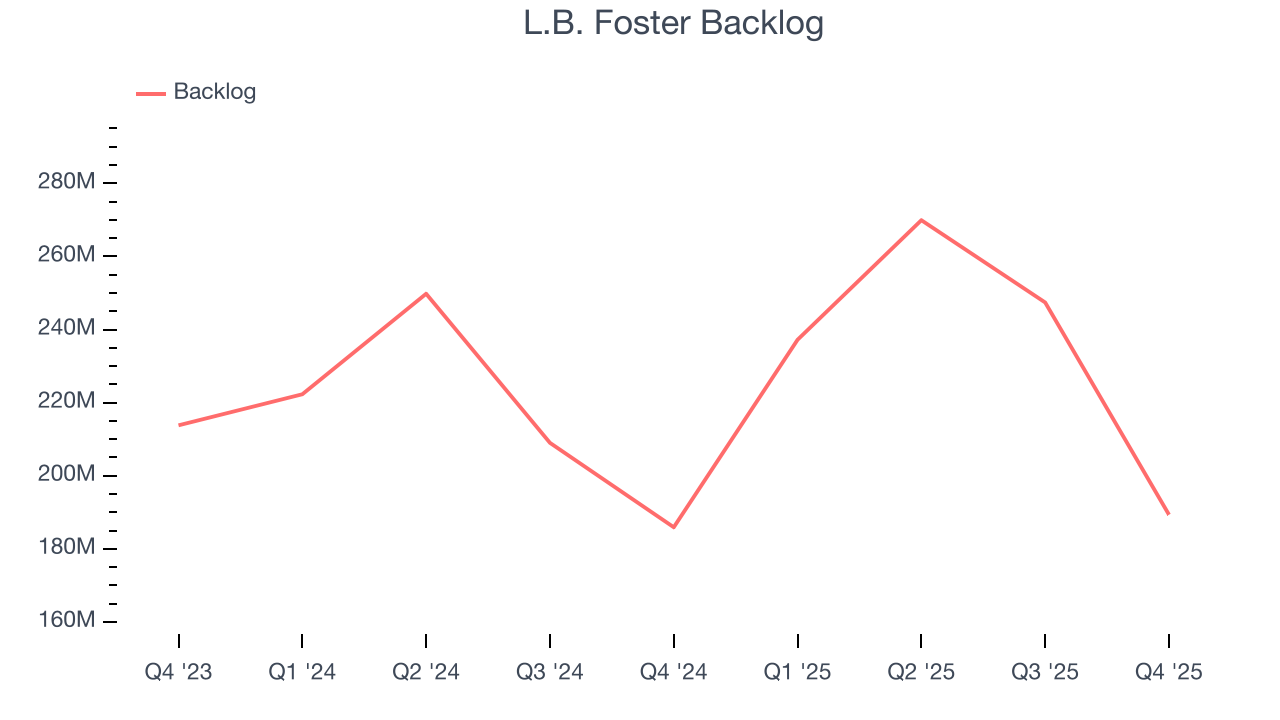
This quarter, L.B. Foster reported robust year-on-year revenue growth of 25.1%, and its $160.4 million of revenue topped Wall Street estimates by 1%.
Looking ahead, sell-side analysts expect revenue to grow 2.9% over the next 12 months. While this projection suggests its newer products and services will catalyze better top-line performance, it is still below the sector average.
6. Gross Margin & Pricing Power
At StockStory, we prefer high gross margin businesses because they indicate the company has pricing power or differentiated products, giving it a chance to generate higher operating profits.
L.B. Foster has bad unit economics for an industrials business, signaling it operates in a competitive market. As you can see below, it averaged a 19.9% gross margin over the last five years. That means L.B. Foster paid its suppliers a lot of money ($80.07 for every $100 in revenue) to run its business. 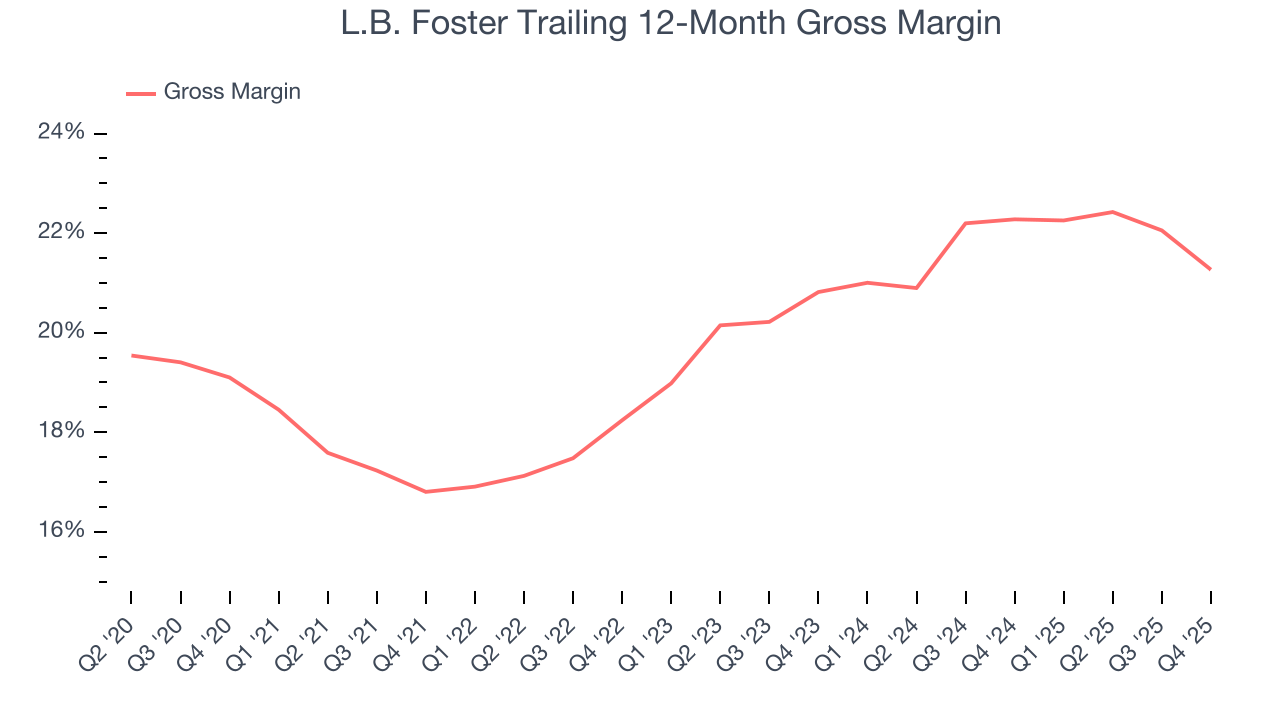
In Q4, L.B. Foster produced a 19.7% gross profit margin, down 2.7 percentage points year on year. L.B. Foster’s full-year margin has also been trending down over the past 12 months, decreasing by 1 percentage points. If this move continues, it could suggest a more competitive environment with some pressure to lower prices and higher input costs (such as raw materials and manufacturing expenses).
7. Operating Margin
L.B. Foster was profitable over the last five years but held back by its large cost base. Its average operating margin of 2.3% was weak for an industrials business. This result isn’t too surprising given its low gross margin as a starting point.
On the plus side, L.B. Foster’s operating margin rose by 3.4 percentage points over the last five years, as its sales growth gave it operating leverage.
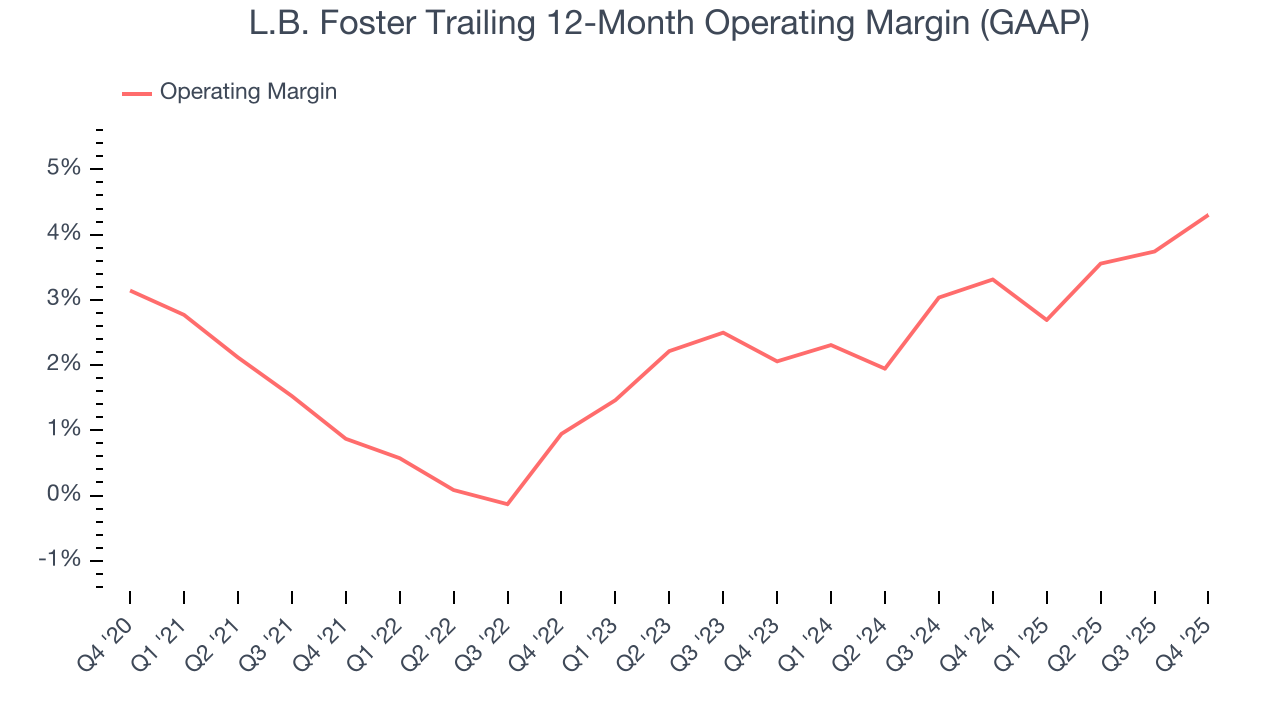
This quarter, L.B. Foster generated an operating margin profit margin of 4.9%, up 2.1 percentage points year on year. The increase was encouraging, and because its gross margin actually decreased, we can assume it was more efficient because its operating expenses like marketing, R&D, and administrative overhead grew slower than its revenue.
8. Earnings Per Share
Revenue trends explain a company’s historical growth, but the long-term change in earnings per share (EPS) points to the profitability of that growth – for example, a company could inflate its sales through excessive spending on advertising and promotions.
L.B. Foster’s flat EPS over the last five years was below its 1.7% annualized revenue growth. However, its operating margin actually improved during this time, telling us that non-fundamental factors such as interest expenses and taxes affected its ultimate earnings.
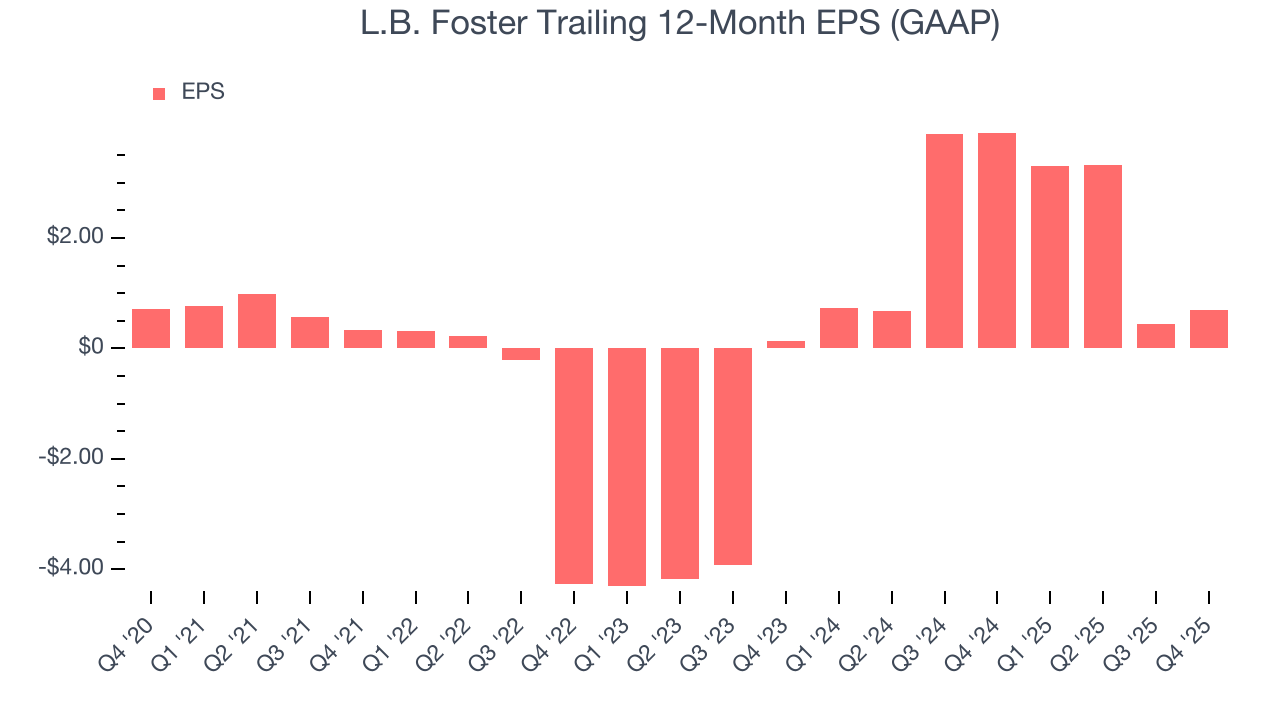
Like with revenue, we analyze EPS over a shorter period to see if we are missing a change in the business.
L.B. Foster’s two-year annual EPS growth of 130% was fantastic and topped its flat revenue.
Diving into L.B. Foster’s quality of earnings can give us a better understanding of its performance. L.B. Foster’s operating margin has expanded over the last two years. This was the most relevant factor (aside from the revenue impact) behind its higher earnings; interest expenses and taxes can also affect EPS but don’t tell us as much about a company’s fundamentals.
In Q4, L.B. Foster reported EPS of $0.22, up from negative $0.02 in the same quarter last year. Despite growing year on year, this print missed analysts’ estimates. Over the next 12 months, Wall Street expects L.B. Foster’s full-year EPS of $0.69 to grow 158%.
9. Cash Is King
If you’ve followed StockStory for a while, you know we emphasize free cash flow. Why, you ask? We believe that in the end, cash is king, and you can’t use accounting profits to pay the bills.
L.B. Foster has shown poor cash profitability over the last five years, giving the company limited opportunities to return capital to shareholders. Its free cash flow margin averaged 1.8%, lousy for an industrials business.
Taking a step back, an encouraging sign is that L.B. Foster’s margin expanded by 5.8 percentage points during that time. The company’s improvement shows it’s heading in the right direction, and we can see it became a less capital-intensive business because its free cash flow profitability rose more than its operating profitability.
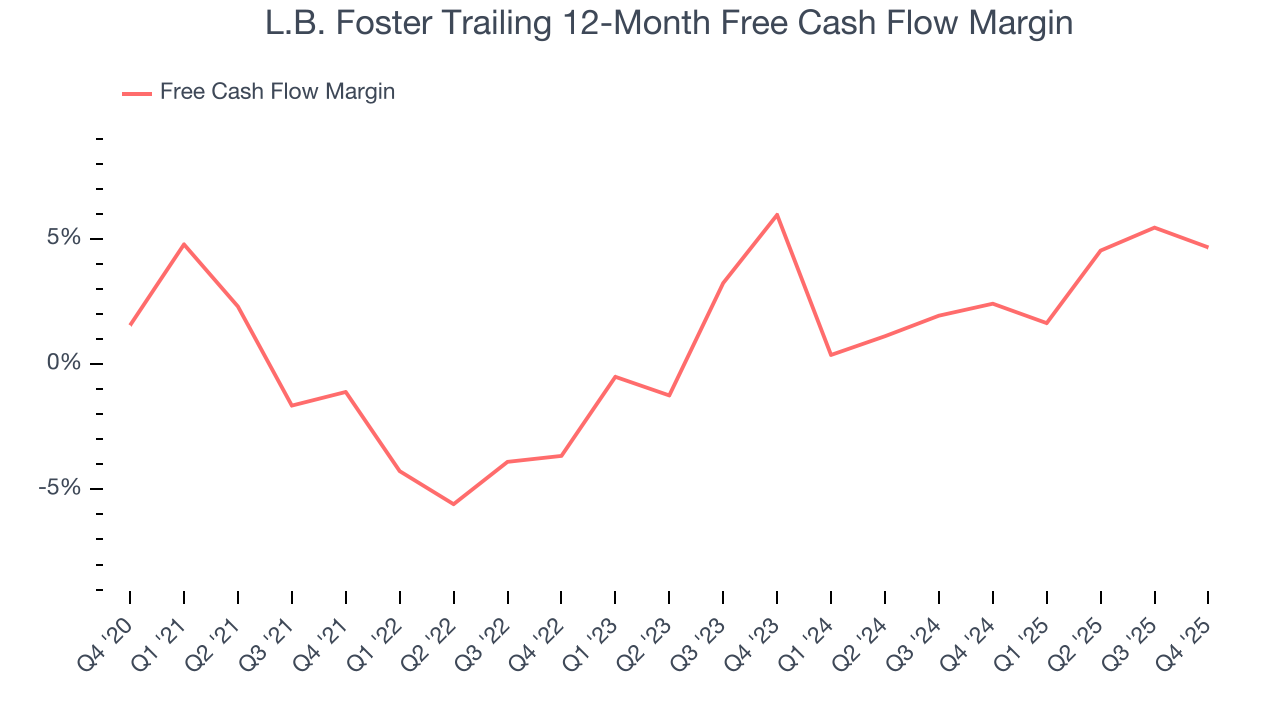
L.B. Foster’s free cash flow clocked in at $19.81 million in Q4, equivalent to a 12.3% margin. The company’s cash profitability regressed as it was 5.1 percentage points lower than in the same quarter last year, but it’s still above its five-year average. We wouldn’t put too much weight on this quarter’s decline because investment needs can be seasonal, causing short-term swings. Long-term trends are more important.
10. Return on Invested Capital (ROIC)
EPS and free cash flow tell us whether a company was profitable while growing its revenue. But was it capital-efficient? A company’s ROIC explains this by showing how much operating profit it makes compared to the money it has raised (debt and equity).
L.B. Foster historically did a mediocre job investing in profitable growth initiatives. Its five-year average ROIC was 3.5%, lower than the typical cost of capital (how much it costs to raise money) for industrials companies.
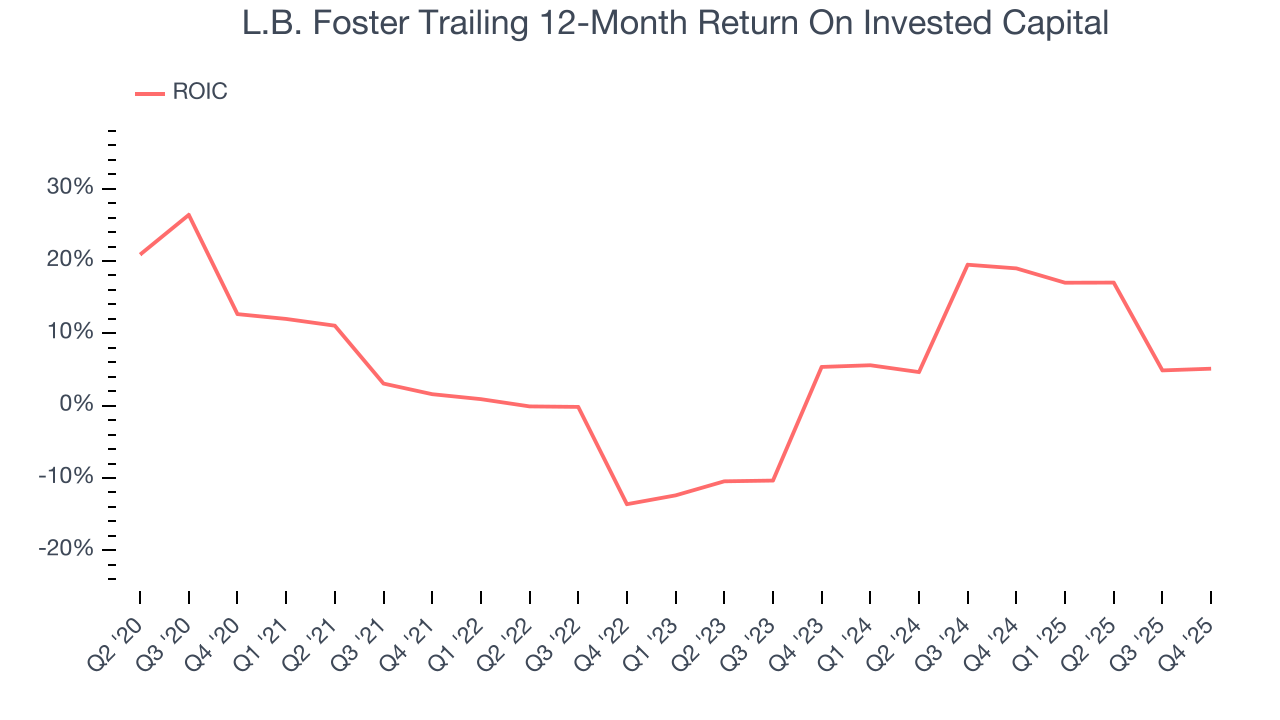
We like to invest in businesses with high returns, but the trend in a company’s ROIC is what often surprises the market and moves the stock price. Over the last few years, L.B. Foster’s ROIC has increased significantly. This is a good sign, and we hope the company can continue improving.
11. Balance Sheet Assessment
L.B. Foster reported $4.35 million of cash and $67.02 million of debt on its balance sheet in the most recent quarter. As investors in high-quality companies, we primarily focus on two things: 1) that a company’s debt level isn’t too high and 2) that its interest payments are not excessively burdening the business.
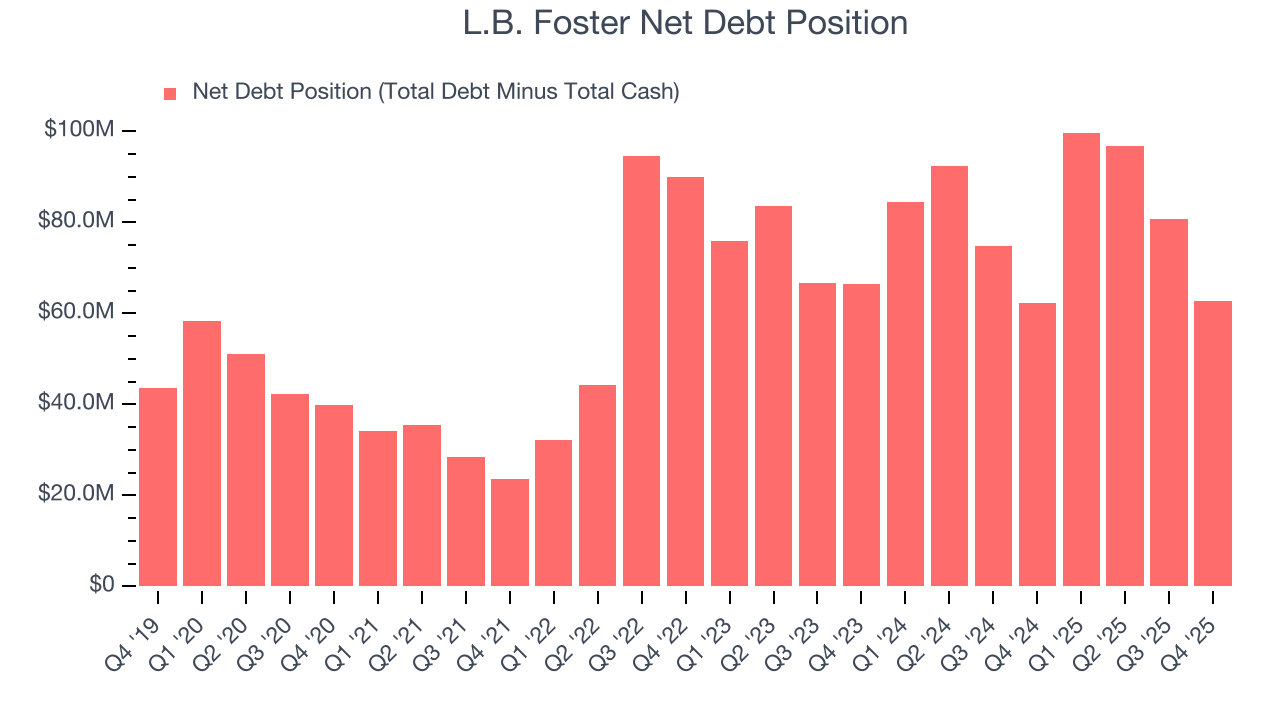
With $39.09 million of EBITDA over the last 12 months, we view L.B. Foster’s 1.6× net-debt-to-EBITDA ratio as safe. We also see its $2.89 million of annual interest expenses as appropriate. The company’s profits give it plenty of breathing room, allowing it to continue investing in growth initiatives.
12. Key Takeaways from L.B. Foster’s Q4 Results
It was good to see L.B. Foster provide full-year revenue guidance that slightly beat analysts’ expectations. We were also happy its revenue narrowly outperformed Wall Street’s estimates. On the other hand, its EBITDA missed and its EPS fell short of Wall Street’s estimates. Overall, this was a weaker quarter. The stock traded up 1.7% to $32.82 immediately following the results.
13. Is Now The Time To Buy L.B. Foster?
Updated: March 17, 2026 at 11:49 PM EDT
We think that the latest earnings result is only one piece of the bigger puzzle. If you’re deciding whether to own L.B. Foster, you should also grasp the company’s longer-term business quality and valuation.
L.B. Foster isn’t a terrible business, but it isn’t one of our picks. First off, its revenue growth was weak over the last five years. While its rising cash profitability gives it more optionality, the downside is its relatively low ROIC suggests management has struggled to find compelling investment opportunities. On top of that, its weak EPS growth over the last five years shows it’s failed to produce meaningful profits for shareholders.
L.B. Foster’s P/E ratio based on the next 12 months is 18.7x. This valuation is reasonable, but the company’s shakier fundamentals present too much downside risk. We're fairly confident there are better investments elsewhere.
Wall Street analysts have a consensus one-year price target of $32.50 on the company (compared to the current share price of $28.06).
Although the price target is bullish, readers should exercise caution because analysts tend to be overly optimistic. The firms they work for, often big banks, have relationships with companies that extend into fundraising, M&A advisory, and other rewarding business lines. As a result, they typically hesitate to say bad things for fear they will lose out. We at StockStory do not suffer from such conflicts of interest, so we’ll always tell it like it is.