
Burlington (BURL)
Burlington is intriguing. Its revenue and EPS are projected to skyrocket next year, an optimistic sign for its share price.― StockStory Analyst Team
1. News

2. Summary
Why Burlington Is Interesting
Founded in 1972 as a discount coat and outerwear retailer, Burlington Stores (NYSE:BURL) is now an off-price retailer that has broadened into general apparel, footwear, and home goods.
- Fast expansion of new stores to reach markets with few or no locations is justified by its same-store sales growth
- Market share will likely rise over the next 12 months as its expected revenue growth of 9.6% is robust
- A blemish is its below-average returns on capital indicate management struggled to find compelling investment opportunities


Burlington shows some potential. If you believe in the company, the price seems fair.
Why Is Now The Time To Buy Burlington?

At $296.65 per share, Burlington trades at 25.7x forward P/E. When stacked up against other consumer retail companies, we think Burlington’s multiple is fair for the fundamentals you get.
It could be a good time to invest if you see something the market doesn’t.
3. Burlington (BURL) Research Report: Q4 CY2025 Update
Off-price retail company Burlington Stores (NYSE:BURL) reported Q4 CY2025 results exceeding the market’s revenue expectations, with sales up 11.3% year on year to $3.65 billion. The company expects next quarter’s revenue to be around $2.75 billion, close to analysts’ estimates. Its non-GAAP profit of $4.89 per share was 2.9% above analysts’ consensus estimates.
Burlington (BURL) Q4 CY2025 Highlights:
- Revenue: $3.65 billion vs analyst estimates of $3.59 billion (11.3% year-on-year growth, 1.6% beat)
- Adjusted EPS: $4.89 vs analyst estimates of $4.75 (2.9% beat)
- Revenue Guidance for Q1 CY2026 is $2.75 billion at the midpoint, roughly in line with what analysts were expecting
- Adjusted EPS guidance for the upcoming financial year 2026 is $11.20 at the midpoint, in line with analyst estimates
- Operating Margin: 14.9%, up from 11.2% in the same quarter last year
- Free Cash Flow Margin: 19.7%, up from 5.8% in the same quarter last year
- Locations: 1,212 at quarter end, up from 1,108 in the same quarter last year
- Same-Store Sales rose 4% year on year (6% in the same quarter last year)
- Market Capitalization: $18.7 billion
Company Overview
Founded in 1972 as a discount coat and outerwear retailer, Burlington Stores (NYSE:BURL) is now an off-price retailer that has broadened into general apparel, footwear, and home goods.
For example, if department store Kohl’s is left with a glut of swimsuits because of unusually cold weather, Kohl’s may sell those in bulk to Burlington at pennies on the dollar rather than discount the items and try to sell them individually. This is often done to clear floor space for a new season.
Burlington’s buying approach focuses on finding excess inventory or overstocked items from other retailers, so selection can change quickly and be varied. Shopping at Burlington is often a treasure hunt–what the consumer loses in reliable selection or the latest trends is made up for with very low prices. Prices of Burlington merchandise can be significantly lower than those of department stores. Over time, the company’s size and buying power has led to a more consistent selection of items from brands such as Tommy Hilfiger, Champion, and Dyson to name a few.
The core customer is the value-conscious shopper who enjoys the thrill of the hunt. This customer is typically a middle-aged, middle-income woman. This customer is willing to spend more time going through less organized racks and shopping exclusively in person–since Burlington has a very limited online presence–in exchange for meaningful discounts.
4. Discount Retailer
Discount retailers understand that many shoppers love a good deal, and they focus on providing excellent value to shoppers by selling general merchandise at major discounts. They can do this because of unique purchasing, procurement, and pricing strategies that involve scouring the market for trendy goods or buying excess inventory from manufacturers and other retailers. They then turn around and sell these snacks, paper towels, toys, clothes, and myriad other products at highly enticing prices. Despite the unique draw and lure of discounts, these discount retailers must also contend with the secular headwinds of online shopping and challenged retail foot traffic in places like suburban strip malls.
Off-price and discount retail competitors include TJX (NYSE:TJX), Ross Stores (NASDAQ:ROST), and Ollie’s Bargain Outlet (NASDAQ:OLLI).
5. Revenue Growth
A company’s long-term performance is an indicator of its overall quality. Any business can experience short-term success, but top-performing ones enjoy sustained growth for years.
With $11.57 billion in revenue over the past 12 months, Burlington is a mid-sized retailer, which sometimes brings disadvantages compared to larger competitors benefiting from better economies of scale.
As you can see below, Burlington’s sales grew at a mediocre 9.9% compounded annual growth rate over the last three years, but to its credit, it opened new stores and increased sales at existing, established locations.
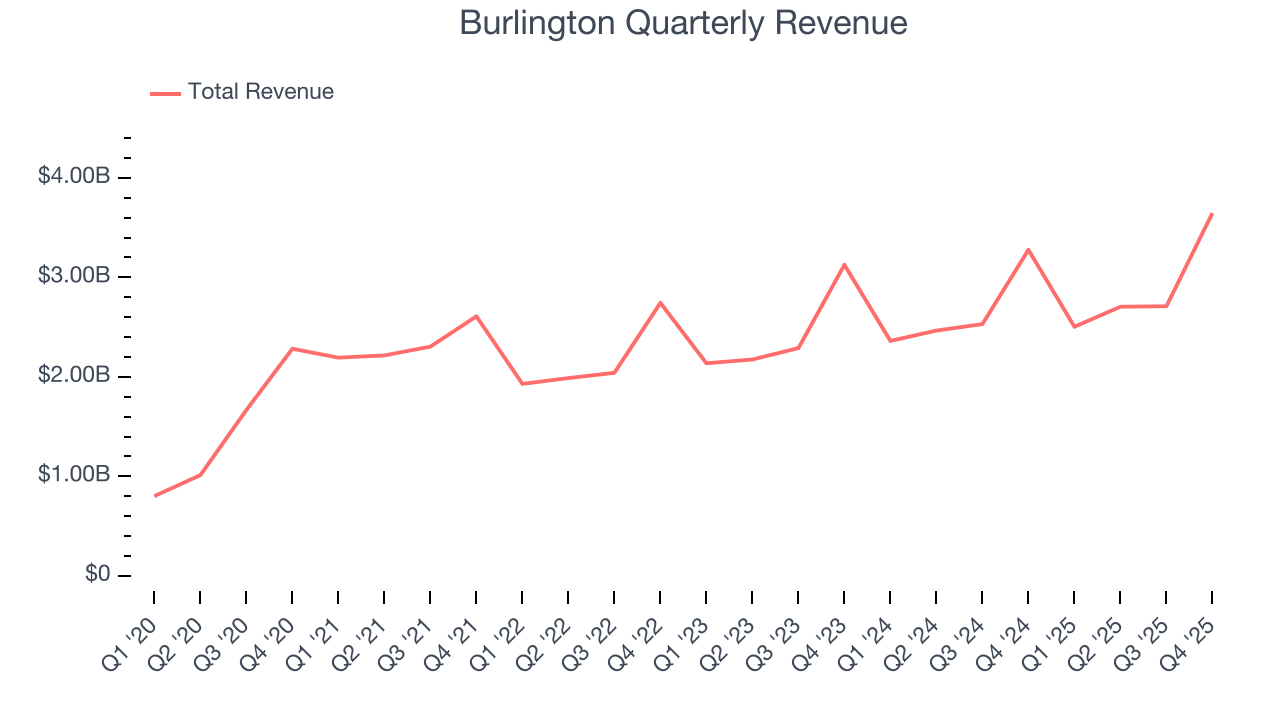
This quarter, Burlington reported year-on-year revenue growth of 11.3%, and its $3.65 billion of revenue exceeded Wall Street’s estimates by 1.6%. Company management is currently guiding for a 10% year-on-year increase in sales next quarter.
Looking further ahead, sell-side analysts expect revenue to grow 8.3% over the next 12 months, a slight deceleration versus the last three years. We still think its growth trajectory is attractive given its scale and implies the market is baking in success for its products.
6. Store Performance
Number of Stores
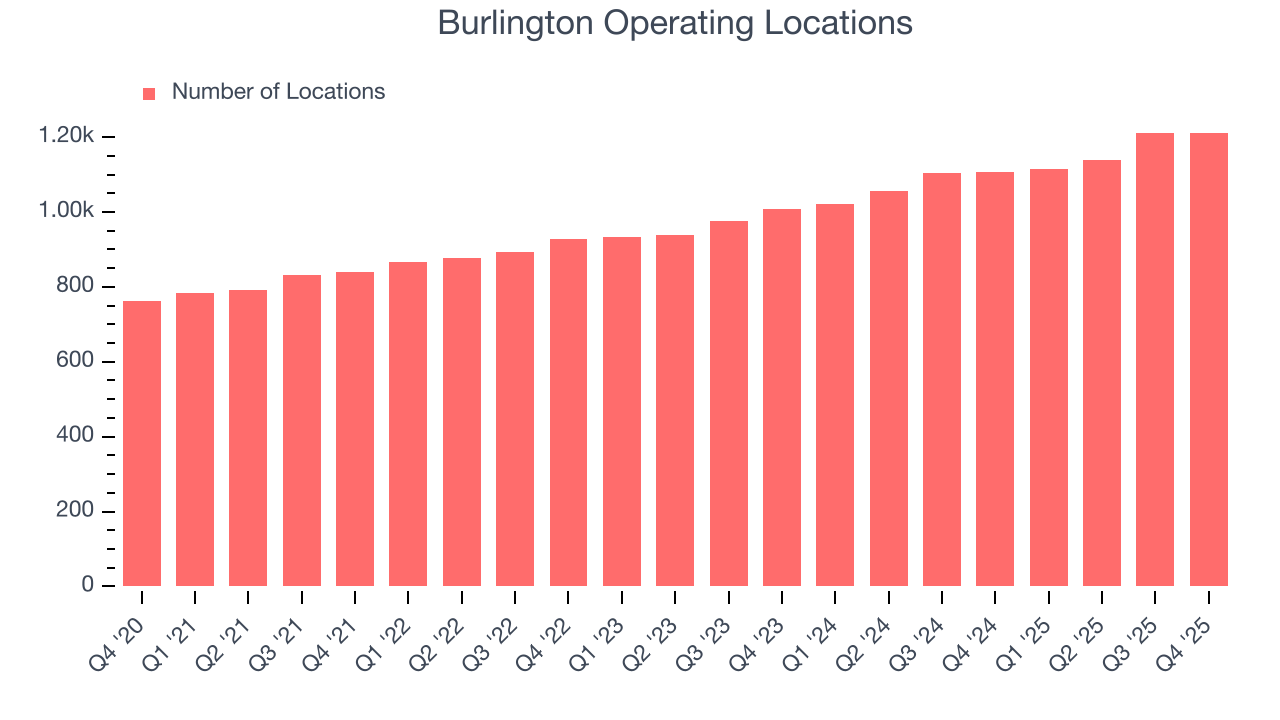
A retailer’s store count often determines how much revenue it can generate.
Burlington operated 1,212 locations in the latest quarter. It has opened new stores at a rapid clip over the last two years, averaging 10.1% annual growth, much faster than the broader consumer retail sector. This gives it a chance to become a large, scaled business over time.
When a retailer opens new stores, it usually means it’s investing for growth because demand is greater than supply, especially in areas where consumers may not have a store within reasonable driving distance.
Same-Store Sales
A company's store base only paints one part of the picture. When demand is high, it makes sense to open more. But when demand is low, it’s prudent to close some locations and use the money in other ways. Same-store sales is an industry measure of whether revenue is growing at those existing stores and is driven by customer visits (often called traffic) and the average spending per customer (ticket).
Burlington’s demand has been healthy for a retailer over the last two years. On average, the company has grown its same-store sales by a robust 3% per year. This performance gives it the confidence to meaningfully expand its store base.
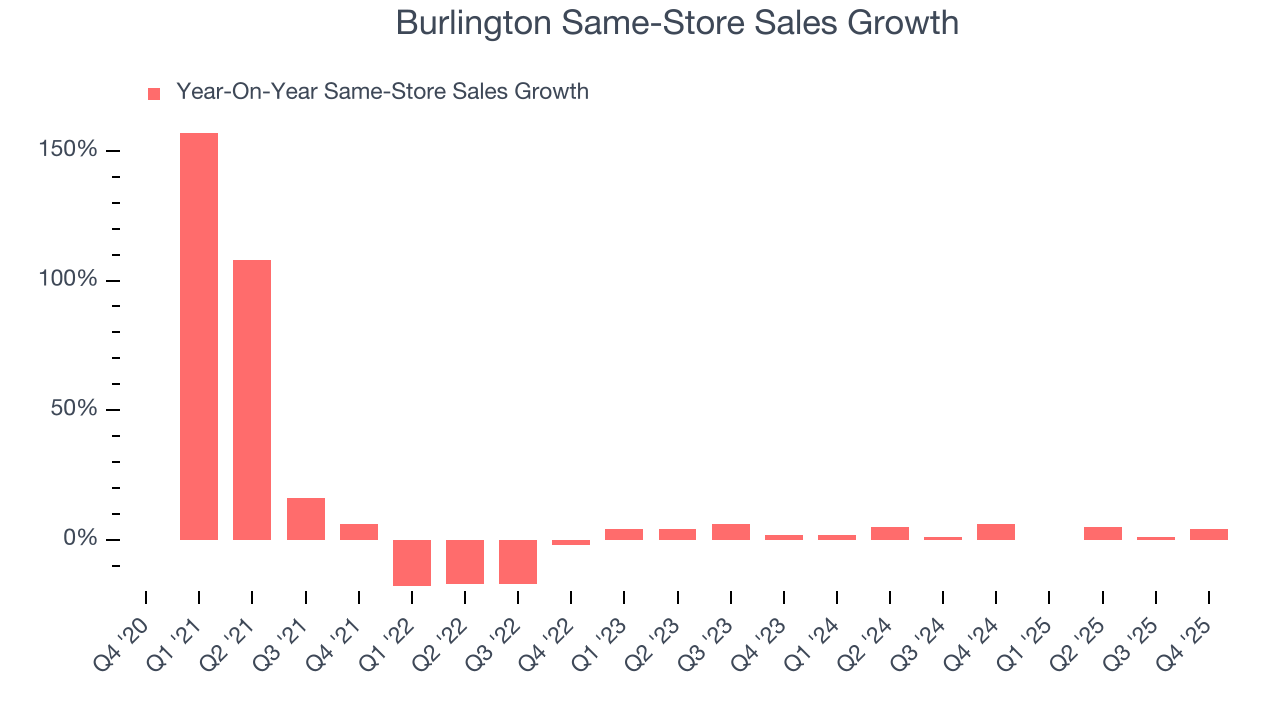
In the latest quarter, Burlington’s same-store sales rose 4% year on year. This performance was more or less in line with its historical levels.
7. Gross Margin & Pricing Power
Burlington has good unit economics for a retailer, giving it the opportunity to invest in areas such as marketing and talent to stay competitive. As you can see below, it averaged an impressive 43.6% gross margin over the last two years. Said differently, Burlington paid its suppliers $56.36 for every $100 in revenue. 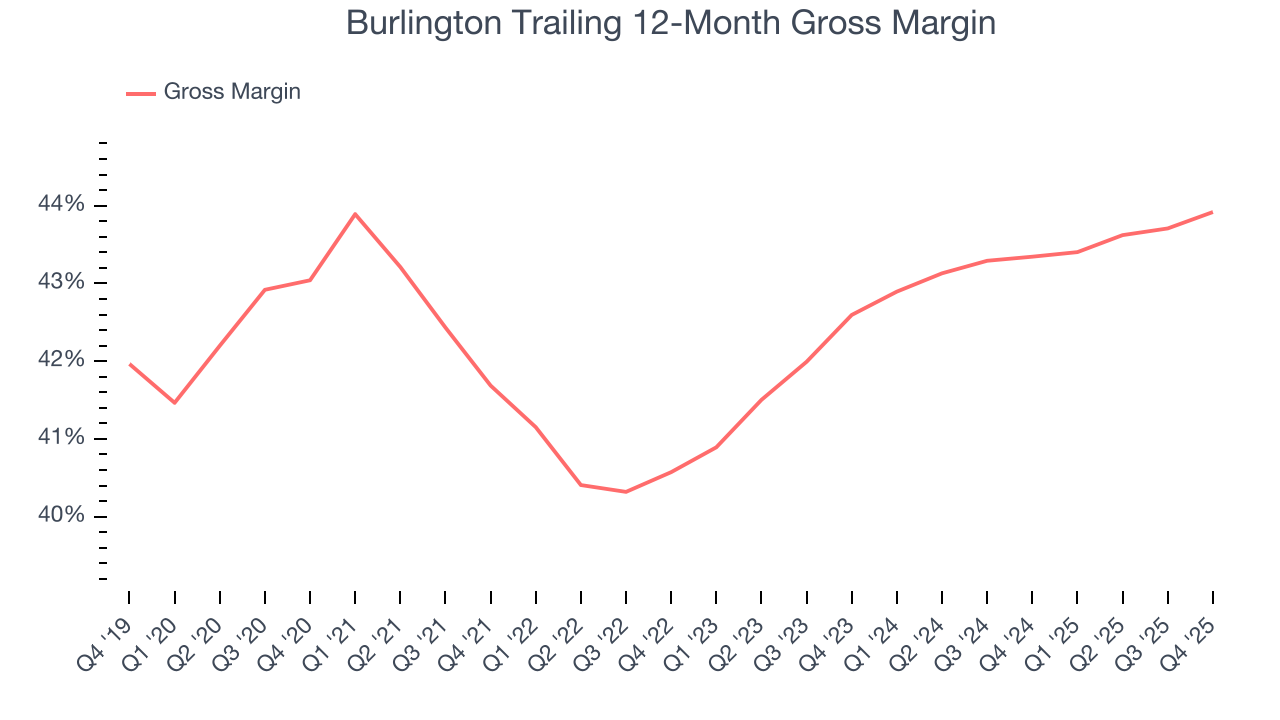
This quarter, Burlington’s gross profit margin was 43.7%, in line with the same quarter last year. Zooming out, the company’s full-year margin has remained steady over the past 12 months, suggesting it strives to keep prices low for customers and has stable input costs (such as labor and freight expenses to transport goods).
8. Operating Margin
Operating margin is a key measure of profitability. Think of it as net income - the bottom line - excluding the impact of taxes and interest on debt, which are less connected to business fundamentals.
Burlington was profitable over the last two years but held back by its large cost base. Its average operating margin of 7.8% was weak for a consumer retail business. This result is surprising given its high gross margin as a starting point.
On the plus side, Burlington’s operating margin rose by 1.6 percentage points over the last year, as its sales growth gave it operating leverage.
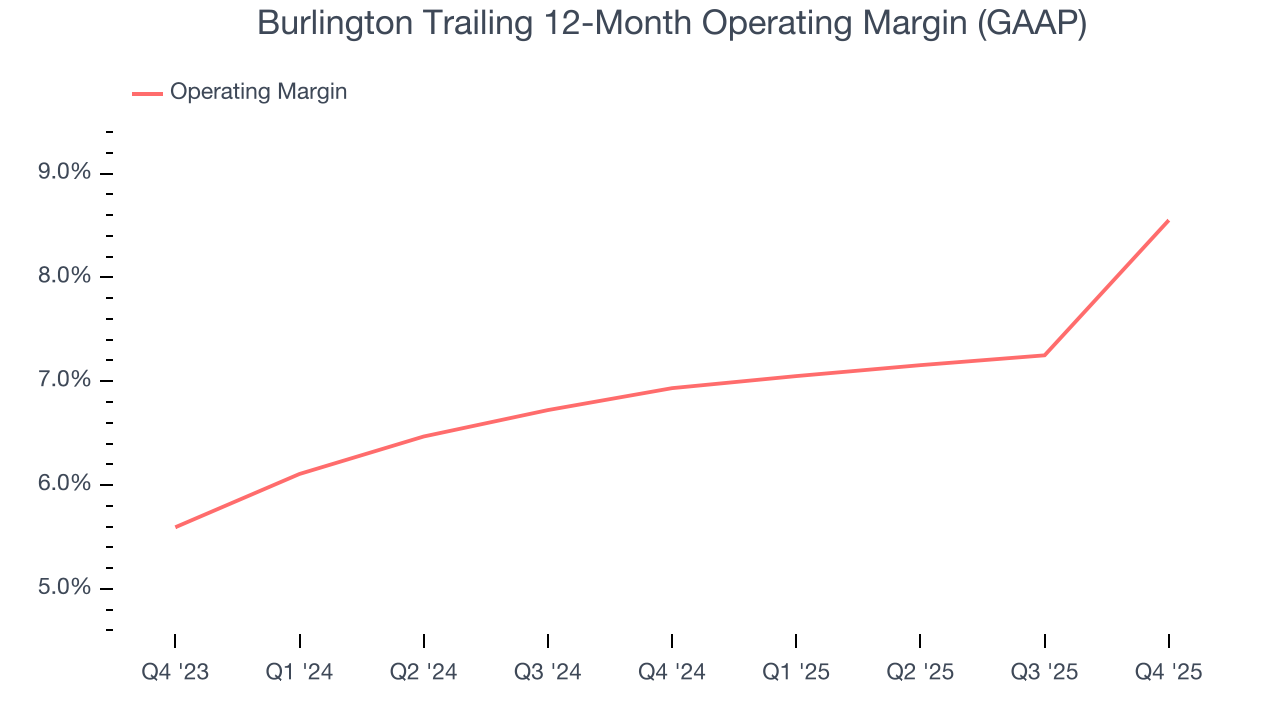
In Q4, Burlington generated an operating margin profit margin of 14.9%, up 3.7 percentage points year on year. The increase was encouraging, and because its operating margin rose more than its gross margin, we can infer it was more efficient with expenses such as marketing, and administrative overhead.
9. Earnings Per Share
Revenue trends explain a company’s historical growth, but the long-term change in earnings per share (EPS) points to the profitability of that growth – for example, a company could inflate its sales through excessive spending on advertising and promotions.
Burlington’s EPS grew at 29.8% compounded annual growth rate over the last three years, higher than its 9.9% annualized revenue growth. This tells us the company became more profitable on a per-share basis as it expanded.
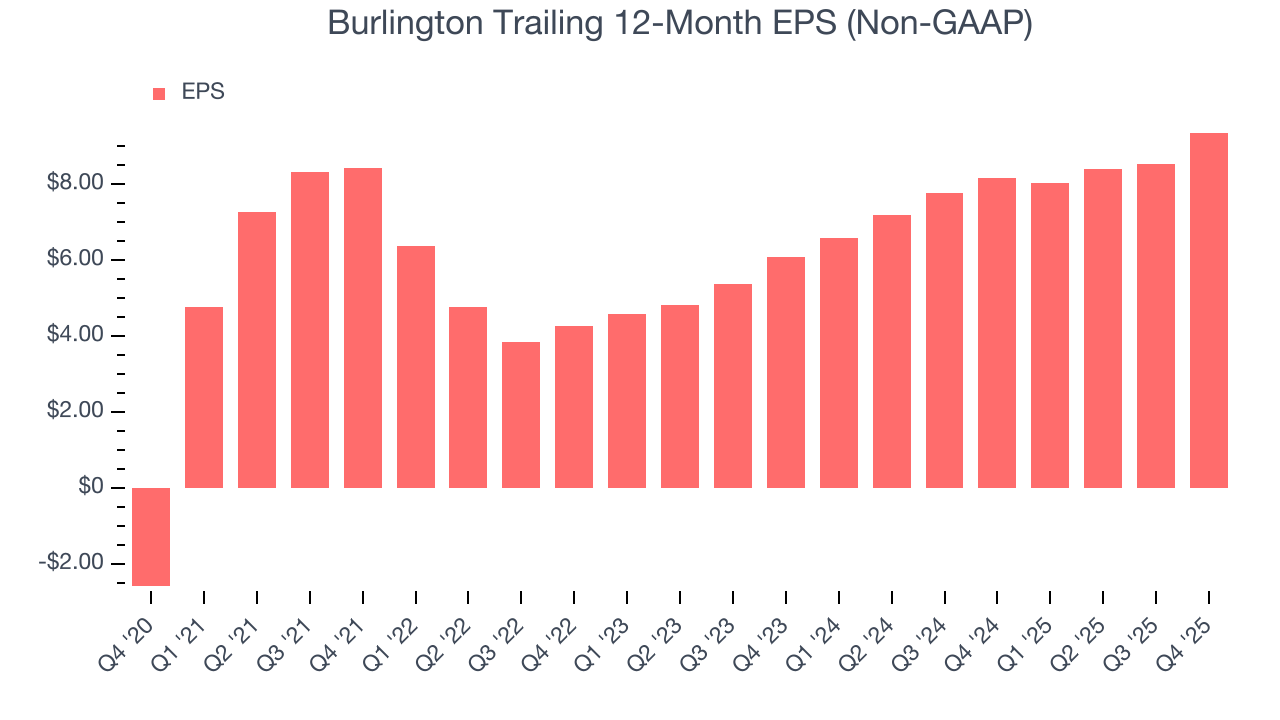
In Q4, Burlington reported adjusted EPS of $4.89, up from $4.07 in the same quarter last year. This print beat analysts’ estimates by 2.9%. Over the next 12 months, Wall Street expects Burlington’s full-year EPS of $9.36 to grow 18.6%.
10. Cash Is King
If you’ve followed StockStory for a while, you know we emphasize free cash flow. Why, you ask? We believe that in the end, cash is king, and you can’t use accounting profits to pay the bills.
Burlington broke even from a free cash flow perspective over the last two years, giving the company limited opportunities to return capital to shareholders.
Taking a step back, an encouraging sign is that Burlington’s margin expanded by 1.6 percentage points over the last year. We have no doubt shareholders would like to continue seeing its cash conversion rise as it gives the company more optionality.
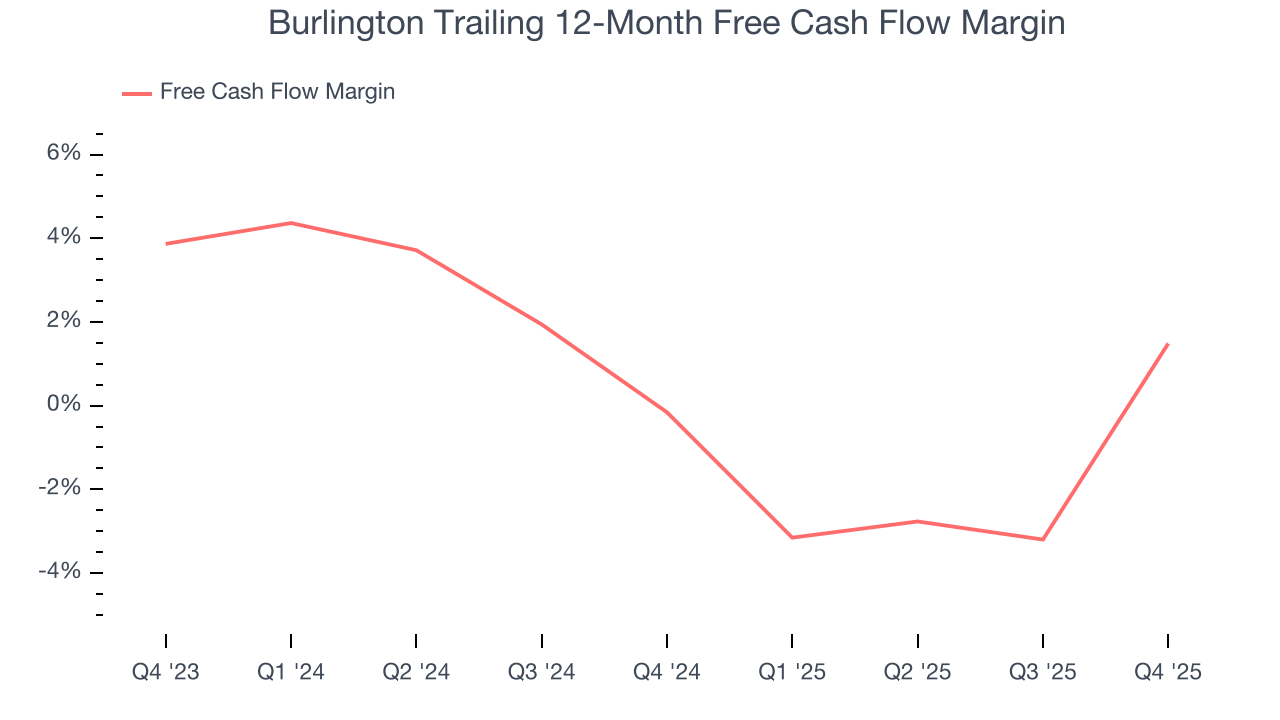
Burlington’s free cash flow clocked in at $719.9 million in Q4, equivalent to a 19.7% margin. This result was good as its margin was 13.9 percentage points higher than in the same quarter last year, building on its favorable historical trend.
11. Return on Invested Capital (ROIC)
EPS and free cash flow tell us whether a company was profitable while growing its revenue. But was it capital-efficient? A company’s ROIC explains this by showing how much operating profit it makes compared to the money it has raised (debt and equity).
Burlington historically did a mediocre job investing in profitable growth initiatives. Its five-year average ROIC was 9.6%, somewhat low compared to the best consumer retail companies that consistently pump out 25%+.
12. Balance Sheet Assessment
Burlington reported $1.23 billion of cash and $6.01 billion of debt on its balance sheet in the most recent quarter. As investors in high-quality companies, we primarily focus on two things: 1) that a company’s debt level isn’t too high and 2) that its interest payments are not excessively burdening the business.
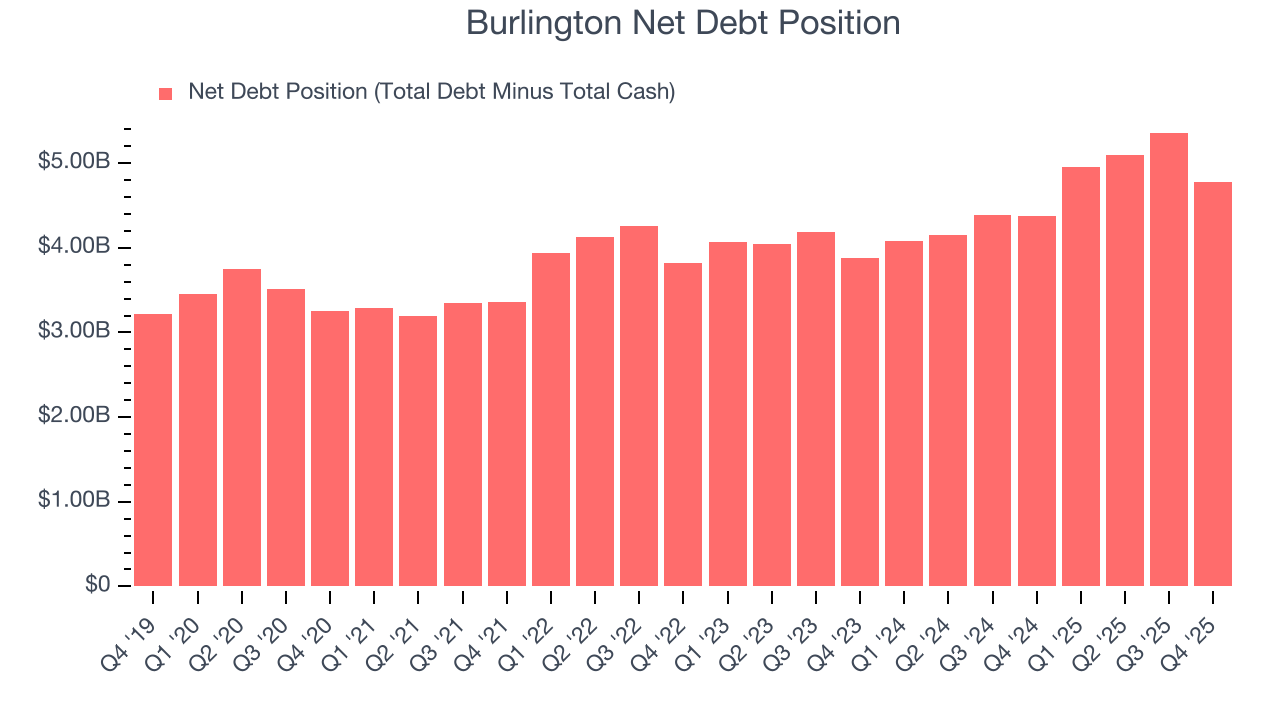
With $1.29 billion of EBITDA over the last 12 months, we view Burlington’s 3.7× net-debt-to-EBITDA ratio as safe. We also see its $36 million of annual interest expenses as appropriate. The company’s profits give it plenty of breathing room, allowing it to continue investing in growth initiatives.
13. Key Takeaways from Burlington’s Q4 Results
We enjoyed seeing Burlington beat analysts’ EBITDA expectations this quarter. We were also happy its revenue outperformed Wall Street’s estimates. On the other hand, its EPS guidance for next quarter missed. Zooming out, we think this was a mixed quarter. The stock traded up 7.6% to $323.71 immediately after reporting.
14. Is Now The Time To Buy Burlington?
Updated: March 14, 2026 at 10:37 PM EDT
The latest quarterly earnings matters, sure, but we actually think longer-term fundamentals and valuation matter more. Investors should consider all these pieces before deciding whether or not to invest in Burlington.
There are a lot of things to like about Burlington. Although its revenue growth was mediocre over the last three years, its new store openings have increased its brand equity. And while its relatively low ROIC suggests management has struggled to find compelling investment opportunities, its projected EPS for the next year implies the company will continue generating shareholder value.
Burlington’s P/E ratio based on the next 12 months is 25.7x. Looking at the consumer retail landscape right now, Burlington trades at a pretty interesting price. For those confident in the business and its management team, this is a good time to invest.
Wall Street analysts have a consensus one-year price target of $370.50 on the company (compared to the current share price of $296.65), implying they see 24.9% upside in buying Burlington in the short term.