
Designer Brands (DBI)
Designer Brands keeps us up at night. Its low returns on capital and plummeting sales suggest it struggles to generate demand and profits, a red flag.― StockStory Analyst Team
1. News


2. Summary
Why We Think Designer Brands Will Underperform
Founded in 1969 as a shoe importer and distributor, Designer Brands (NYSE:DBI) is an American discount retailer focused on footwear and accessories.
- Weak same-store sales trends over the past two years suggest there may be few opportunities in its core markets to open new locations
- Products have few die-hard fans as sales have declined by 5% annually over the last three years
- High net-debt-to-EBITDA ratio of 11× increases the risk of forced asset sales or dilutive financing if operational performance weakens


Designer Brands’s quality doesn’t meet our bar. We believe there are better opportunities elsewhere.
Why There Are Better Opportunities Than Designer Brands


Designer Brands’s stock price of $5.56 implies a valuation ratio of 15.9x forward P/E. This multiple expensive for its subpar fundamentals.
Paying up for elite businesses with strong earnings potential is better than investing in lower-quality companies with shaky fundamentals. That’s how you avoid big downside over the long term.
3. Designer Brands (DBI) Research Report: Q3 CY2025 Update
Footwear and accessories discount retailer Designer Brands (NYSE:DBI) missed Wall Street’s revenue expectations in Q3 CY2025, with sales falling 3.2% year on year to $752.4 million. Its non-GAAP profit of $0.38 per share was significantly above analysts’ consensus estimates.
Designer Brands (DBI) Q3 CY2025 Highlights:
- Revenue: $752.4 million vs analyst estimates of $763.4 million (3.2% year-on-year decline, 1.4% miss)
- Adjusted EPS: $0.38 vs analyst estimates of $0.18 (significant beat)
- Operating Margin: 5.7%, up from 2.9% in the same quarter last year
- Locations: 672 at quarter end, down from 675 in the same quarter last year
- Same-Store Sales fell 2.4% year on year, in line with the same quarter last year
- Market Capitalization: $240.3 million
Company Overview
Founded in 1969 as a shoe importer and distributor, Designer Brands (NYSE:DBI) is an American discount retailer focused on footwear and accessories.
The company operates under various banners including DSW (Designer Shoe Warehouse), The Shoe Company, and Shoe Warehouse. In addition to footwear, Designer Brands also carries a broad selection of handbags. A customer can find Nike, Converse, Clarks and other shoe brands as well as Michael Kors, Kate Spade, and Marc Jacobs bags. Prices on this merchandise are typically meaningfully lower than prices at traditional department stores and other specialty retailers.
Designer Brands can offer these low prices because the company typically purchases overstocks, closeouts, and discontinued styles directly from manufacturers, as well as from other retailers and distributors ridding themselves of unwanted stock. The typical customer is therefore someone who cares about brands and fashion but loves a good deal and doesn’t mind somewhat inconsistent selection.
The company’s stores vary, but the average size across the different banners is roughly 20,000 square feet. They are generally located in shopping centers and malls alongside other retailers and are laid out with sections dedicated to different categories such as women's footwear, children's footwear, and women’s accessories. In addition to the physical store footprint, Designer Brands has an e-commerce site for each banner.
4. Footwear Retailer
Footwear sales–like their apparel counterparts–are driven by seasons, trends, and innovation more so than absolute need and similarly face the bigger-picture secular trend of e-commerce penetration. Footwear plays a part in societal belonging, personal expression, and occasion, and retailers selling shoes recognize this. Therefore, they aim to balance selection, competitive prices, and the latest trends to attract consumers. Unlike their apparel counterparts, footwear retailers most sell popular third-party brands (as opposed to their own exclusive brands), which could mean less exclusivity of product but more nimbleness to pivot to what’s hot.
Retail competitors offering discount or mid-priced footwear and accessories include Foot Locker (NYSE:FL), Genesco (NYSE:GCO), and TJX (NYSE:TJX).
5. Revenue Growth
A company’s long-term sales performance is one signal of its overall quality. Any business can put up a good quarter or two, but many enduring ones grow for years.
With $2.89 billion in revenue over the past 12 months, Designer Brands is a small retailer, which sometimes brings disadvantages compared to larger competitors benefiting from economies of scale and negotiating leverage with suppliers.
As you can see below, Designer Brands’s revenue declined by 5% per year over the last three years (we compare to 2019 to normalize for COVID-19 impacts) despite opening new stores. This implies its underperformance was driven by lower sales at existing, established locations.
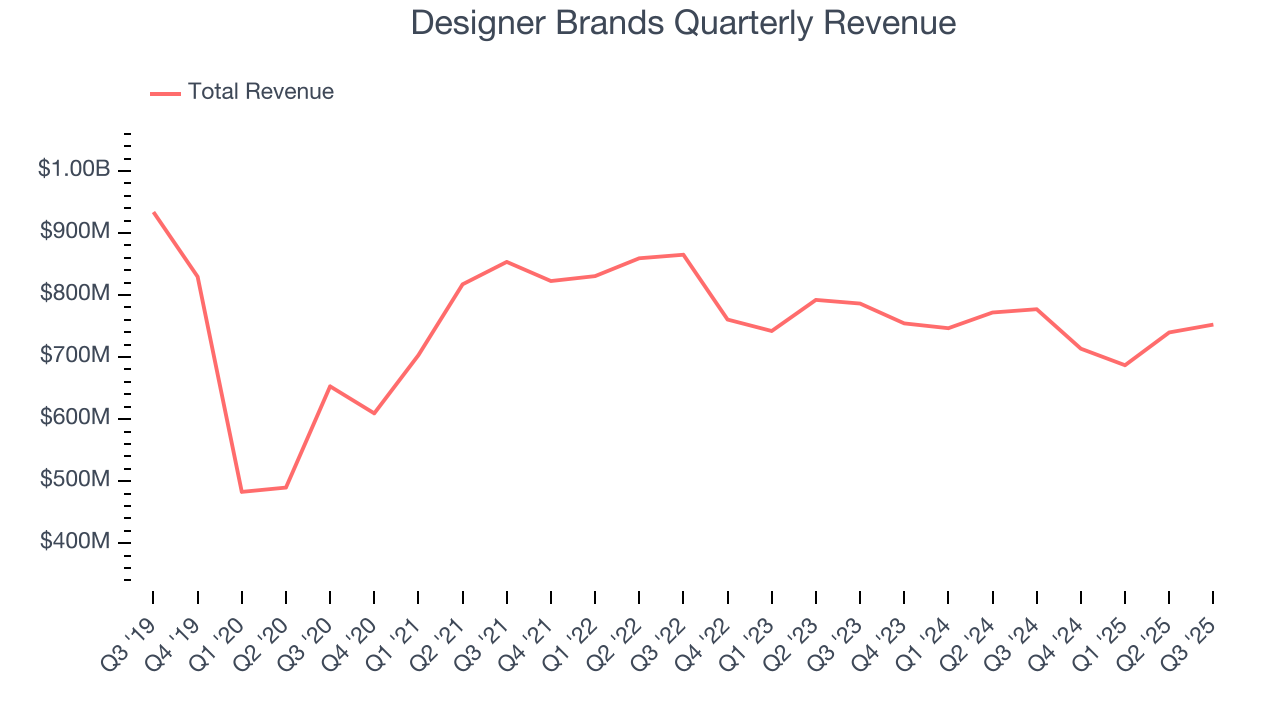
This quarter, Designer Brands missed Wall Street’s estimates and reported a rather uninspiring 3.2% year-on-year revenue decline, generating $752.4 million of revenue.
Looking ahead, sell-side analysts expect revenue to grow 2.2% over the next 12 months. While this projection indicates its newer products will catalyze better top-line performance, it is still below the sector average.
6. Store Performance
Number of Stores
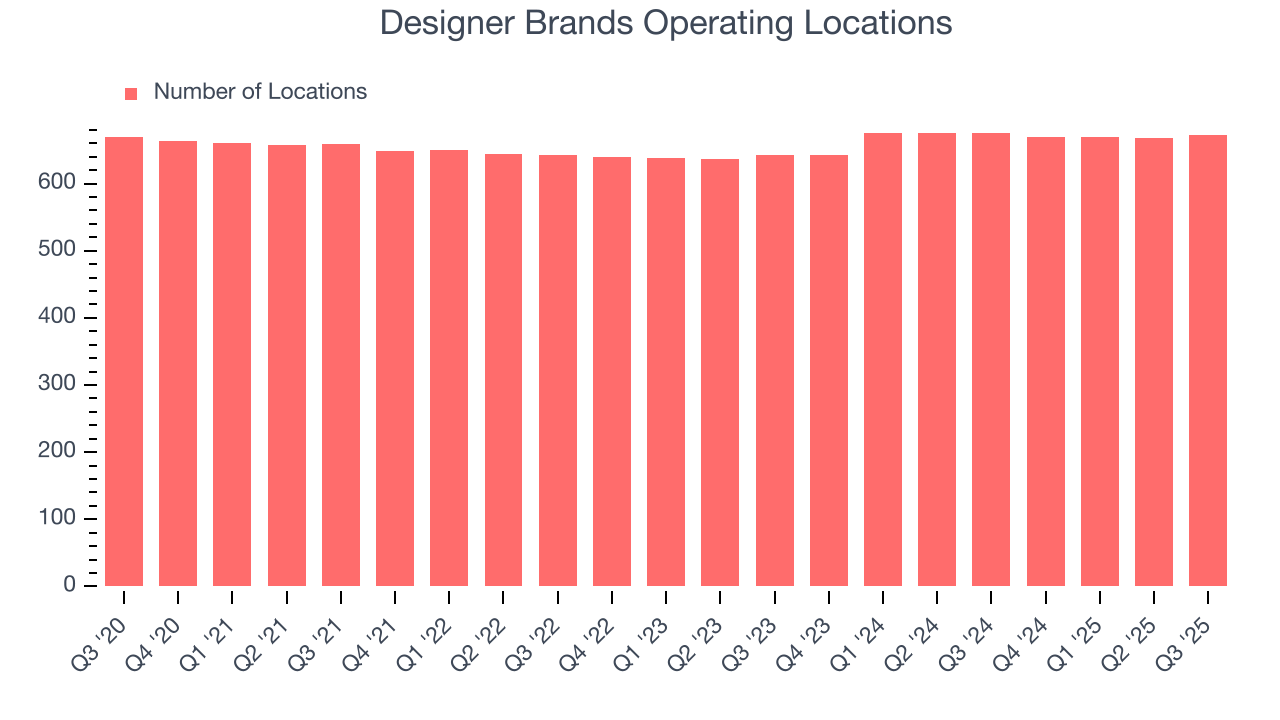
The number of stores a retailer operates is a critical driver of how quickly company-level sales can grow.
Designer Brands operated 672 locations in the latest quarter. It has opened new stores quickly over the last two years, averaging 2.4% annual growth, faster than the broader consumer retail sector.
When a retailer opens new stores, it usually means it’s investing for growth because demand is greater than supply, especially in areas where consumers may not have a store within reasonable driving distance.
Same-Store Sales
A company's store base only paints one part of the picture. When demand is high, it makes sense to open more. But when demand is low, it’s prudent to close some locations and use the money in other ways. Same-store sales provides a deeper understanding of this issue because it measures organic growth at brick-and-mortar shops for at least a year.
Designer Brands’s demand has been shrinking over the last two years as its same-store sales have averaged 3.6% annual declines. This performance is concerning - it shows Designer Brands artificially boosts its revenue by building new stores. We’d like to see a company’s same-store sales rise before it takes on the costly, capital-intensive endeavor of expanding its store base.
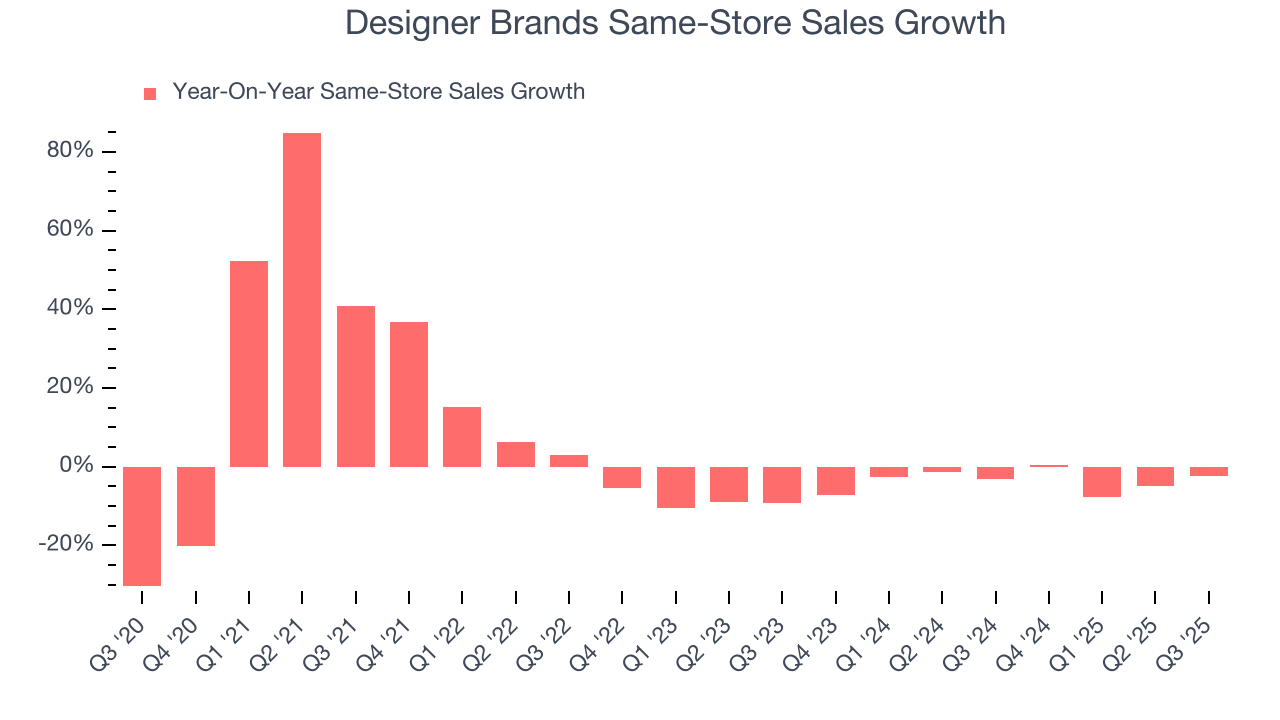
In the latest quarter, Designer Brands’s same-store sales fell by 2.4% year on year. This decrease represents a further deceleration from its historical levels. We hope the business can get back on track.
7. Gross Margin & Pricing Power
Designer Brands has great unit economics for a retailer, giving it ample room to invest in areas such as marketing and talent to grow its brand. As you can see below, it averaged an excellent 50% gross margin over the last two years. That means Designer Brands only paid its suppliers $49.99 for every $100 in revenue. 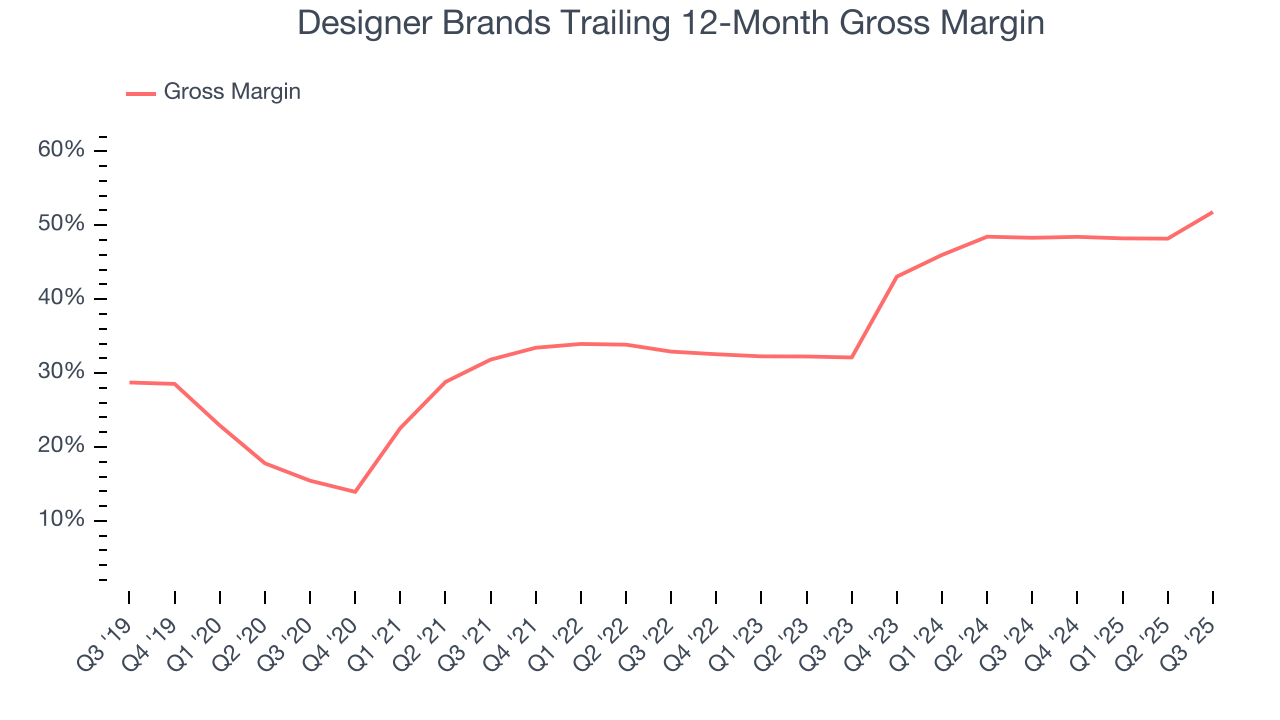
Designer Brands’s gross profit margin came in at 45.1% this quarter, marking a 13.3 percentage point increase from 31.8% in the same quarter last year. Designer Brands’s full-year margin has also been trending up over the past 12 months, increasing by 3.5 percentage points. If this move continues, it could suggest the company has less pressure to discount products and is realizing better unit economics due to stable or shrinking input costs (such as labor and freight expenses to transport goods).
8. Operating Margin
Operating margin is a key profitability metric because it accounts for all expenses necessary to run a store, including wages, inventory, rent, advertising, and other administrative costs.
Designer Brands’s operating margin might fluctuated slightly over the last 12 months but has generally stayed the same, averaging 1% over the last two years. This profitability was inadequate for a consumer retail business and caused by its suboptimal cost structure.
Analyzing the trend in its profitability, Designer Brands’s operating margin might fluctuated slightly but has generally stayed the same over the last year, meaning it will take a fundamental shift in the business model to change.
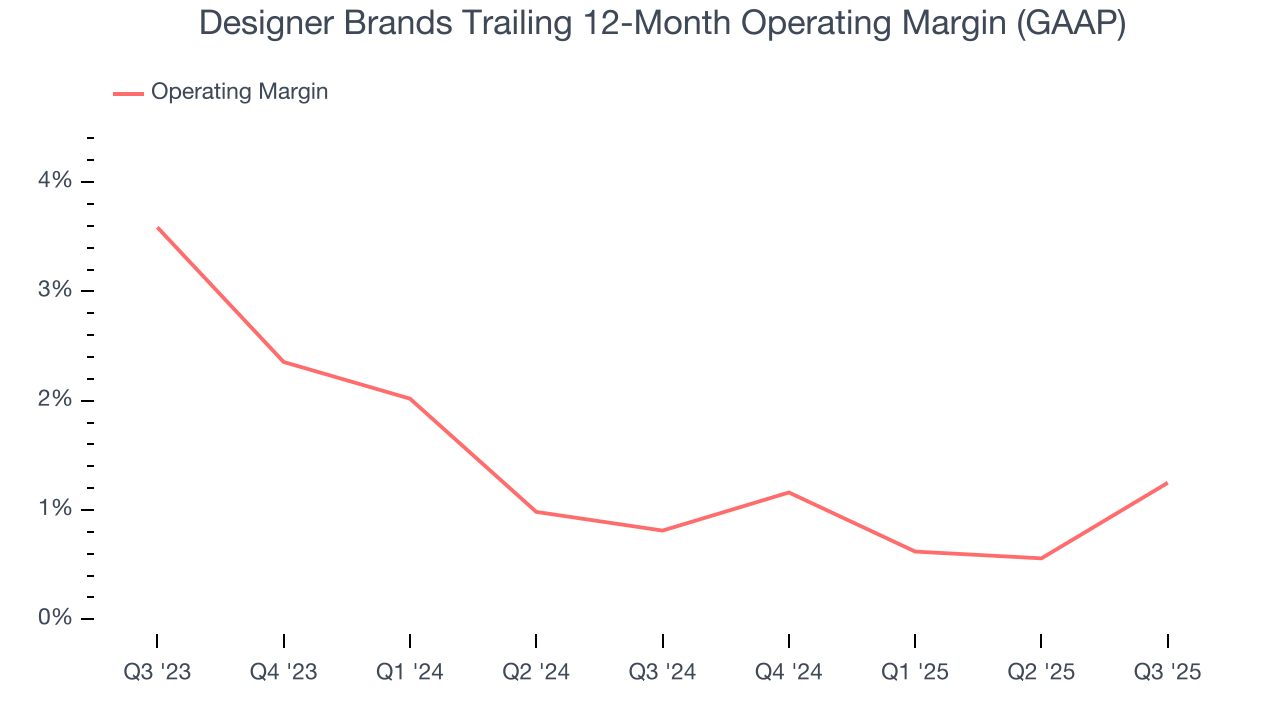
In Q3, Designer Brands generated an operating margin profit margin of 5.7%, up 2.7 percentage points year on year. Since its gross margin expanded more than its operating margin, we can infer that leverage on its cost of sales was the primary driver behind the recently higher efficiency.
9. Earnings Per Share
Revenue trends explain a company’s historical growth, but the long-term change in earnings per share (EPS) points to the profitability of that growth – for example, a company could inflate its sales through excessive spending on advertising and promotions.
Sadly for Designer Brands, its EPS declined by 78.2% annually over the last three years, more than its revenue. This tells us the company struggled because its fixed cost base made it difficult to adjust to shrinking demand.
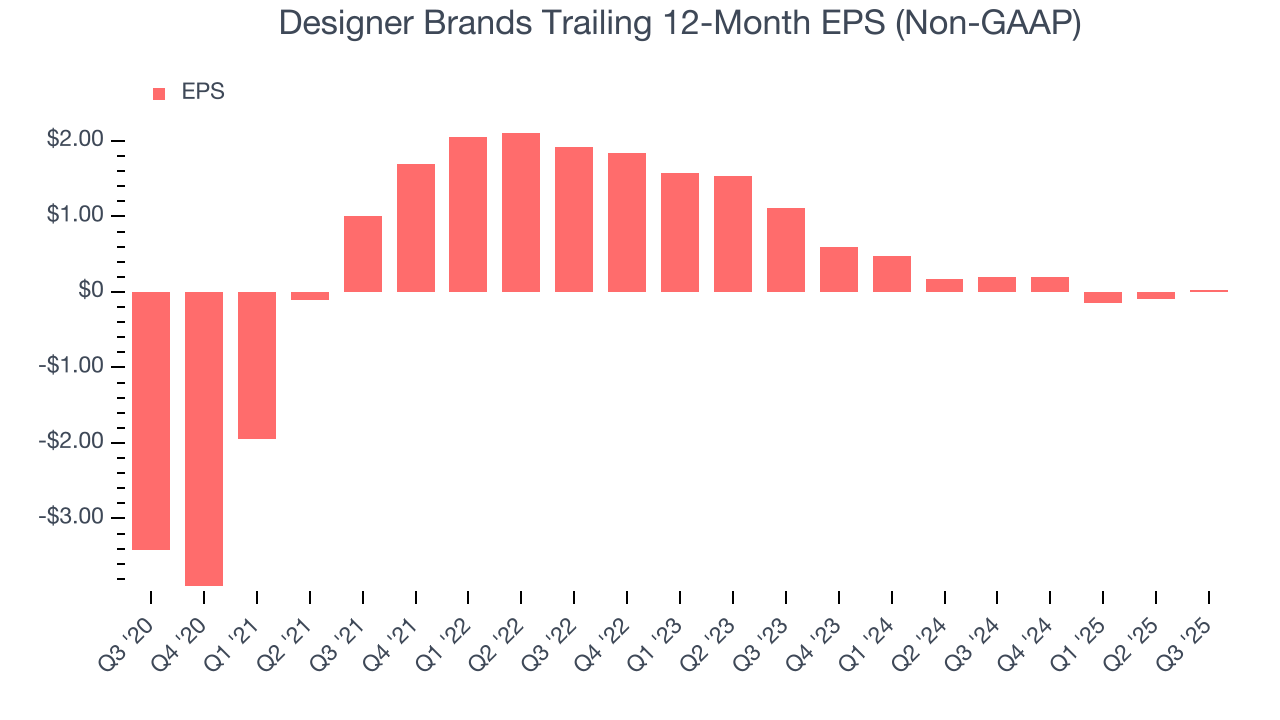
In Q3, Designer Brands reported adjusted EPS of $0.38, up from $0.27 in the same quarter last year. This print easily cleared analysts’ estimates, and shareholders should be content with the results. Over the next 12 months, Wall Street expects Designer Brands’s full-year EPS of $0.02 to grow 1,540%.
10. Cash Is King
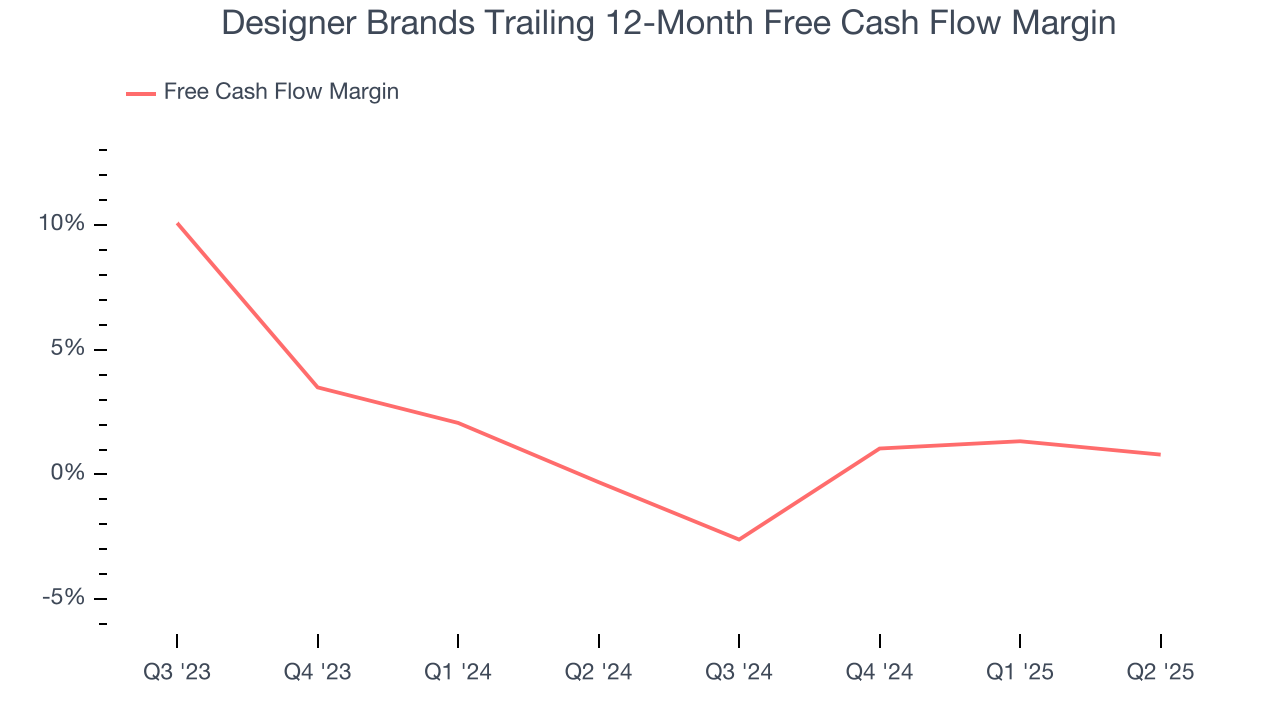
Although earnings are undoubtedly valuable for assessing company performance, we believe cash is king because you can’t use accounting profits to pay the bills.
Designer Brands broke even from a free cash flow perspective over the last two years, giving the company limited opportunities to return capital to shareholders.
11. Return on Invested Capital (ROIC)
EPS and free cash flow tell us whether a company was profitable while growing its revenue. But was it capital-efficient? Enter ROIC, a metric showing how much operating profit a company generates relative to the money it has raised (debt and equity).
Designer Brands historically did a mediocre job investing in profitable growth initiatives. Its five-year average ROIC was 4.5%, lower than the typical cost of capital (how much it costs to raise money) for consumer retail companies.
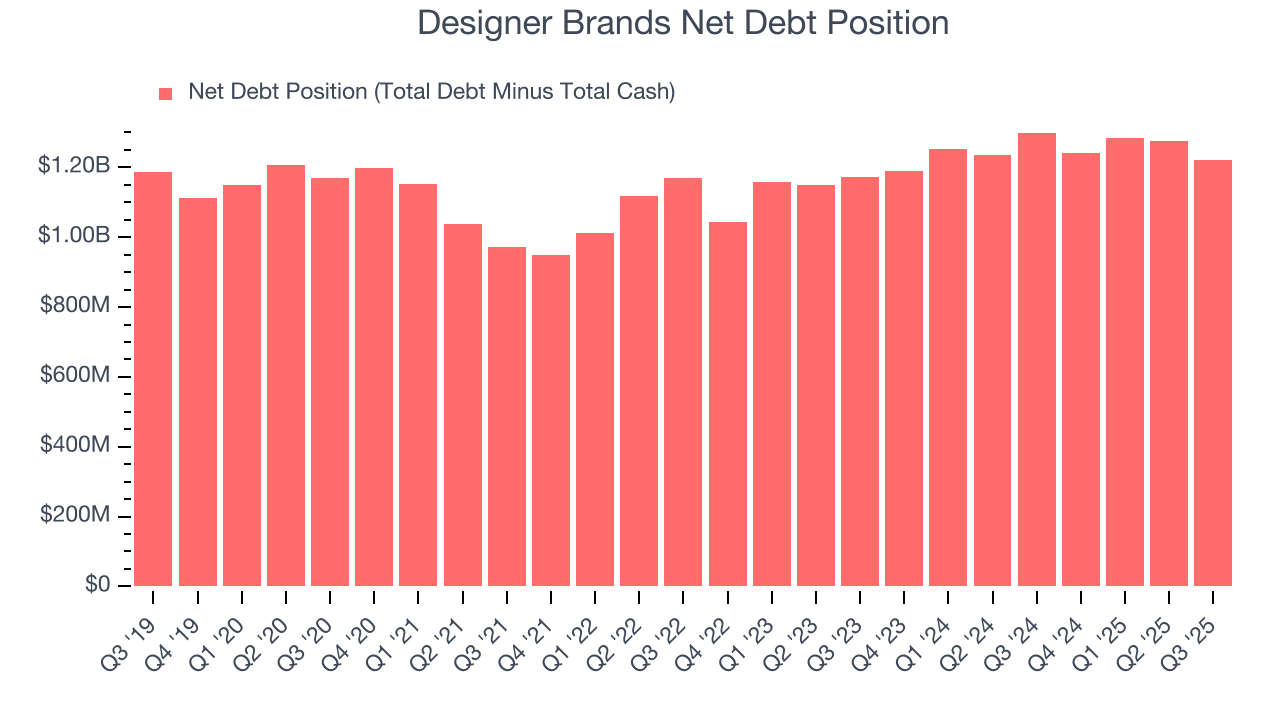
12. Balance Sheet Risk
As long-term investors, the risk we care about most is the permanent loss of capital, which can happen when a company goes bankrupt or raises money from a disadvantaged position. This is separate from short-term stock price volatility, something we are much less bothered by.
Designer Brands’s $1.27 billion of debt exceeds the $51.35 million of cash on its balance sheet. Furthermore, its 11× net-debt-to-EBITDA ratio (based on its EBITDA of $112.4 million over the last 12 months) shows the company is overleveraged.
At this level of debt, incremental borrowing becomes increasingly expensive and credit agencies could downgrade the company’s rating if profitability falls. Designer Brands could also be backed into a corner if the market turns unexpectedly – a situation we seek to avoid as investors in high-quality companies.
We hope Designer Brands can improve its balance sheet and remain cautious until it increases its profitability or pays down its debt.
13. Key Takeaways from Designer Brands’s Q3 Results
It was good to see Designer Brands beat analysts’ EPS expectations this quarter. We were also excited its gross margin outperformed Wall Street’s estimates by a wide margin. On the other hand, its revenue slightly missed. Overall, we think this was a solid quarter with some key areas of upside. The stock traded up 13.7% to $5.51 immediately following the results.
14. Is Now The Time To Buy Designer Brands?
Updated: March 24, 2026 at 10:48 PM EDT
Are you wondering whether to buy Designer Brands or pass? We urge investors to not only consider the latest earnings results but also longer-term business quality and valuation as well.
We see the value of companies helping consumers, but in the case of Designer Brands, we’re out. To begin with, its revenue has declined over the last three years. While its projected EPS for the next year implies the company’s fundamentals will improve, the downside is its declining EPS over the last three years makes it a less attractive asset to the public markets. On top of that, its relatively low ROIC suggests management has struggled to find compelling investment opportunities.
Designer Brands’s P/E ratio based on the next 12 months is 16.3x. At this valuation, there’s a lot of good news priced in - we think other companies feature superior fundamentals at the moment.
Wall Street analysts have a consensus one-year price target of $6.75 on the company (compared to the current share price of $5.31).
Although the price target is bullish, readers should exercise caution because analysts tend to be overly optimistic. The firms they work for, often big banks, have relationships with companies that extend into fundraising, M&A advisory, and other rewarding business lines. As a result, they typically hesitate to say bad things for fear they will lose out. We at StockStory do not suffer from such conflicts of interest, so we’ll always tell it like it is.