
MDU Resources (MDU)
We wouldn’t recommend MDU Resources. Not only are its sales cratering but also its low returns on capital suggest it struggles to generate profits.― StockStory Analyst Team
1. News


2. Summary
Why We Think MDU Resources Will Underperform
Founded to provide electricity to towns in Minnesota, MDU Resources (NYSE:MDU) provides products and services in the utilities and construction materials industries.
- Annual sales declines of 19.5% for the past five years show its products and services struggled to connect with the market during this cycle
- Falling earnings per share over the last four years has some investors worried as stock prices ultimately follow EPS over the long term
- Cash-burning tendencies make us wonder if it can sustainably generate shareholder value


MDU Resources’s quality doesn’t meet our bar. More profitable opportunities exist elsewhere.
Why There Are Better Opportunities Than MDU Resources


At $19.64 per share, MDU Resources trades at 21.2x forward P/E. Yes, this valuation multiple is lower than that of other industrials peers, but we’ll remind you that you often get what you pay for.
Cheap stocks can look like great bargains at first glance, but you often get what you pay for. These mediocre businesses often have less earnings power, meaning there is more reliance on a re-rating to generate good returns - an unlikely scenario for low-quality companies.
3. MDU Resources (MDU) Research Report: Q3 CY2025 Update
Energy and construction materials company MDU Resources (NYSE:MDU) reported Q3 CY2025 results exceeding the market’s revenue expectations. Sales fell by 70% year on year to $315.1 million due to a spinoff. Its GAAP profit of $0.09 per share decreased from $0.32 in the same quarter last year.
MDU Resources (MDU) Q3 CY2025 Highlights:
- Revenue: $315.1 million vs analyst estimates of $305 million (70% year-on-year decline, 3.3% beat)
- Adjusted EBITDA: $91.9 million vs analyst estimates of $99.45 million (29.2% margin, 7.6% miss)
- EPS (GAAP) guidance for the full year is $0.93 at the midpoint, missing analyst estimates by 1.6%
- Operating Margin: 12.6%, up from 8.7% in the same quarter last year
- Market Capitalization: $4.02 billion
Company Overview
Founded to provide electricity to towns in Minnesota, MDU Resources (NYSE:MDU) provides products and services in the utilities and construction materials industries.
The company operates in the electric and natural gas sectors within its utilities segment, with natural gas distribution services that give people the energy they need to cook, heat, and industrialize their homes and work, and electric distribution and transmission services that give people and companies power.
In addition, it provides construction materials like asphalt and ready-mix concrete, as well as its associated services, which include pipeline construction, electrical line construction, and renewable energy products like wind and solar power generation. MDU’s operation in both the utility and construction materials industries make it rare as most companies do not operate in both industries.
MDU’s exposure and footing in different markets are reflected in its income stream. The company earns revenue through the selling of its construction materials, the offering of its construction services, the provision of its electric and natural gas distribution, and the exploration and investment of its renewable energy products segment. Utilities is historically the company’s largest revenue-generating stream, which is sold through government-regulated utility operations. This makes recurring revenue a fundamental part of MDU’s business model because of its customers’ monthly energy bill payments.
4. Energy Products and Services
Areas like the energy transition and emission reduction are thematic and front of mind today. This can be a double-edged sword for the energy products and services industry. Those who innovate and build new expertise can jolt demand while those who cling to legacy technologies or fall behind in the trending areas could see their market shares diminish. Bigger picture, energy products and services companies are still at the whim of construction and infrastructure project volumes, which tend to be cyclical and can be impacted heavily by economic factors such as interest rates.
MDU’s top competitors include Xcel Energy (NYSE:XEL), CenterPoint Energy (NYSE:CNP), and Black Hills (NYSE:BKH).
5. Revenue Growth
Examining a company’s long-term performance can provide clues about its quality. Any business can put up a good quarter or two, but the best consistently grow over the long haul. MDU Resources struggled to consistently generate demand over the last five years as its sales dropped at a 19.4% annual rate. This was below our standards and suggests it’s a low quality business.
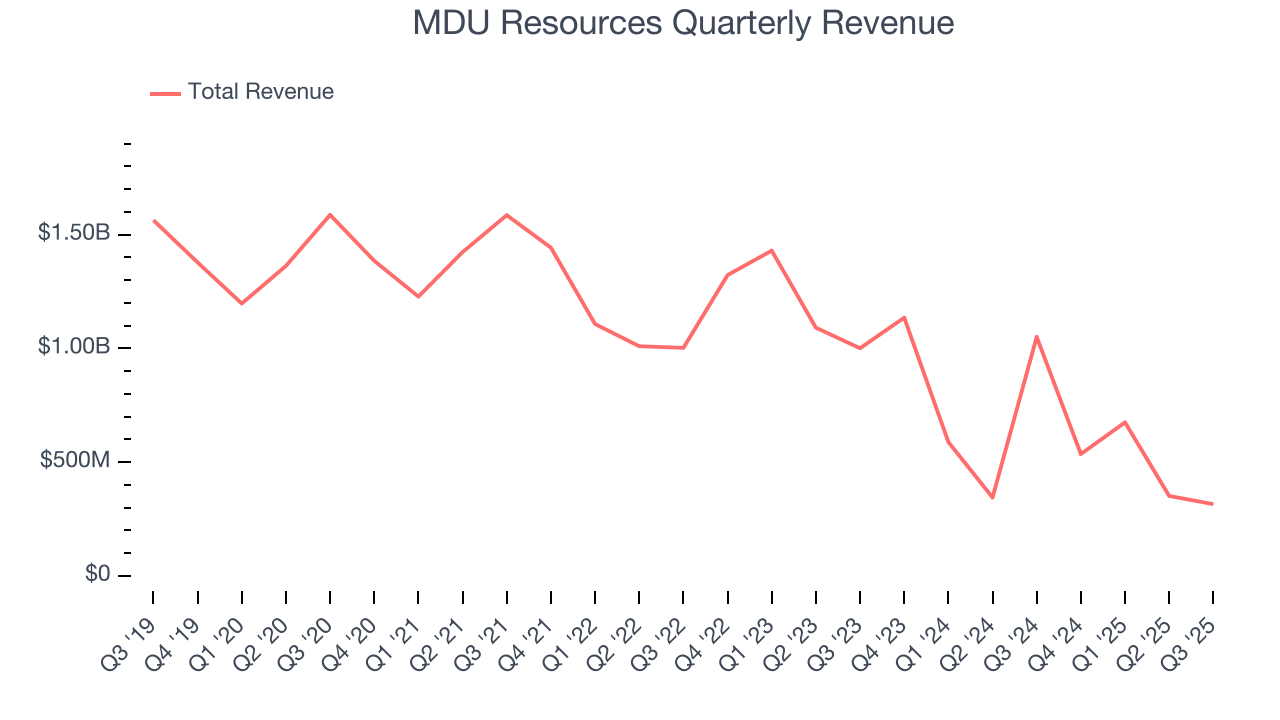
We at StockStory place the most emphasis on long-term growth, but within industrials, a half-decade historical view may miss cycles, industry trends, or a company capitalizing on catalysts such as a new contract win or a successful product line. MDU Resources’s recent performance shows its demand remained suppressed as its revenue has declined by 37.8% annually over the last two years. 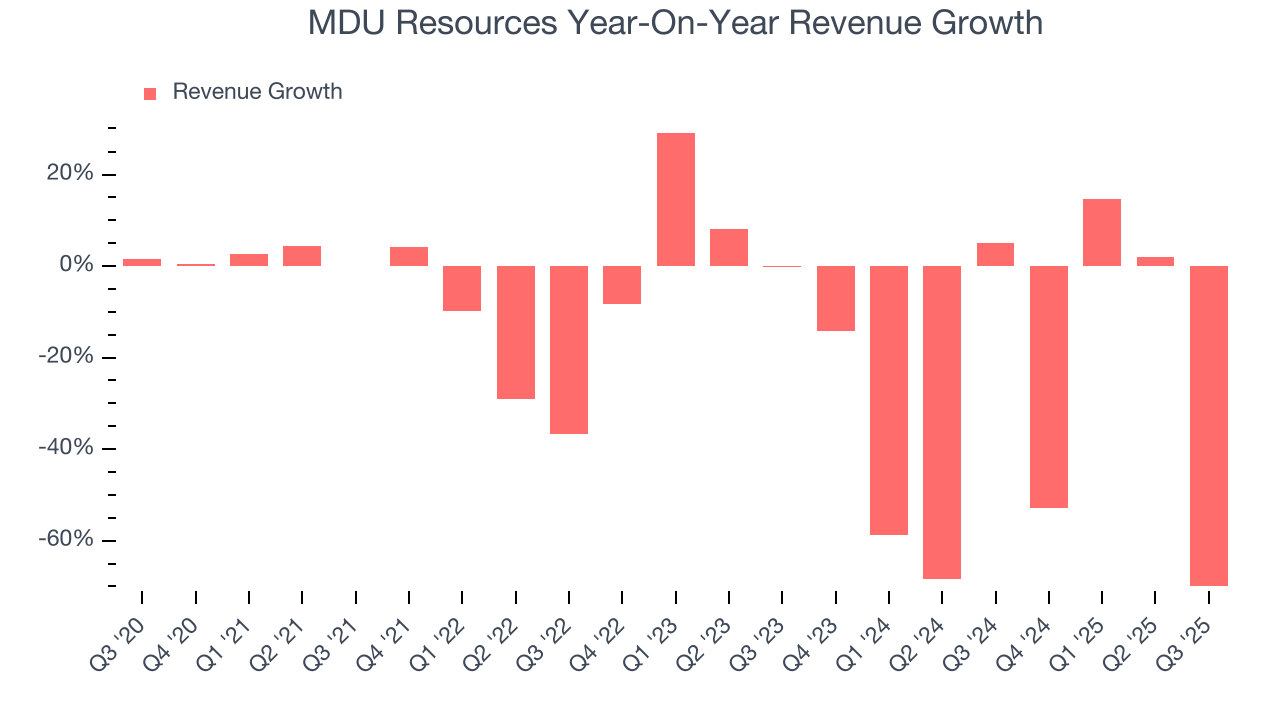
This quarter, MDU Resources’s revenue fell by 70% year on year to $315.1 million but beat Wall Street’s estimates by 3.3%.
Looking ahead, sell-side analysts expect revenue to remain flat over the next 12 months. While this projection indicates its newer products and services will fuel better top-line performance, it is still below the sector average.
6. Gross Margin & Pricing Power
Gross profit margin is a critical metric to track because it sheds light on its pricing power, complexity of products, and ability to procure raw materials, equipment, and labor.
MDU Resources has best-in-class unit economics for an industrials company, enabling it to invest in areas such as research and development. Its margin also signals it sells differentiated products, not commodities. As you can see below, it averaged an elite 42.1% gross margin over the last five years. That means MDU Resources only paid its suppliers $57.88 for every $100 in revenue. 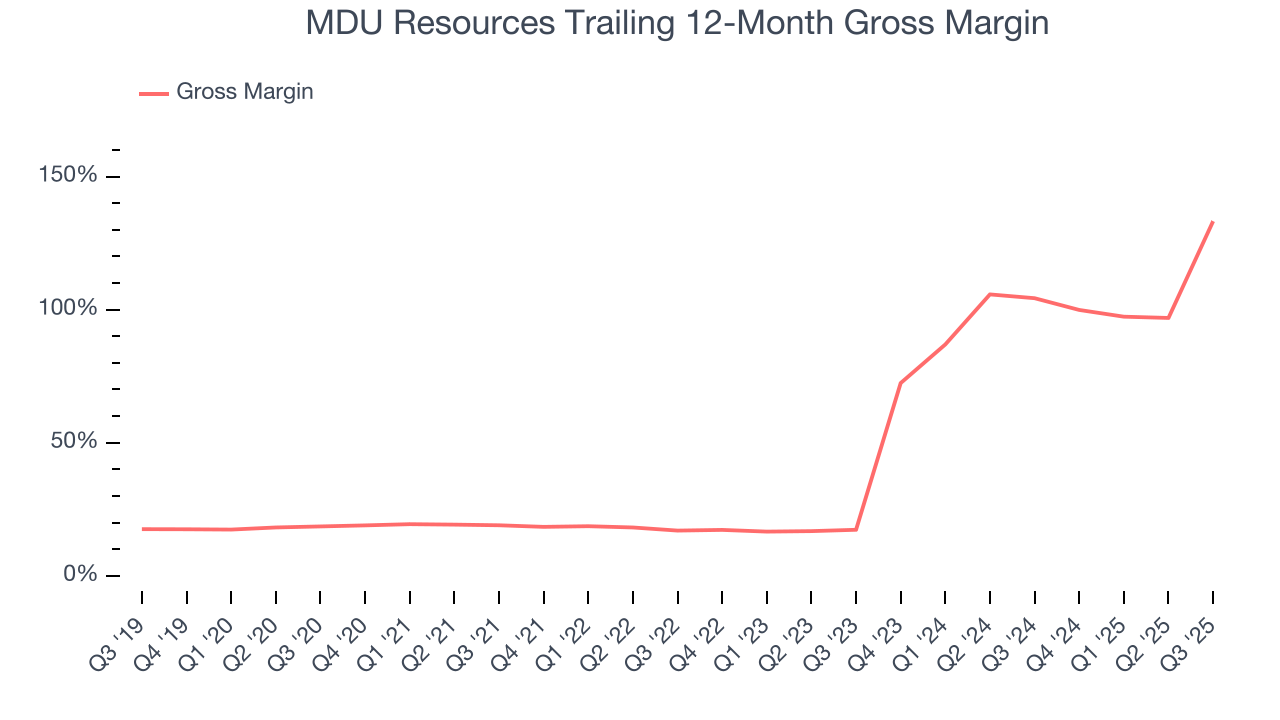
In Q3, MDU Resources produced a 49.1% gross profit margin, up 31.5 percentage points year on year. MDU Resources’s full-year margin has also been trending up over the past 12 months, increasing by 28.9 percentage points. If this move continues, it could suggest an environment where the company has better pricing power and stable or shrinking input costs (such as raw materials).
7. Operating Margin
MDU Resources has managed its cost base well over the last five years. It demonstrated solid profitability for an industrials business, producing an average operating margin of 10%. This result isn’t surprising as its high gross margin gives it a favorable starting point.
Analyzing the trend in its profitability, MDU Resources’s operating margin rose by 4.8 percentage points over the last five years, showing its efficiency has improved.
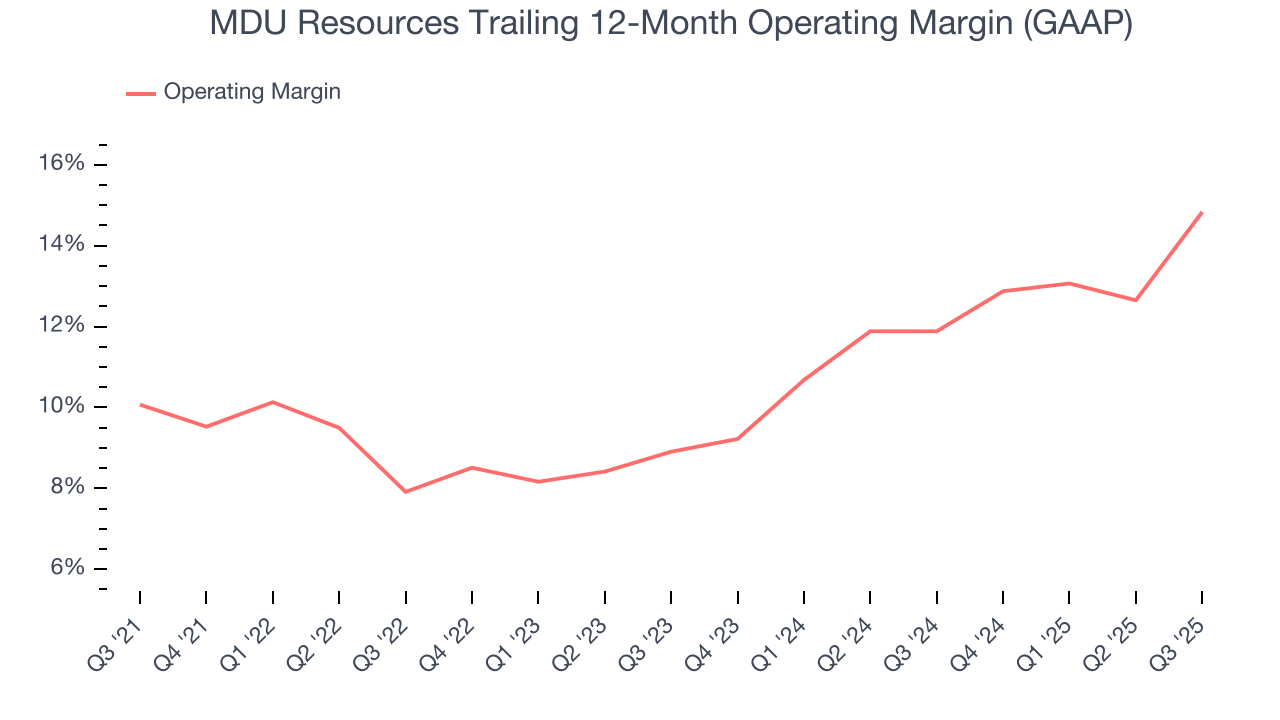
This quarter, MDU Resources generated an operating margin profit margin of 12.6%, up 3.9 percentage points year on year. Since its gross margin expanded more than its operating margin, we can infer that leverage on its cost of sales was the primary driver behind the recently higher efficiency.
8. Earnings Per Share
Revenue trends explain a company’s historical growth, but the long-term change in earnings per share (EPS) points to the profitability of that growth – for example, a company could inflate its sales through excessive spending on advertising and promotions.
Sadly for MDU Resources, its EPS and revenue declined by 14.9% and 19.4% annually over the last five years. We tend to steer our readers away from companies with falling revenue and EPS, where diminishing earnings could imply changing secular trends and preferences. If the tide turns unexpectedly, MDU Resources’s low margin of safety could leave its stock price susceptible to large downswings.
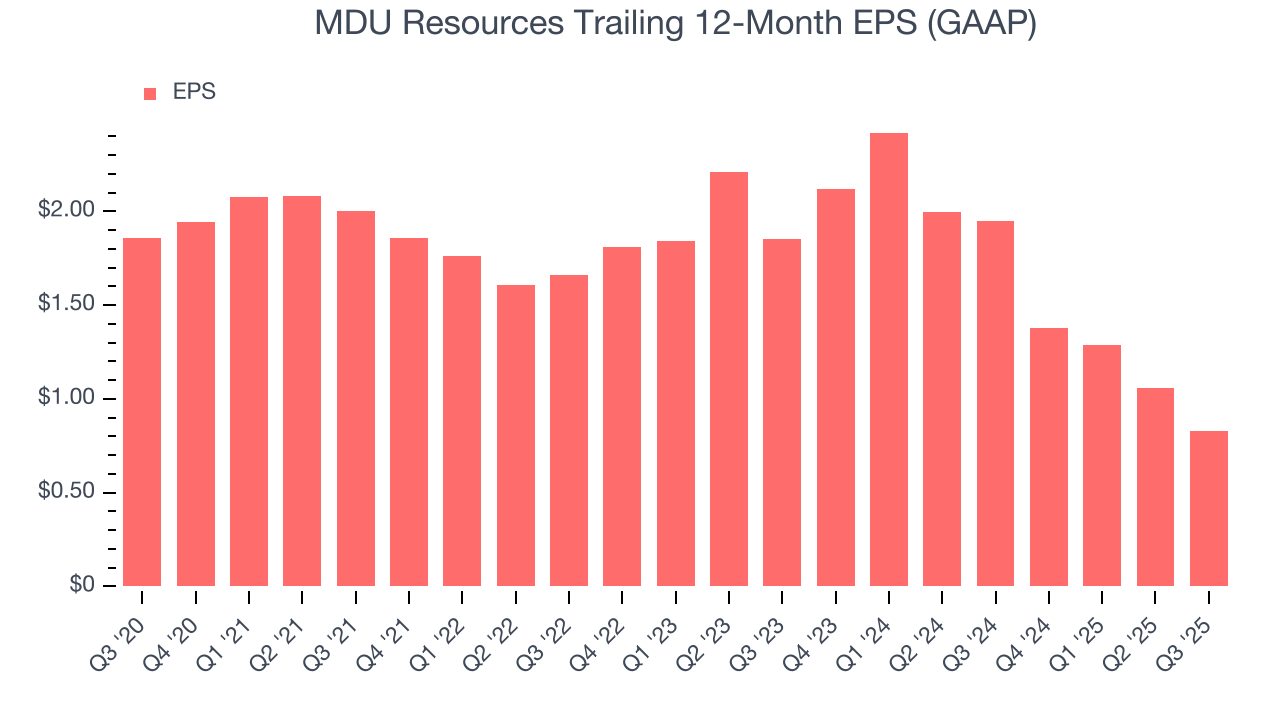
Like with revenue, we analyze EPS over a shorter period to see if we are missing a change in the business.
For MDU Resources, its two-year annual EPS declines of 33% show it’s continued to underperform. These results were bad no matter how you slice the data.
In Q3, MDU Resources reported EPS of $0.09, down from $0.32 in the same quarter last year. We also like to analyze expected EPS growth based on Wall Street analysts’ consensus projections, but there is insufficient data.
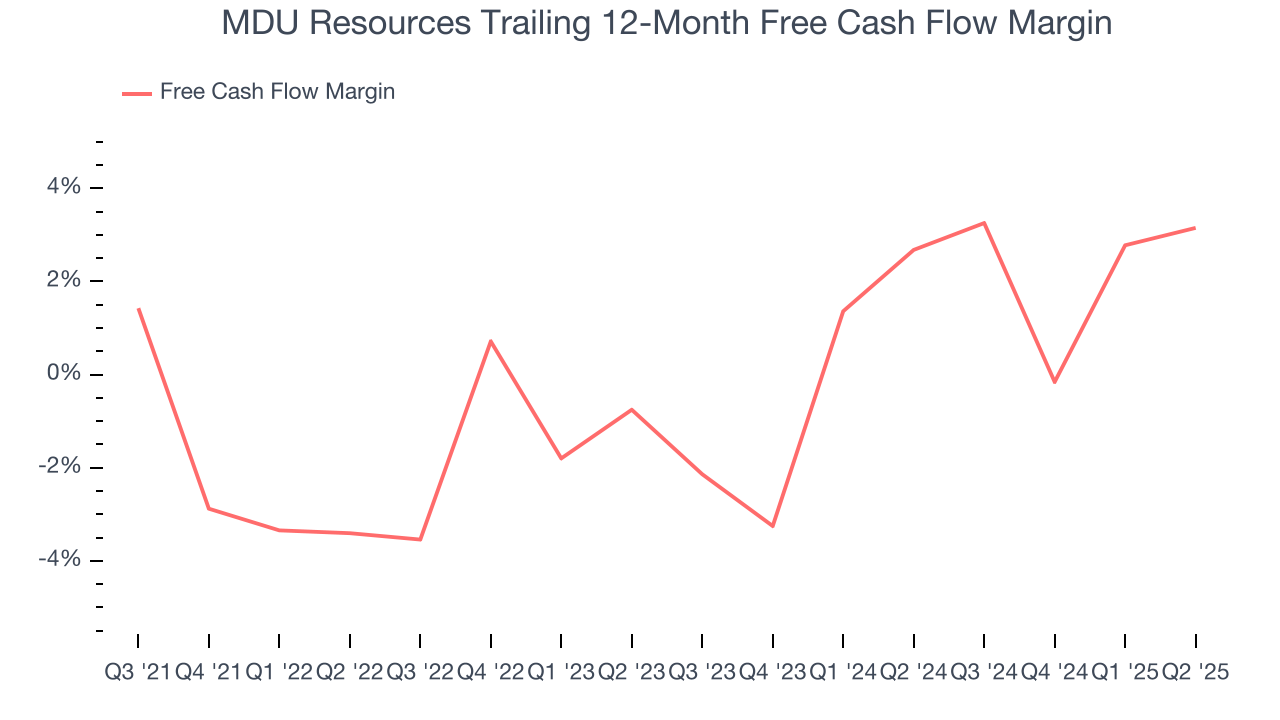
9. Cash Is King
Although earnings are undoubtedly valuable for assessing company performance, we believe cash is king because you can’t use accounting profits to pay the bills.
MDU Resources broke even from a free cash flow perspective over the last five years, giving the company limited opportunities to return capital to shareholders. The divergence from its good operating margin stems from its capital-intensive business model, which requires MDU Resources to make large cash investments in working capital and capital expenditures.
Taking a step back, an encouraging sign is that MDU Resources’s margin expanded by 4.8 percentage points during that time. We have no doubt shareholders would like to continue seeing its cash conversion rise as it gives the company more optionality.
10. Return on Invested Capital (ROIC)
EPS and free cash flow tell us whether a company was profitable while growing its revenue. But was it capital-efficient? Enter ROIC, a metric showing how much operating profit a company generates relative to the money it has raised (debt and equity).
MDU Resources historically did a mediocre job investing in profitable growth initiatives. Its five-year average ROIC was 6.8%, somewhat low compared to the best industrials companies that consistently pump out 20%+.
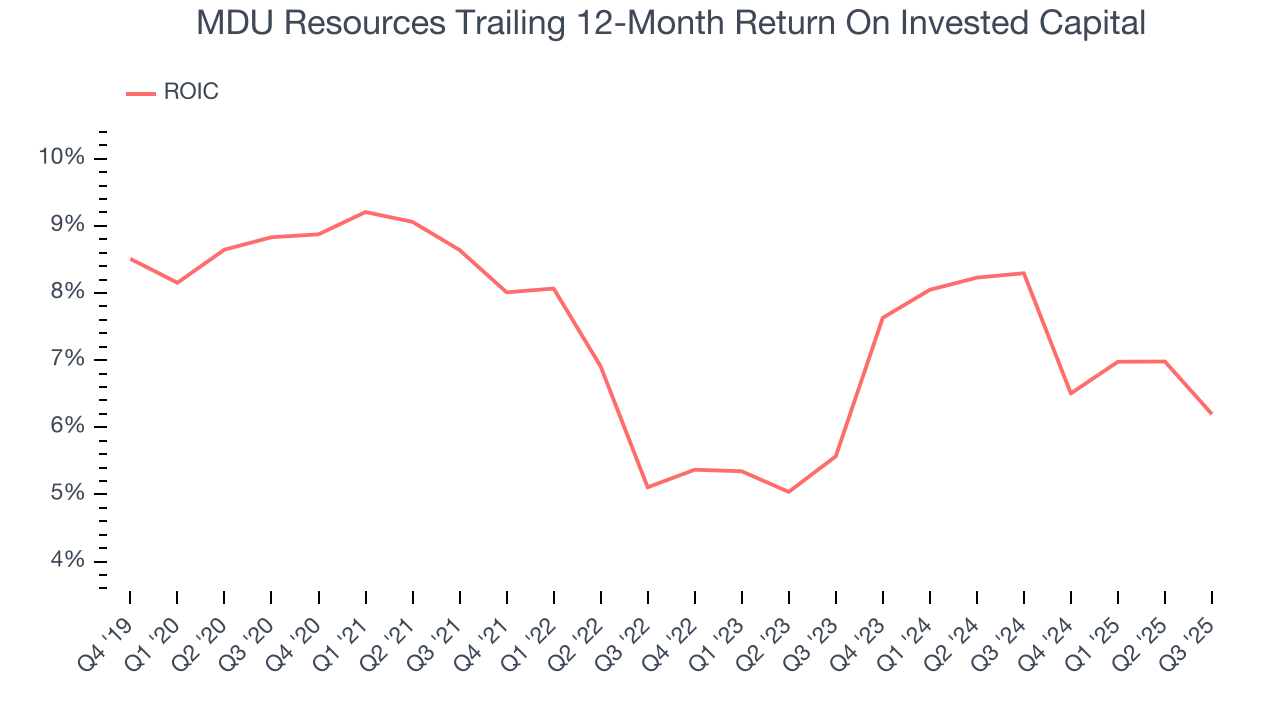
We like to invest in businesses with high returns, but the trend in a company’s ROIC is what often surprises the market and moves the stock price. Unfortunately, MDU Resources’s ROIC has stayed the same over the last few years. If the company wants to become an investable business, it must improve its returns by generating more profitable growth.
11. Balance Sheet Assessment
MDU Resources reported $75.9 million of cash and $2.35 billion of debt on its balance sheet in the most recent quarter. As investors in high-quality companies, we primarily focus on two things: 1) that a company’s debt level isn’t too high and 2) that its interest payments are not excessively burdening the business.
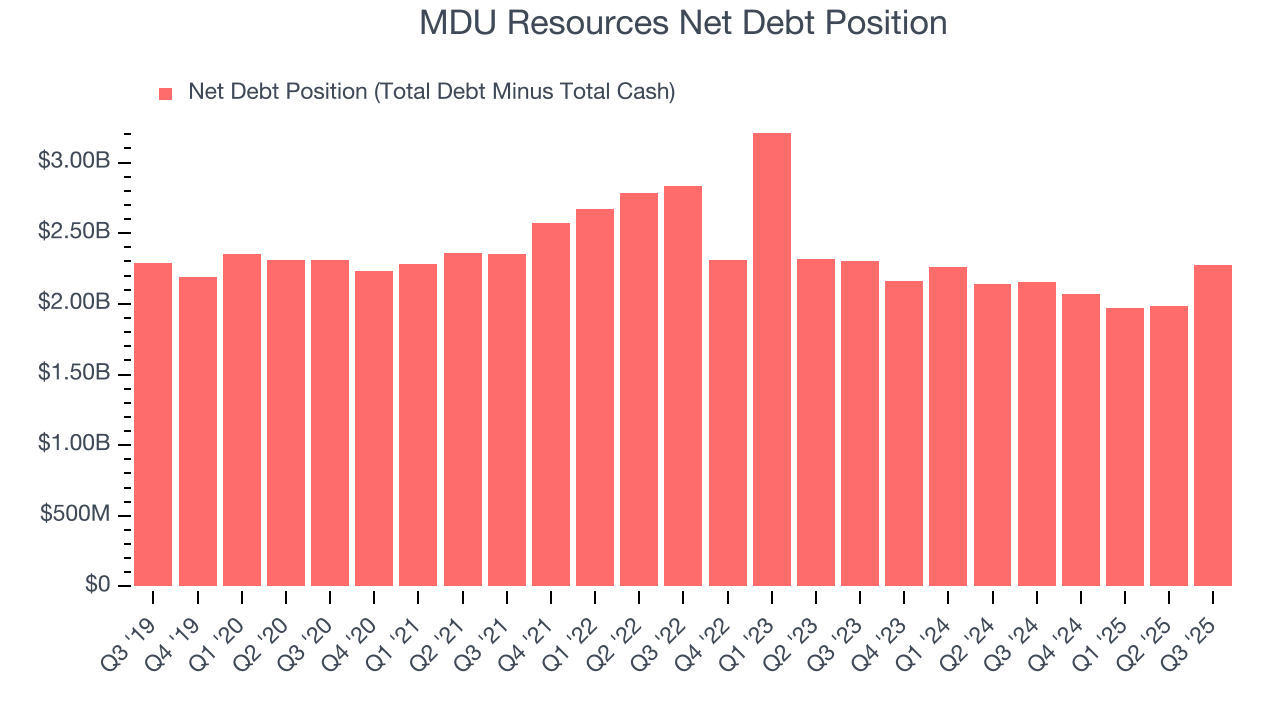
With $468.8 million of EBITDA over the last 12 months, we view MDU Resources’s 4.9× net-debt-to-EBITDA ratio as safe. We also see its $47.43 million of annual interest expenses as appropriate. The company’s profits give it plenty of breathing room, allowing it to continue investing in growth initiatives.
12. Key Takeaways from MDU Resources’s Q3 Results
We enjoyed seeing MDU Resources beat analysts’ revenue expectations this quarter. On the other hand, its EBITDA missed and its full-year EPS guidance fell short of Wall Street’s estimates. Overall, this was a softer quarter. The stock remained flat at $19.66 immediately following the results.
13. Is Now The Time To Buy MDU Resources?
Updated: December 18, 2025 at 11:31 PM EST
Before deciding whether to buy MDU Resources or pass, we urge investors to consider business quality, valuation, and the latest quarterly results.
We see the value of companies helping their customers, but in the case of MDU Resources, we’re out. To kick things off, its revenue has declined over the last five years. And while its rising cash profitability gives it more optionality, the downside is its declining EPS over the last five years makes it a less attractive asset to the public markets. On top of that, its declining operating margin shows the business has become less efficient.
MDU Resources’s P/E ratio based on the next 12 months is 19.7x. At this valuation, there’s a lot of good news priced in - we think there are better stocks to buy right now.
Wall Street analysts have a consensus one-year price target of $20.80 on the company (compared to the current share price of $19.16).