Restaurant Brands (QSR)
Restaurant Brands doesn’t excite us. Its sales and earnings are expected to be muted over the next 12 months, implying a dearth of catalysts.― StockStory Analyst Team
1. News


2. Summary
Why Restaurant Brands Is Not Exciting
Formed through a strategic merger, Restaurant Brands International (NYSE:QSR) is a multinational corporation that owns three iconic fast-food chains: Burger King, Tim Hortons, and Popeyes.
- Estimated sales growth of 4.3% for the next 12 months implies demand will slow from its six-year trend
- Annual earnings per share growth of 5.1% underperformed its revenue over the last six years, showing its incremental sales were less profitable
- The good news is that its excellent operating margin highlights the strength of its business model


Restaurant Brands doesn’t fulfill our quality requirements. We’re redirecting our focus to better businesses.
Why There Are Better Opportunities Than Restaurant Brands

Restaurant Brands is trading at $73.94 per share, or 18.4x forward P/E. This multiple is lower than most restaurant companies, but for good reason.
Our advice is to pay up for elite businesses whose advantages are tailwinds to earnings growth. Don’t get sucked into lower-quality businesses just because they seem like bargains. These mediocre businesses often never achieve a higher multiple as hoped, a phenomenon known as a “value trap”.
3. Restaurant Brands (QSR) Research Report: Q4 CY2025 Update
Fast-food company Restaurant Brands (NYSE:QSR) reported revenue ahead of Wall Street’s expectations in Q4 CY2025, with sales up 7.4% year on year to $2.47 billion. Its non-GAAP profit of $0.96 per share was 1.3% above analysts’ consensus estimates.
Restaurant Brands (QSR) Q4 CY2025 Highlights:
- Revenue: $2.47 billion vs analyst estimates of $2.41 billion (7.4% year-on-year growth, 2.1% beat)
- Adjusted EPS: $0.96 vs analyst estimates of $0.95 (1.3% beat)
- Adjusted EBITDA: $772 million vs analyst estimates of $768.5 million (31.3% margin, in line)
- Operating Margin: 25.2%, down from 27.7% in the same quarter last year
- Free Cash Flow Margin: 18.4%, similar to the same quarter last year
- Locations: 33,041 at quarter end, up from 32,125 in the same quarter last year
- Same-Store Sales rose 3.1% year on year, in line with the same quarter last year
- Market Capitalization: $23.18 billion
Company Overview
Formed through a strategic merger, Restaurant Brands International (NYSE:QSR) is a multinational corporation that owns three iconic fast-food chains: Burger King, Tim Hortons, and Popeyes.
The company was born in 2014 when Burger King (American fast-food) and Tim Hortons (Canadian coffee chain) merged to form Restaurant Brands International under the leadership of Brazilian private equity firm 3G Capital. This move brought together two iconic brands with complementary strengths, allowing Restaurant Brands International to leverage their combined resources and expertise. The company expanded further in 2017 when it acquired Popeyes (fried chicken), adding a new dimension of growth to its portfolio of brands.
Each fast-food chain brings different flavors to the table. Burger King, known for its Whopper and Chicken Fries, specializes in flame-grilled burgers. Tim Hortons has captured the hearts of Canadians and coffee lovers worldwide with its exceptional brews and delectable doughnuts. Popeyes, renowned for its flavorful Louisiana-style fried chicken, brings its distinctive Cajun-inspired seasonings and fried chicken sandwich (once impossible to get) to the global stage.
Much of Restaurant Brands International’s success can be attributed to its focus on customer convenience and digital advancements. It’s developed mobile apps to facilitate online ordering, customization, and loyalty rewards while partnering with leading delivery platforms to ensure that customers can indulge in their favorite meals wherever they may be.
4. Traditional Fast Food
Traditional fast-food restaurants are renowned for their speed and convenience, boasting menus filled with familiar and budget-friendly items. Their reputations for on-the-go consumption make them favored destinations for individuals and families needing a quick meal. This class of restaurants, however, is fighting the perception that their meals are unhealthy and made with inferior ingredients, a battle that's especially relevant today given the consumers increasing focus on health and wellness.
Restaurant Brands’ competitors include McDonald’s (NYSE:MCD), Shake Shack (NYSE:SHAK), Wendy’s (NASDAQ:WEN), and Taco Bell and KFC (owned by Yum! Brands, NYSE:YUM).
5. Revenue Growth
A company’s long-term performance is an indicator of its overall quality. Any business can have short-term success, but a top-tier one grows for years.
With $9.43 billion in revenue over the past 12 months, Restaurant Brands is one of the most widely recognized restaurant chains and benefits from customer loyalty, a luxury many don’t have. Its scale also gives it negotiating leverage with suppliers, enabling it to source its ingredients at a lower cost.
As you can see below, Restaurant Brands’s 9.1% annualized revenue growth over the last six years was decent as it opened new restaurants and increased sales at existing, established dining locations.
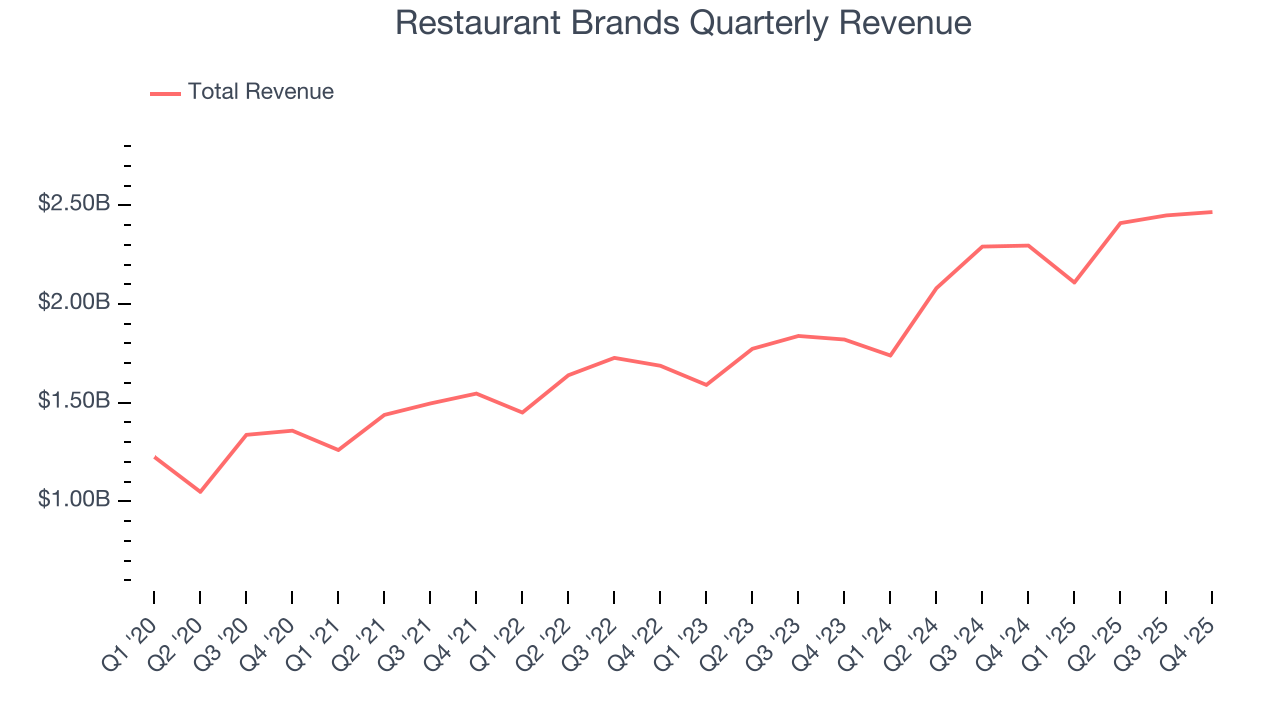
This quarter, Restaurant Brands reported year-on-year revenue growth of 7.4%, and its $2.47 billion of revenue exceeded Wall Street’s estimates by 2.1%.
Looking ahead, sell-side analysts expect revenue to grow 3.5% over the next 12 months, a deceleration versus the last six years. This projection is underwhelming and suggests its menu offerings will see some demand headwinds.
6. Restaurant Performance
Number of Restaurants
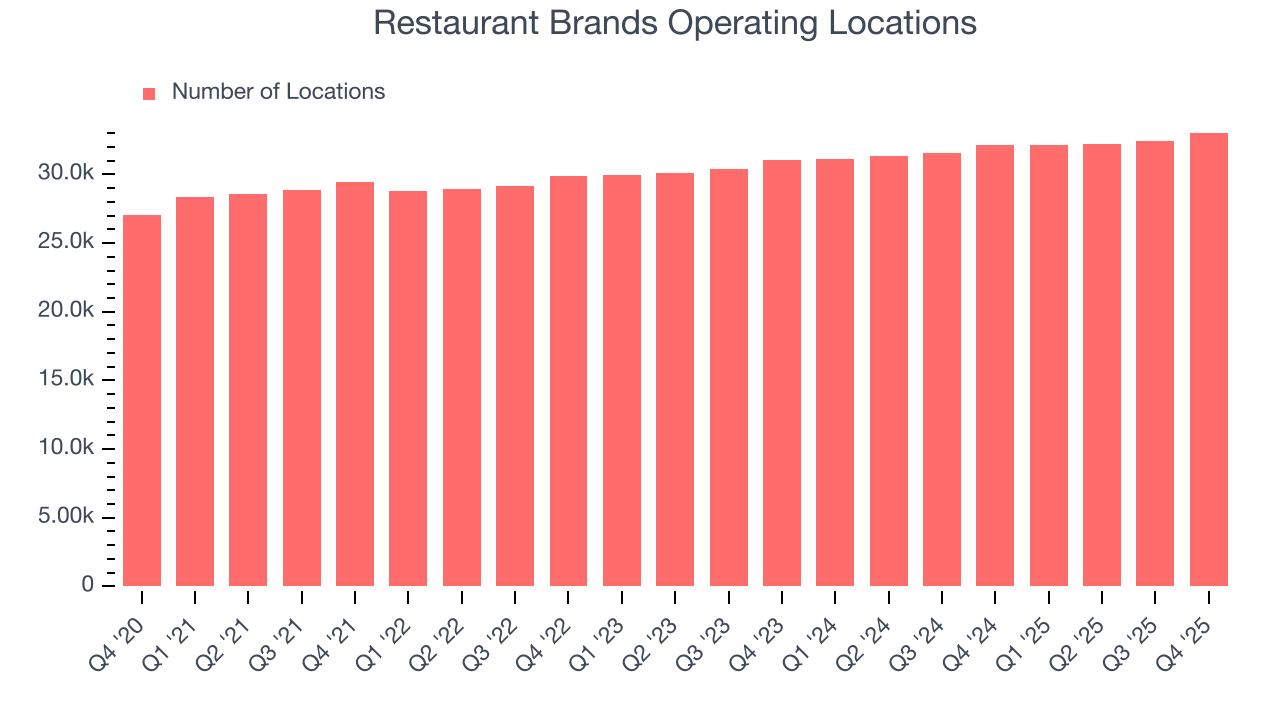
Restaurant Brands operated 33,041 locations in the latest quarter. It has opened new restaurants quickly over the last two years, averaging 3.4% annual growth, faster than the broader restaurant sector. Additionally, one dynamic making expansion more seamless is the company’s franchise model, where franchisees are primarily responsible for opening new restaurants while Restaurant Brands provides support.
When a chain opens new restaurants, it usually means it’s investing for growth because there’s healthy demand for its meals and there are markets where its concepts have few or no locations.
Same-Store Sales
The change in a company's restaurant base only tells one side of the story. The other is the performance of its existing locations, which informs management teams whether they should expand or downsize their physical footprints. Same-store sales provides a deeper understanding of this issue because it measures organic growth at restaurants open for at least a year.
Restaurant Brands’s demand rose over the last two years and slightly outpaced the industry. On average, the company’s same-store sales have grown by 2.4% per year. This performance suggests its rollout of new restaurants could be beneficial for shareholders. When a chain has demand, more locations should help it reach more customers and boost revenue growth.
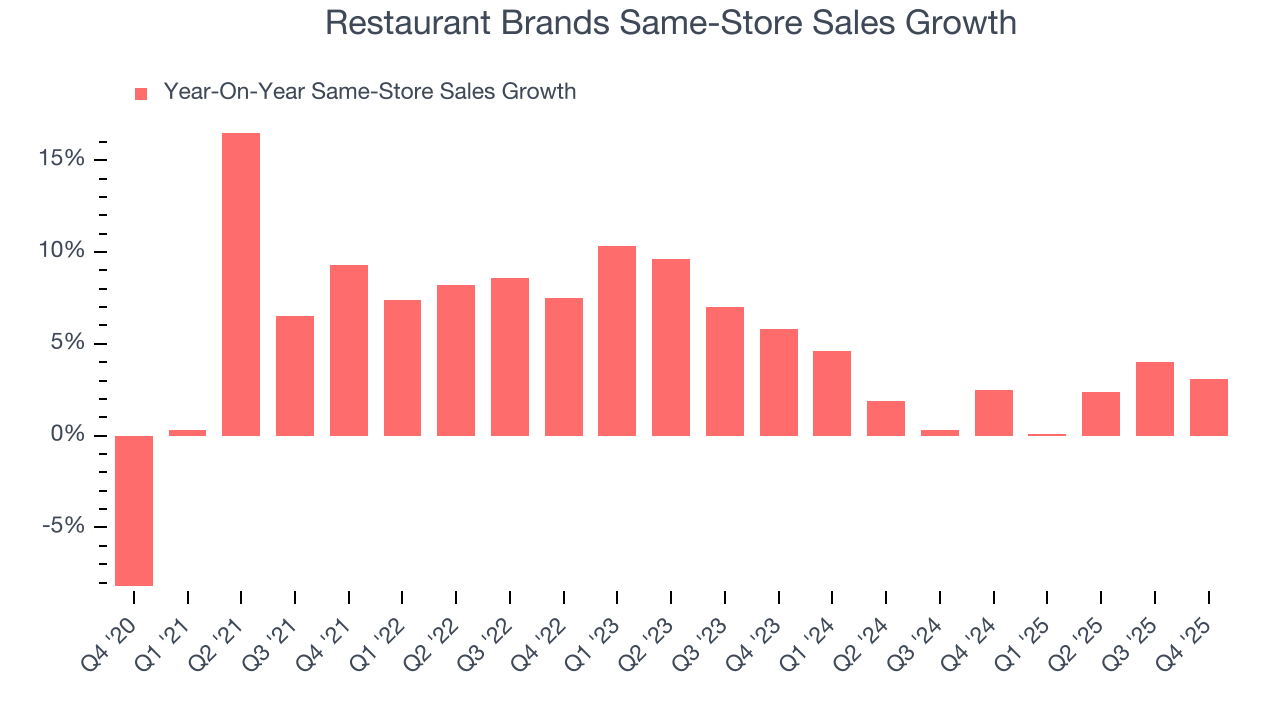
In the latest quarter, Restaurant Brands’s same-store sales rose 3.1% year on year. This performance was more or less in line with its historical levels.
7. Gross Margin & Pricing Power
Restaurant Brands has good unit economics for a restaurant company, giving it the opportunity to invest in areas such as marketing and talent to stay competitive. As you can see below, it averaged an impressive 34.8% gross margin over the last two years. That means for every $100 in revenue, roughly $34.85 was left to spend on selling, marketing, and general administrative overhead. 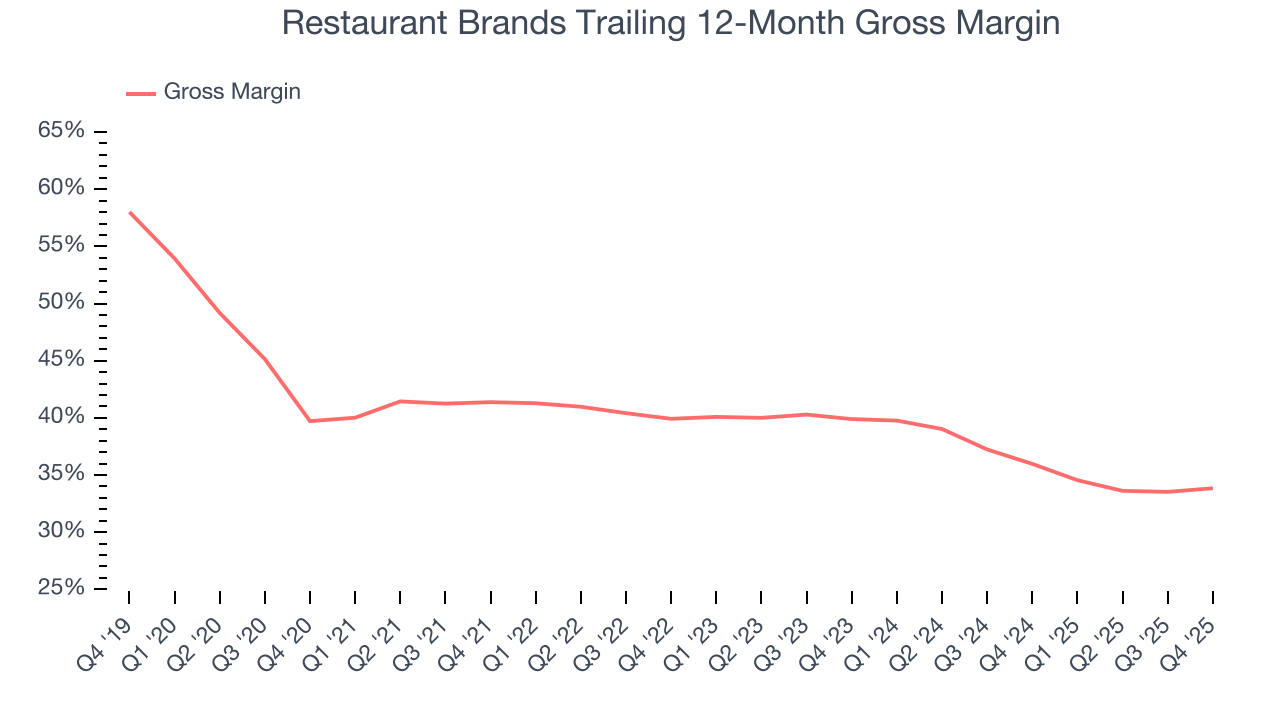
Restaurant Brands produced a 33.7% gross profit margin in Q4, marking a 1.3 percentage point increase from 32.4% in the same quarter last year. Zooming out, however, Restaurant Brands’s full-year margin has been trending down over the past 12 months, decreasing by 2.1 percentage points. If this move continues, it could suggest a more competitive environment with some pressure to lower prices and higher input costs (such as ingredients and transportation expenses).
8. Operating Margin
Restaurant Brands has been a well-oiled machine over the last two years. It demonstrated elite profitability for a restaurant business, boasting an average operating margin of 25.9%. This result isn’t too surprising as its gross margin gives it a favorable starting point.
Looking at the trend in its profitability, Restaurant Brands’s operating margin decreased by 5.4 percentage points over the last year. This raises questions about the company’s expense base because its revenue growth should have given it leverage on its fixed costs, resulting in better economies of scale and profitability.
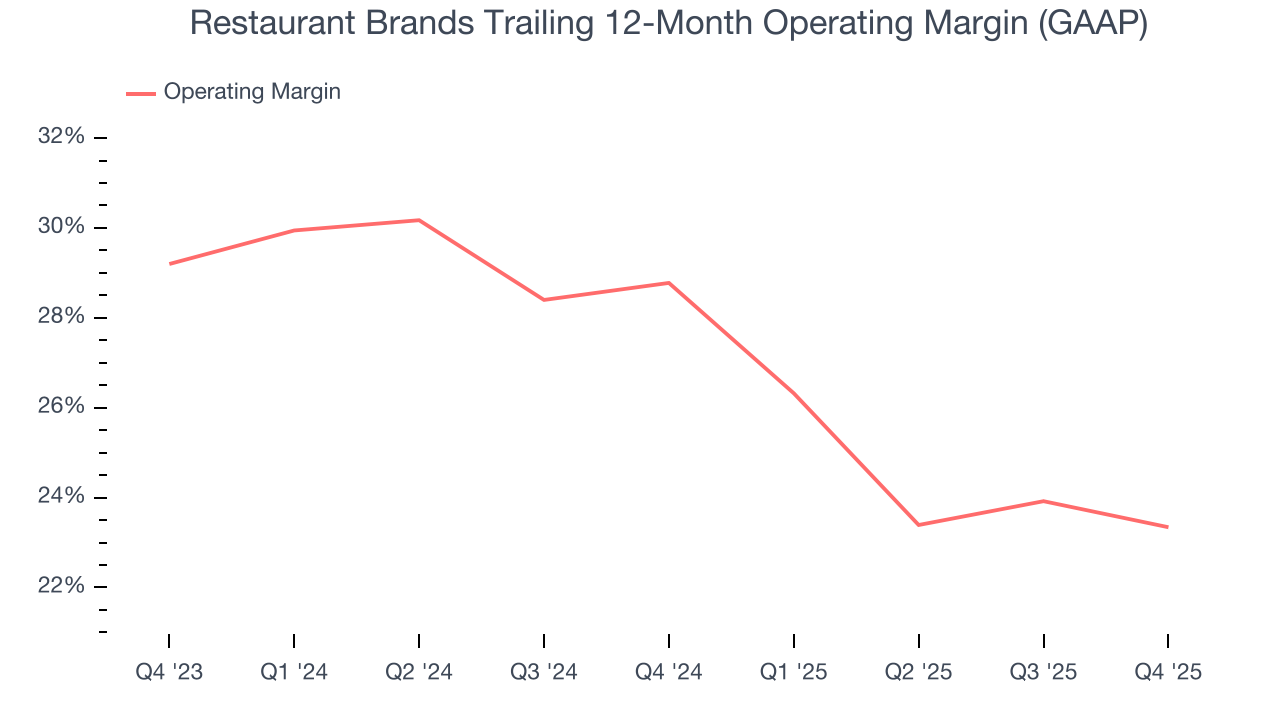
In Q4, Restaurant Brands generated an operating margin profit margin of 25.2%, down 2.5 percentage points year on year. Conversely, its revenue and gross margin actually rose, so we can assume it was less efficient because its operating expenses like marketing, and administrative overhead grew faster than its revenue.
9. Earnings Per Share
We track the long-term change in earnings per share (EPS) for the same reason as long-term revenue growth. Compared to revenue, however, EPS highlights whether a company’s growth is profitable.
Restaurant Brands’s EPS grew at an unimpressive 5.1% compounded annual growth rate over the last six years, lower than its 9.1% annualized revenue growth. This tells us the company became less profitable on a per-share basis as it expanded due to non-fundamental factors such as interest expenses and taxes.
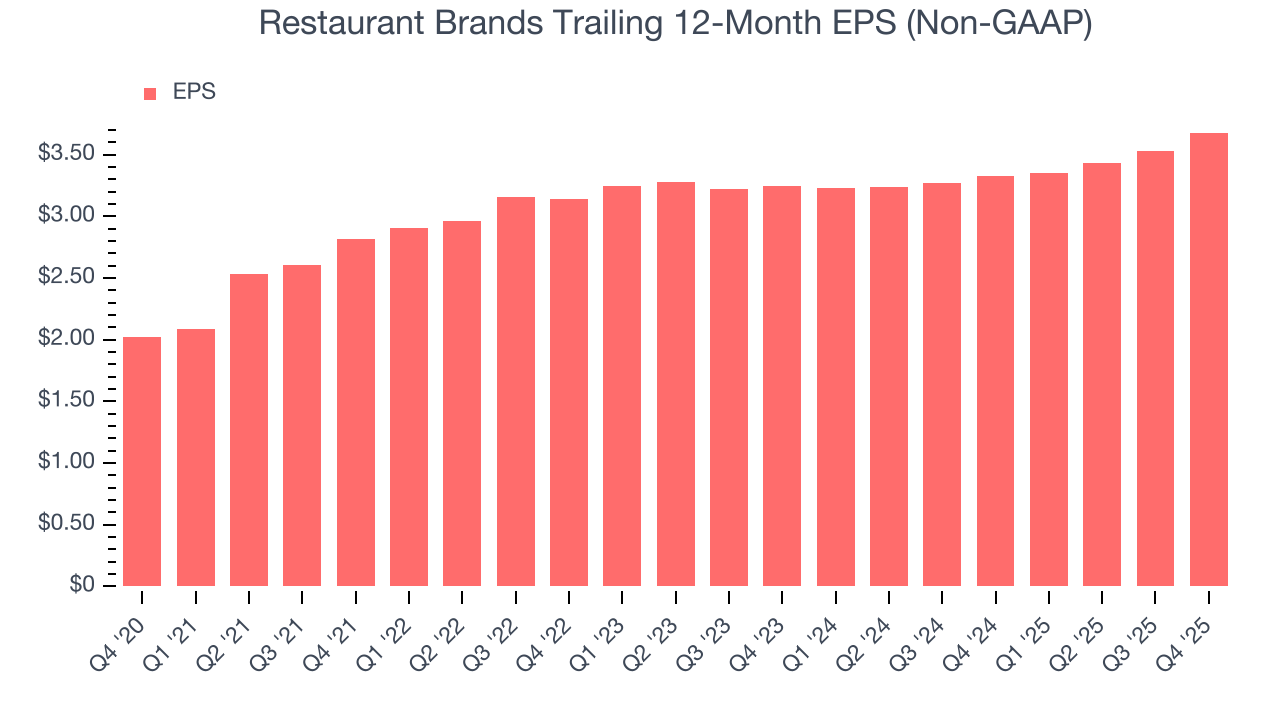
In Q4, Restaurant Brands reported adjusted EPS of $0.96, up from $0.81 in the same quarter last year. This print beat analysts’ estimates by 1.3%. Over the next 12 months, Wall Street expects Restaurant Brands’s full-year EPS of $3.68 to grow 9.4%.
10. Cash Is King
If you’ve followed StockStory for a while, you know we emphasize free cash flow. Why, you ask? We believe that in the end, cash is king, and you can’t use accounting profits to pay the bills.
Restaurant Brands has shown terrific cash profitability, driven by its lucrative business model that enables it to reinvest, return capital to investors, and stay ahead of the competition. The company’s free cash flow margin was among the best in the restaurant sector, averaging 15.4% over the last two years.
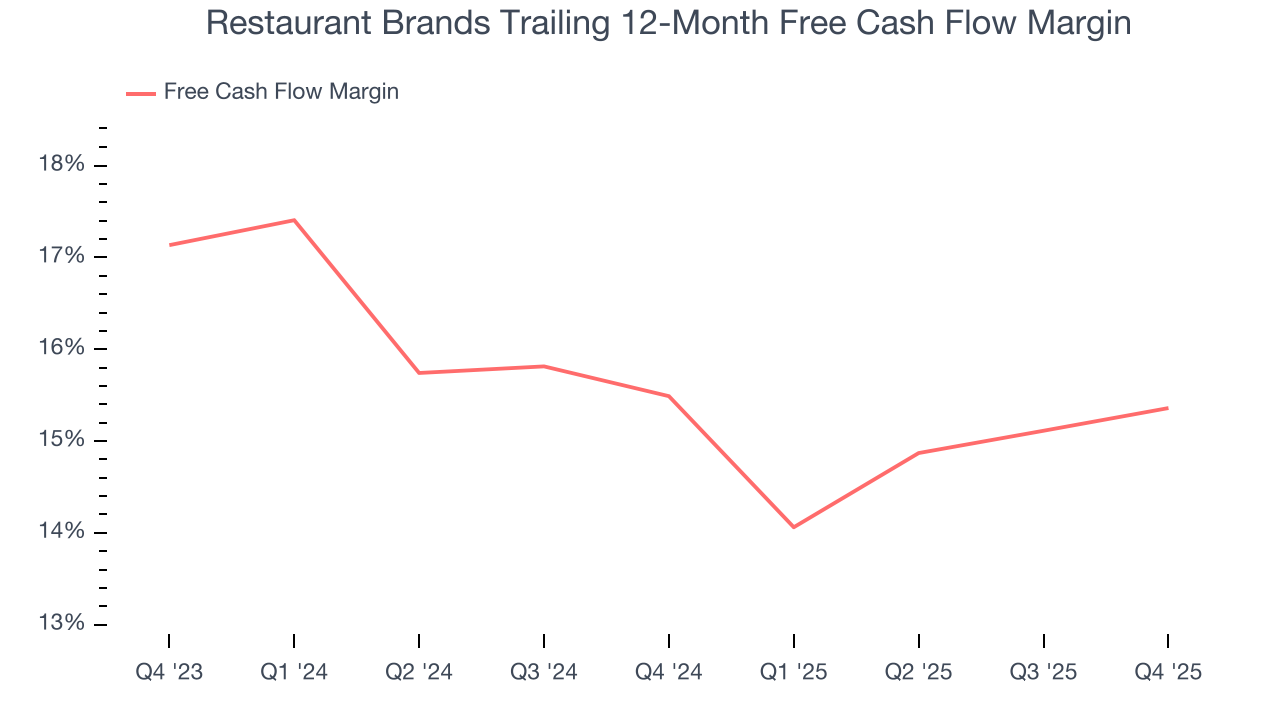
Restaurant Brands’s free cash flow clocked in at $453 million in Q4, equivalent to a 18.4% margin. This cash profitability was in line with the comparable period last year and above its two-year average.
11. Return on Invested Capital (ROIC)
EPS and free cash flow tell us whether a company was profitable while growing its revenue. But was it capital-efficient? A company’s ROIC explains this by showing how much operating profit it makes compared to the money it has raised (debt and equity).
Although Restaurant Brands hasn’t been the highest-quality company lately, it historically found a few growth initiatives that worked. Its five-year average ROIC was 11.9%, higher than most restaurant businesses.
12. Balance Sheet Assessment
Restaurant Brands reported $1.16 billion of cash and $15.48 billion of debt on its balance sheet in the most recent quarter. As investors in high-quality companies, we primarily focus on two things: 1) that a company’s debt level isn’t too high and 2) that its interest payments are not excessively burdening the business.
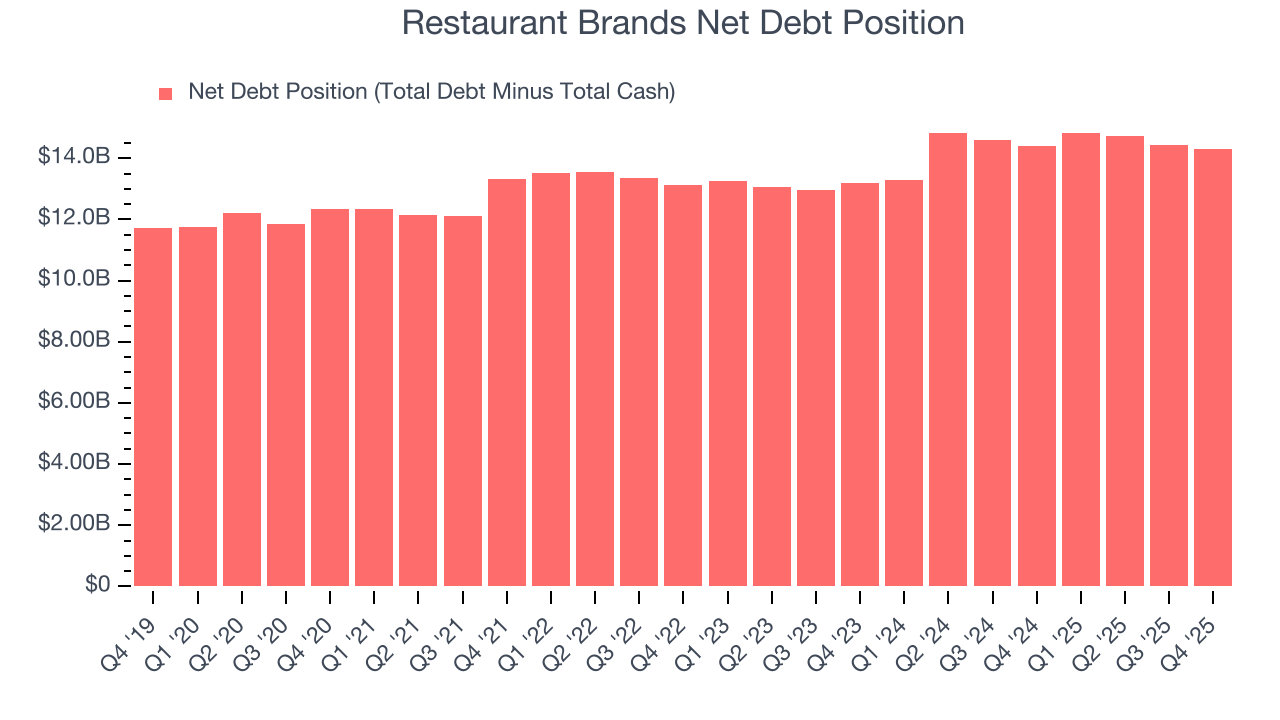
With $2.97 billion of EBITDA over the last 12 months, we view Restaurant Brands’s 4.8× net-debt-to-EBITDA ratio as safe. We also see its $266 million of annual interest expenses as appropriate. The company’s profits give it plenty of breathing room, allowing it to continue investing in growth initiatives.
13. Key Takeaways from Restaurant Brands’s Q4 Results
We enjoyed seeing Restaurant Brands beat analysts’ revenue expectations this quarter. We were also happy its same-store sales narrowly outperformed Wall Street’s estimates. Overall, we think this was still a solid quarter with some key areas of upside. The market seemed to be hoping for more, and the stock traded down 3.8% to $68.04 immediately after reporting.
14. Is Now The Time To Buy Restaurant Brands?
Updated: March 17, 2026 at 10:50 PM EDT
A common mistake we notice when investors are deciding whether to buy a stock or not is that they simply look at the latest earnings results. Business quality and valuation matter more, so we urge you to understand these dynamics as well.
Restaurant Brands doesn’t top our investment wishlist, but we understand that it’s not a bad business. First off, its revenue growth was solid over the last six years. And while Restaurant Brands’s projected EPS for the next year is lacking, its impressive operating margins show it has a highly efficient business model.
Restaurant Brands’s P/E ratio based on the next 12 months is 18.4x. This valuation is reasonable, but the company’s shakier fundamentals present too much downside risk. We're fairly confident there are better investments elsewhere.
Wall Street analysts have a consensus one-year price target of $79.79 on the company (compared to the current share price of $73.94).