
Regal Rexnord (RRX)
We’re cautious of Regal Rexnord. Its sales have underperformed and its low returns on capital show it has few growth opportunities.― StockStory Analyst Team
1. News


2. Summary
Why We Think Regal Rexnord Will Underperform
Headquartered in Milwaukee, Regal Rexnord (NYSE:RRX) provides power transmission and industrial automation products.
- Low returns on capital reflect management’s struggle to allocate funds effectively, and its decreasing returns suggest its historical profit centers are aging
- Organic revenue growth fell short of our benchmarks over the past two years and implies it may need to improve its products, pricing, or go-to-market strategy
- One positive is that its impressive 15.3% annual revenue growth over the last five years indicates it’s winning market share this cycle


Regal Rexnord’s quality isn’t great. There are superior opportunities elsewhere.
Why There Are Better Opportunities Than Regal Rexnord


Regal Rexnord’s stock price of $183.25 implies a valuation ratio of 17.4x forward P/E. This multiple is lower than most industrials companies, but for good reason.
We’d rather pay up for companies with elite fundamentals than get a bargain on weak ones. Cheap stocks can be value traps, and as their performance deteriorates, they will stay cheap or get even cheaper.
3. Regal Rexnord (RRX) Research Report: Q4 CY2025 Update
Industrials products and automation company Regal Rexnord (NYSE:RRX). fell short of the market’s revenue expectations in Q4 CY2025 as sales rose 4.3% year on year to $1.52 billion. Its non-GAAP profit of $2.51 per share was 1.1% above analysts’ consensus estimates.
Regal Rexnord (RRX) Q4 CY2025 Highlights:
- Revenue: $1.52 billion vs analyst estimates of $1.54 billion (4.3% year-on-year growth, 1.2% miss)
- Adjusted EPS: $2.51 vs analyst estimates of $2.48 (1.1% beat)
- Adjusted EBITDA: $328.5 million vs analyst estimates of $332.4 million (21.6% margin, 1.2% miss)
- Adjusted EPS guidance for the upcoming financial year 2026 is $10.60 at the midpoint, missing analyst estimates by 1.4%
- Operating Margin: 10.8%, up from 8.8% in the same quarter last year
- Free Cash Flow Margin: 9.2%, down from 12.6% in the same quarter last year
- Organic Revenue rose 2.9% year on year (miss)
- Market Capitalization: $11.36 billion
Company Overview
Headquartered in Milwaukee, Regal Rexnord (NYSE:RRX) provides power transmission and industrial automation products.
Regal Rexnord's history is marked by strategic growth and technological innovation in the industrial sector. Originally formed through the merger and acquisitions of several key companies in the power transmission and electronic components industries, it has expanded its expertise into a diverse range of products and services. Notably, the merger of Regal Beloit and Rexnord’s process & motion control platform in 2021 significantly enhanced its market position, combining Regal Beloit's expertise in electric motors and motion control products with Rexnord’s strengths in drivetrain and conveying solutions.
Today, Regal Rexnord Corporation offerings encompass a range of products such as bearings, couplings, gears, belts, chains, drives, pumps, and valve controls. These products are crucial for transmitting power and motion in industrial machinery, enhancing the efficiency and productivity of operations in sectors like food and beverage, mining, energy, and agriculture.
Regal Rexnord also integrates traditional hardware with advanced automation systems, including technical linear motion systems and control systems, to boost the economic and operational efficiency of industrial processes. Its products are designed not only to meet current industrial demands but also to advance energy efficiency, supporting both customer and environmental goals.
The company generates revenue through the sale and installation of these systems, alongside ongoing maintenance and support services, which provide a channel of recurring revenue. Products are sold directly or through a distribution network, across various industries, including HVAC, commercial refrigeration, marine, and data centers.
4. Engineered Components and Systems
Engineered components and systems companies possess technical know-how in sometimes narrow areas such as metal forming or intelligent robotics. Lately, automation and connected equipment collecting analyzable data have been trending, creating new demand. On the other hand, like the broader industrials sector, engineered components and systems companies are at the whim of economic cycles. Consumer spending and interest rates, for example, can greatly impact the industrial production that drives demand for these companies’ offerings.
Competitors of Regal Rexnord include Siemens (ETR:SIE), ABB (NYSE:ABB), and Schneider Electric (EPA:SU).
5. Revenue Growth
Examining a company’s long-term performance can provide clues about its quality. Any business can experience short-term success, but top-performing ones enjoy sustained growth for years. Thankfully, Regal Rexnord’s 15.3% annualized revenue growth over the last five years was incredible. Its growth beat the average industrials company and shows its offerings resonate with customers.
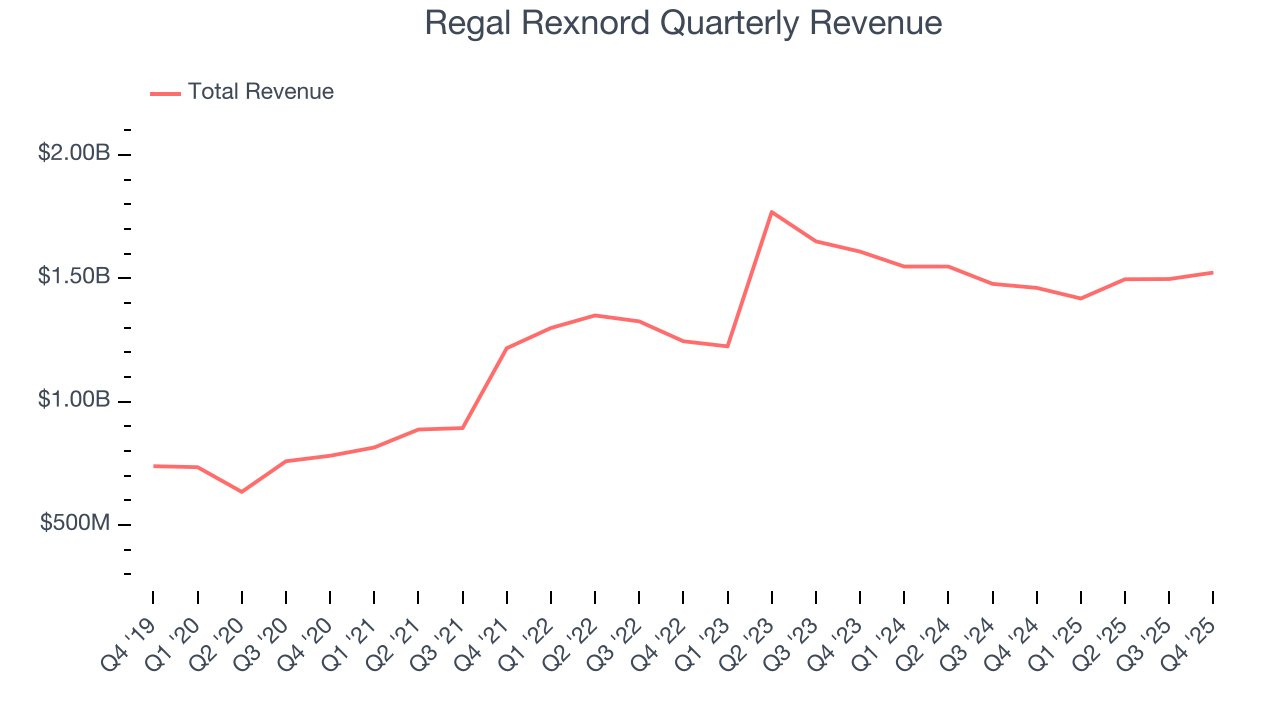
We at StockStory place the most emphasis on long-term growth, but within industrials, a half-decade historical view may miss cycles, industry trends, or a company capitalizing on catalysts such as a new contract win or a successful product line. Regal Rexnord’s recent performance marks a sharp pivot from its five-year trend as its revenue has shown annualized declines of 2.6% over the last two years. 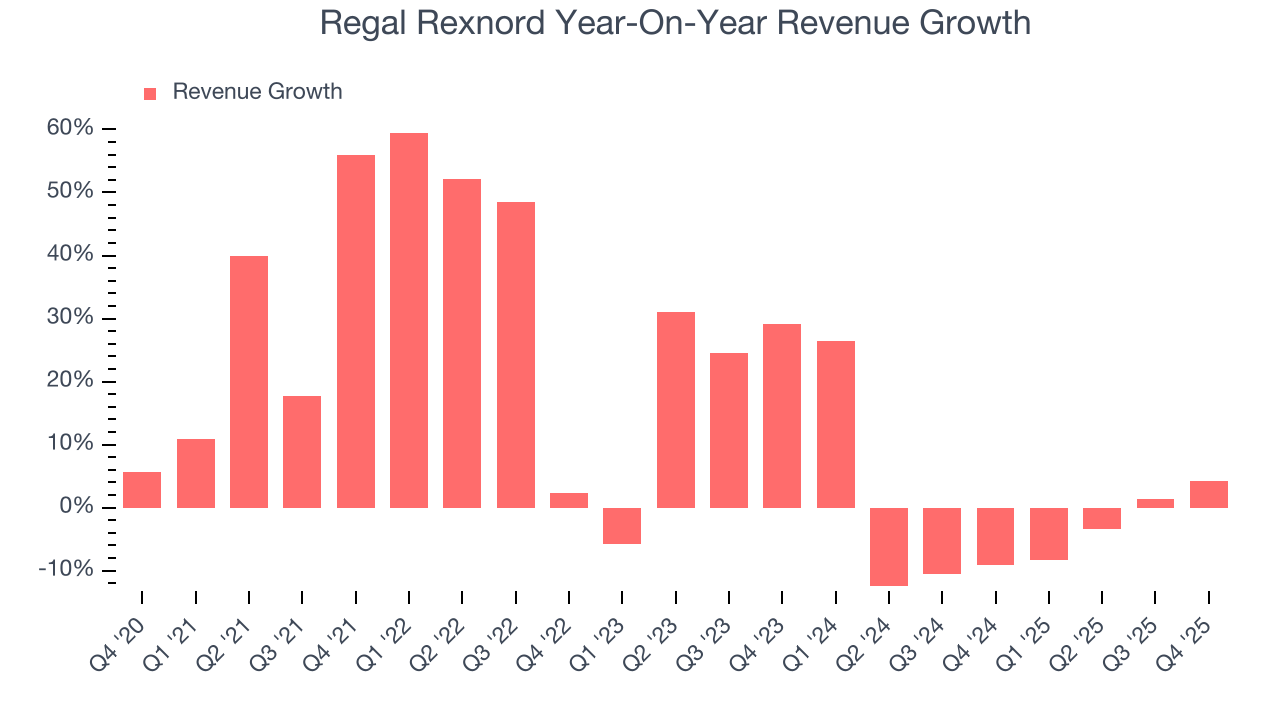
We can better understand the company’s sales dynamics by analyzing its organic revenue, which strips out one-time events like acquisitions and currency fluctuations that don’t accurately reflect its fundamentals. Over the last two years, Regal Rexnord’s organic revenue averaged 2.2% year-on-year declines. Because this number aligns with its two-year revenue growth, we can see the company’s core operations (not acquisitions and divestitures) drove most of its results. 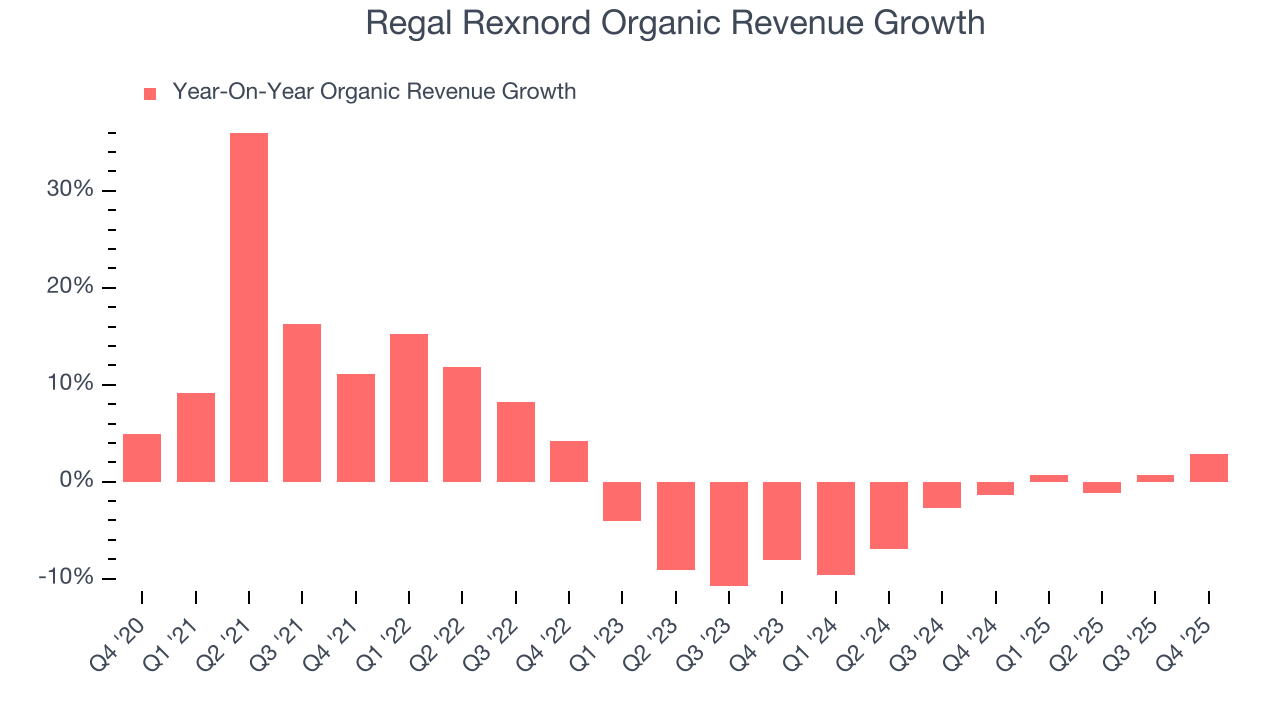
This quarter, Regal Rexnord’s revenue grew by 4.3% year on year to $1.52 billion, falling short of Wall Street’s estimates.
Looking ahead, sell-side analysts expect revenue to grow 3.8% over the next 12 months. While this projection implies its newer products and services will spur better top-line performance, it is still below the sector average.
6. Gross Margin & Pricing Power
Regal Rexnord’s gross margin is good compared to other industrials businesses and signals it sells differentiated products, not commodities. As you can see below, it averaged an impressive 34.5% gross margin over the last five years. Said differently, Regal Rexnord paid its suppliers $65.53 for every $100 in revenue. 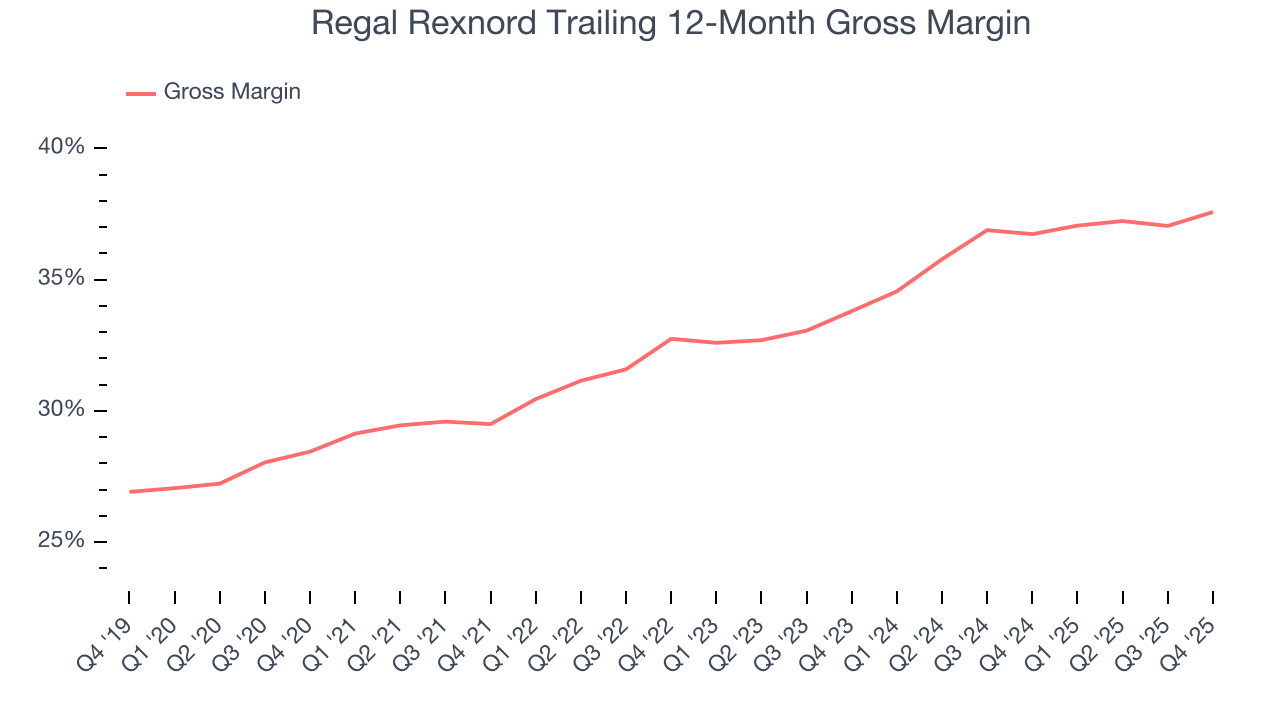
This quarter, Regal Rexnord’s gross profit margin was 37.5%, up 2.1 percentage points year on year. On a wider time horizon, the company’s full-year margin has remained steady over the past four quarters, suggesting its input costs (such as raw materials and manufacturing expenses) have been stable and it isn’t under pressure to lower prices.
7. Operating Margin
Operating margin is a key measure of profitability. Think of it as net income - the bottom line - excluding the impact of taxes and interest on debt, which are less connected to business fundamentals.
Regal Rexnord has managed its cost base well over the last five years. It demonstrated solid profitability for an industrials business, producing an average operating margin of 10%. This result isn’t too surprising as its gross margin gives it a favorable starting point.
Analyzing the trend in its profitability, Regal Rexnord’s operating margin rose by 2.1 percentage points over the last five years, as its sales growth gave it operating leverage.
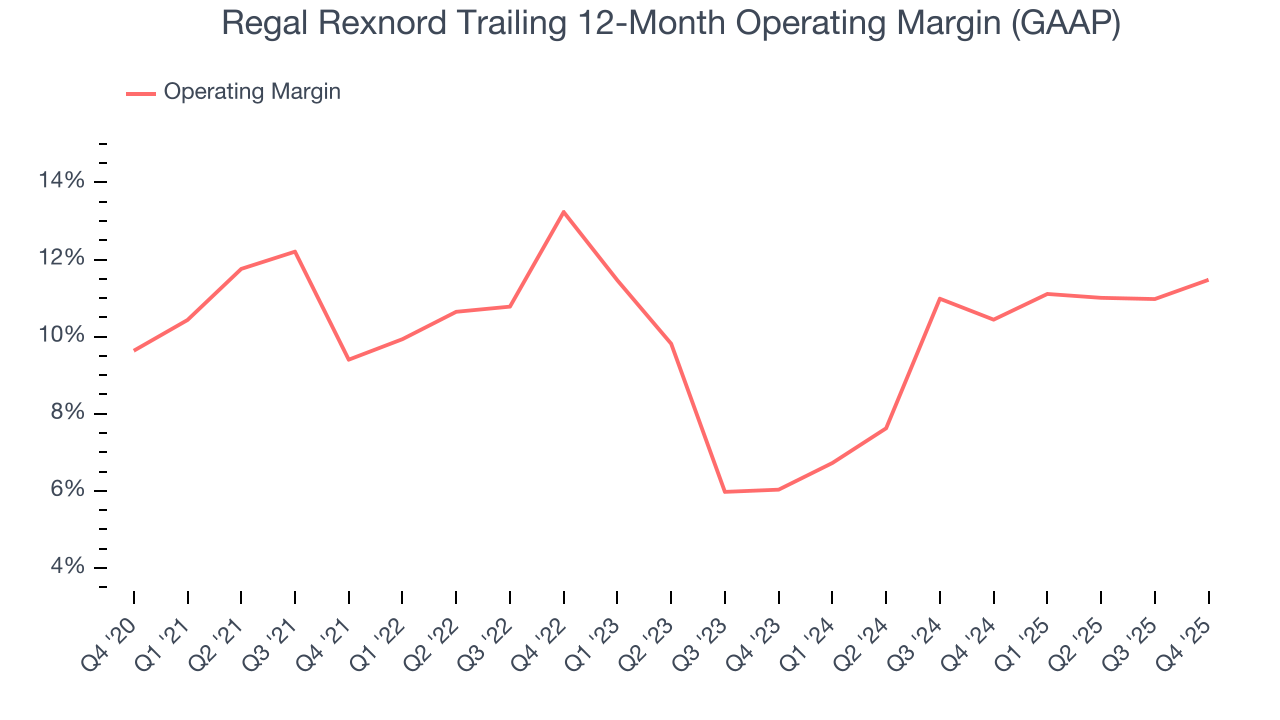
In Q4, Regal Rexnord generated an operating margin profit margin of 10.8%, up 2 percentage points year on year. Since its gross margin expanded more than its operating margin, we can infer that leverage on its cost of sales was the primary driver behind the recently higher efficiency.
8. Earnings Per Share
Revenue trends explain a company’s historical growth, but the long-term change in earnings per share (EPS) points to the profitability of that growth – for example, a company could inflate its sales through excessive spending on advertising and promotions.
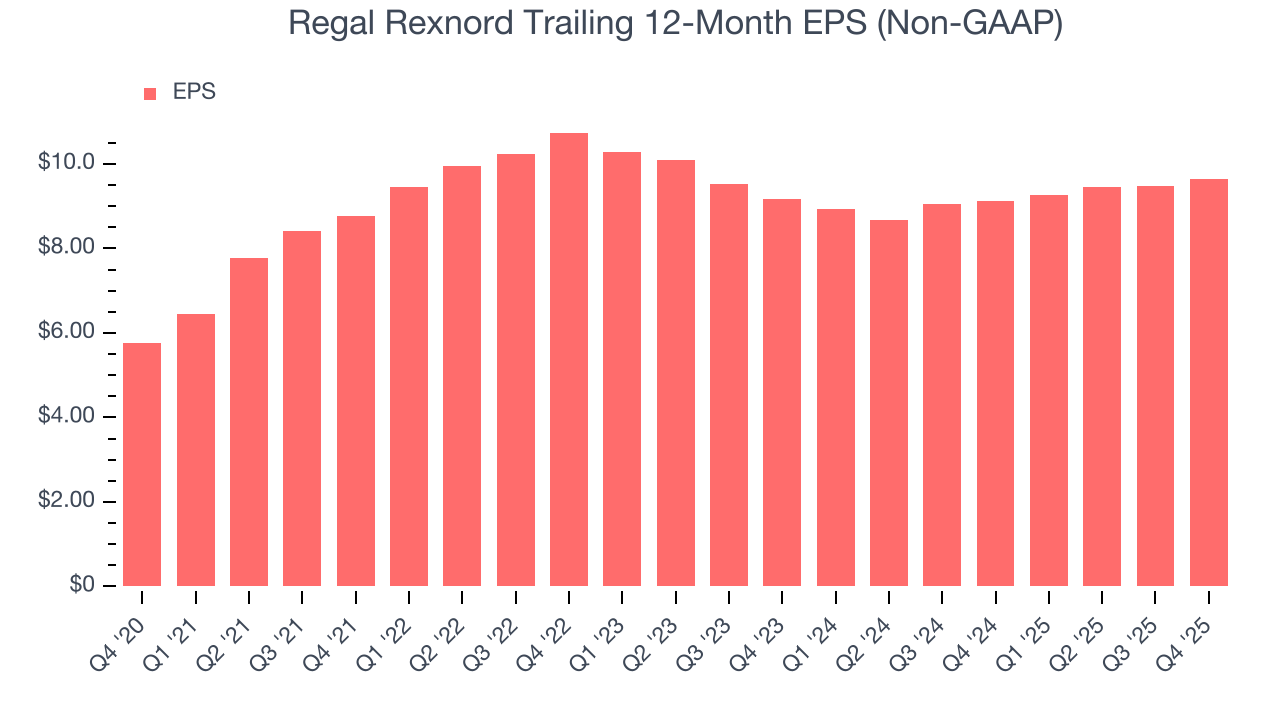
Regal Rexnord’s EPS grew at a solid 10.8% compounded annual growth rate over the last five years. Despite its operating margin improvement during that time, this performance was lower than its 15.3% annualized revenue growth, telling us that non-fundamental factors such as interest and taxes affected its ultimate earnings.
We can take a deeper look into Regal Rexnord’s earnings to better understand the drivers of its performance. A five-year view shows Regal Rexnord has diluted its shareholders, growing its share count by 62.8%. This dilution overshadowed its increased operational efficiency and has led to lower per share earnings. Taxes and interest expenses can also affect EPS but don’t tell us as much about a company’s fundamentals. 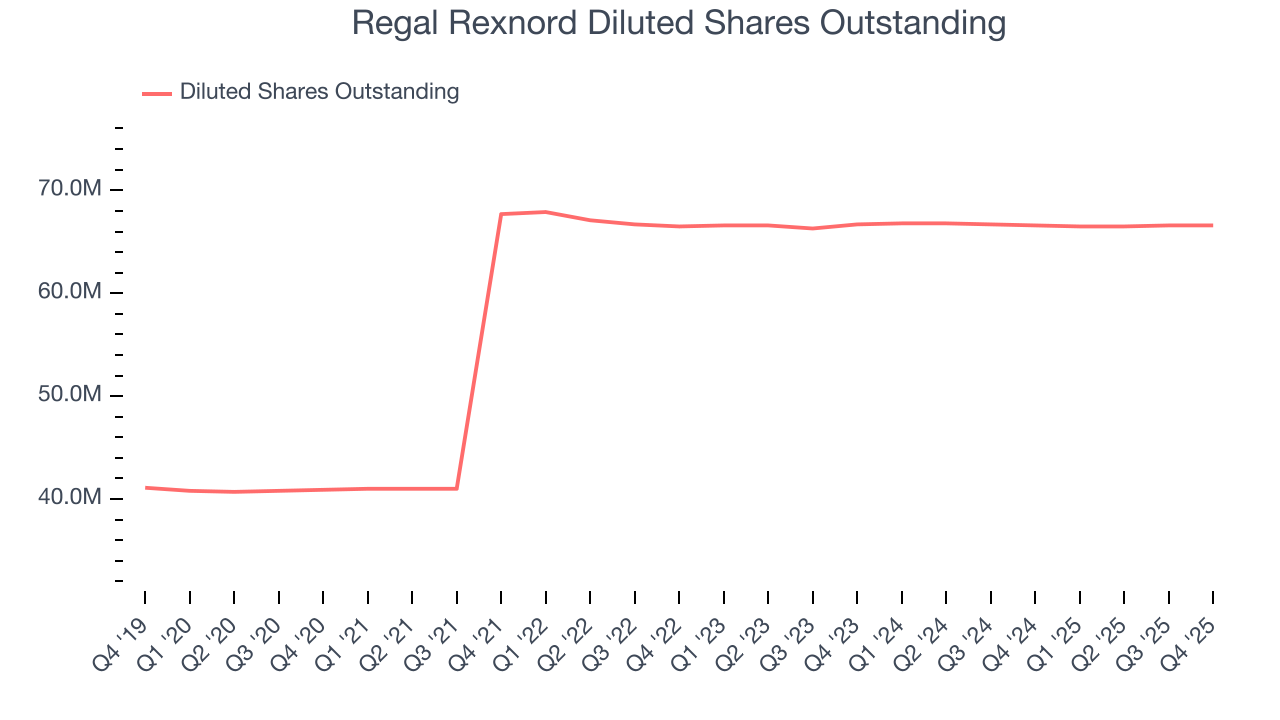
Like with revenue, we analyze EPS over a shorter period to see if we are missing a change in the business.
For Regal Rexnord, its two-year annual EPS growth of 2.6% was lower than its five-year trend. We hope its growth can accelerate in the future.
In Q4, Regal Rexnord reported adjusted EPS of $2.51, up from $2.34 in the same quarter last year. This print beat analysts’ estimates by 1.1%. Over the next 12 months, Wall Street expects Regal Rexnord’s full-year EPS of $9.65 to grow 11.8%.
9. Cash Is King
Although earnings are undoubtedly valuable for assessing company performance, we believe cash is king because you can’t use accounting profits to pay the bills.
Regal Rexnord has shown impressive cash profitability, enabling it to ride out cyclical downturns more easily while maintaining its investments in new and existing offerings. The company’s free cash flow margin averaged 8.4% over the last five years, better than the broader industrials sector.
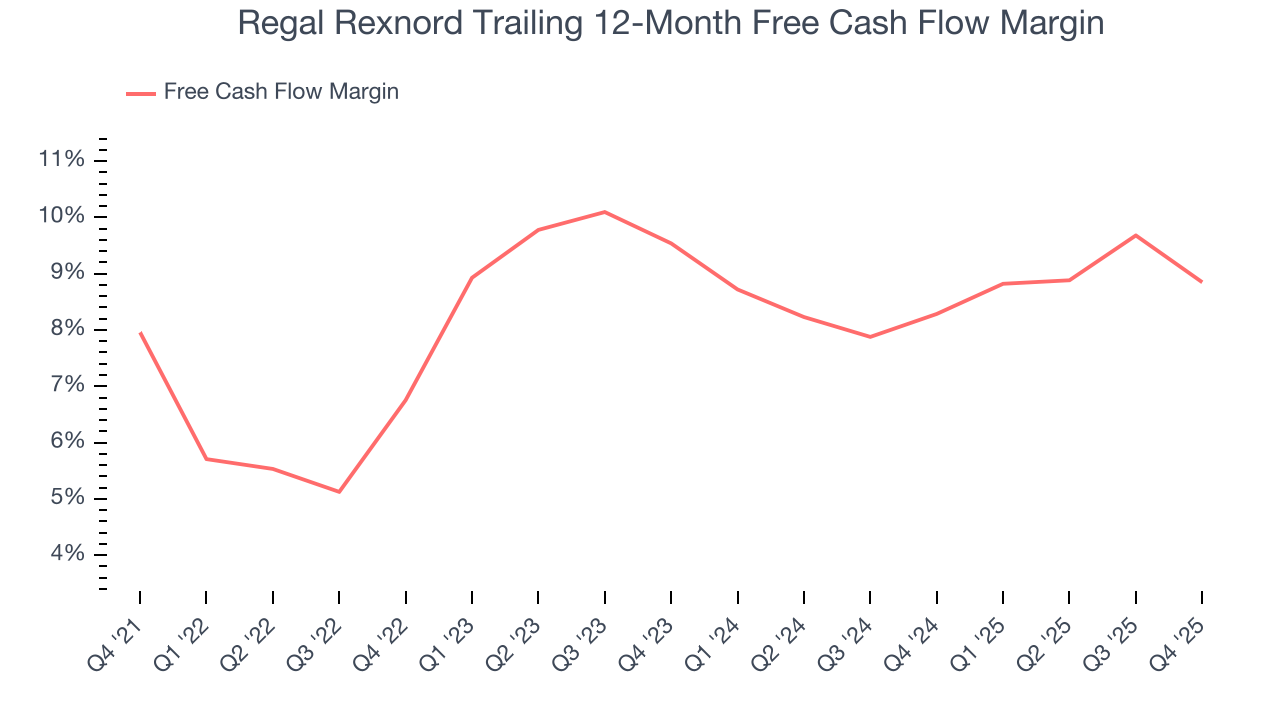
Regal Rexnord’s free cash flow clocked in at $140.6 million in Q4, equivalent to a 9.2% margin. The company’s cash profitability regressed as it was 3.4 percentage points lower than in the same quarter last year, prompting us to pay closer attention. Short-term fluctuations typically aren’t a big deal because investment needs can be seasonal, but we’ll be watching to see if the trend extrapolates into future quarters.
10. Return on Invested Capital (ROIC)
EPS and free cash flow tell us whether a company was profitable while growing its revenue. But was it capital-efficient? A company’s ROIC explains this by showing how much operating profit it makes compared to the money it has raised (debt and equity).
Regal Rexnord historically did a mediocre job investing in profitable growth initiatives. Its five-year average ROIC was 4.4%, lower than the typical cost of capital (how much it costs to raise money) for industrials companies.
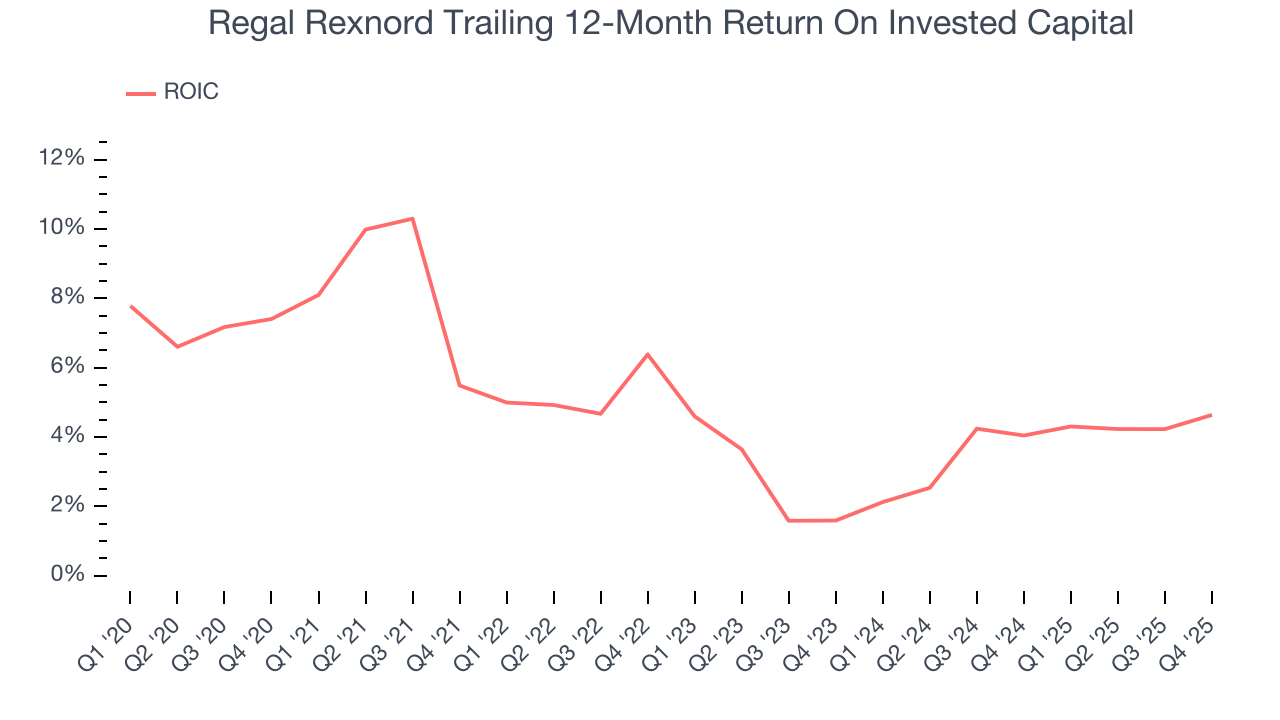
We like to invest in businesses with high returns, but the trend in a company’s ROIC is what often surprises the market and moves the stock price. Unfortunately, Regal Rexnord’s ROIC averaged 1.6 percentage point decreases each year over the last few years. Paired with its already low returns, these declines suggest its profitable growth opportunities are few and far between.
11. Balance Sheet Assessment
Regal Rexnord reported $521.7 million of cash and $4.94 billion of debt on its balance sheet in the most recent quarter. As investors in high-quality companies, we primarily focus on two things: 1) that a company’s debt level isn’t too high and 2) that its interest payments are not excessively burdening the business.
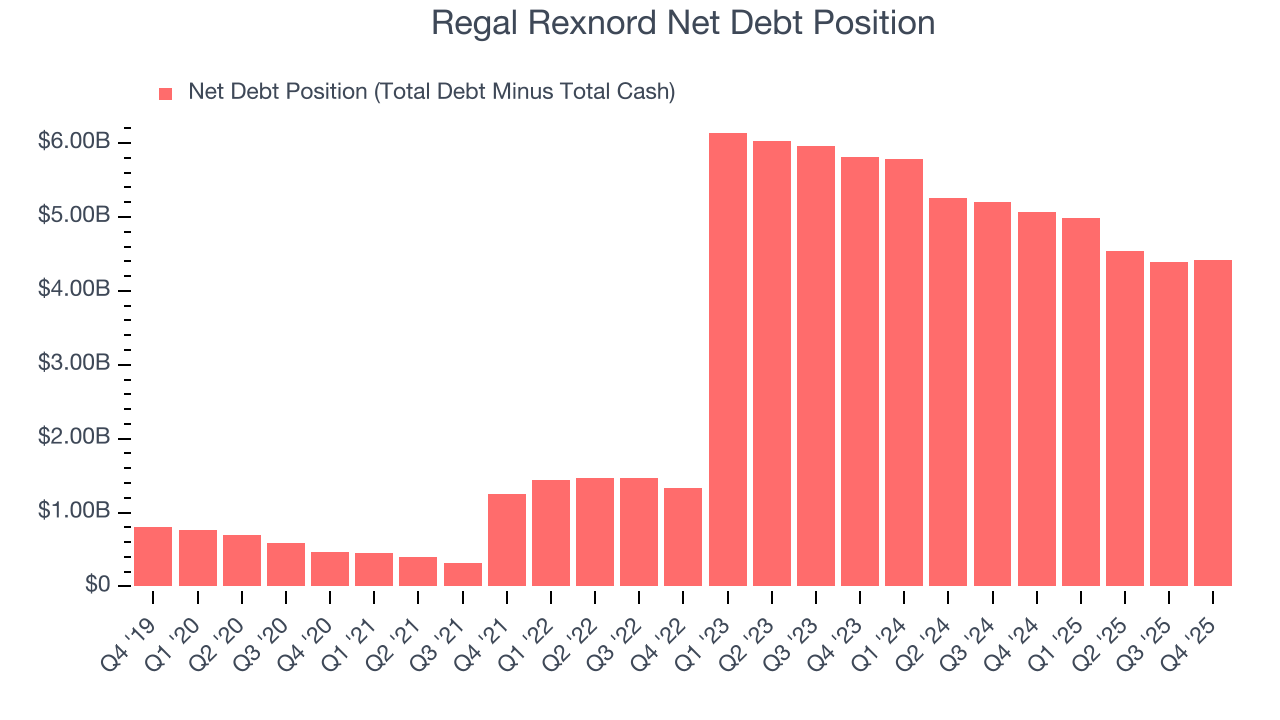
With $1.31 billion of EBITDA over the last 12 months, we view Regal Rexnord’s 3.4× net-debt-to-EBITDA ratio as safe. We also see its $170.3 million of annual interest expenses as appropriate. The company’s profits give it plenty of breathing room, allowing it to continue investing in growth initiatives.
12. Key Takeaways from Regal Rexnord’s Q4 Results
We struggled to find many positives in these results. Its revenue slightly missed and its full-year EPS guidance fell slightly short of Wall Street’s estimates. Overall, this was a weaker quarter. The stock traded up 2.3% to $182.50 immediately following the results.
13. Is Now The Time To Buy Regal Rexnord?
Updated: March 22, 2026 at 10:05 PM EDT
Before investing in or passing on Regal Rexnord, we urge you to understand the company’s business quality (or lack thereof), valuation, and the latest quarterly results - in that order.
Regal Rexnord isn’t a terrible business, but it doesn’t pass our quality test. Although its revenue growth was exceptional over the last five years, it’s expected to deteriorate over the next 12 months and its relatively low ROIC suggests management has struggled to find compelling investment opportunities. And while the company’s solid EPS growth over the last five years shows its profits are trickling down to shareholders, the downside is its flat organic revenue disappointed.
Regal Rexnord’s P/E ratio based on the next 12 months is 17.4x. This valuation multiple is fair, but we don’t have much faith in the company. We're pretty confident there are superior stocks to buy right now.
Wall Street analysts have a consensus one-year price target of $236.50 on the company (compared to the current share price of $183.25).
Although the price target is bullish, readers should exercise caution because analysts tend to be overly optimistic. The firms they work for, often big banks, have relationships with companies that extend into fundraising, M&A advisory, and other rewarding business lines. As a result, they typically hesitate to say bad things for fear they will lose out. We at StockStory do not suffer from such conflicts of interest, so we’ll always tell it like it is.