
RXO (RXO)
We’re skeptical of RXO. It not only barely produces cash but also has been less efficient lately, as seen by its falling margins.― StockStory Analyst Team
1. News
2. Summary
Why We Think RXO Will Underperform
With access to millions of trucks, RXO (NYSE:RXO) offers full-truckload, less-than-truckload, and last-mile deliveries.
- Forecasted revenue decline of 2.4% for the upcoming 12 months implies demand will fall off a cliff
- Operating margin fell from an already low starting point over the last five years because it pursued growth instead of profits
- On the plus side, its earnings growth has beaten its peers over the last five years as its EPS has compounded at 38.4% annually


RXO doesn’t meet our quality standards. There are more rewarding stocks elsewhere.
Why There Are Better Opportunities Than RXO


RXO is trading at $15.55 per share, or 31.9x forward EV-to-EBITDA. The current multiple is quite expensive, especially for the fundamentals of the business.
We prefer to invest in similarly-priced but higher-quality companies with superior earnings growth.
3. RXO (RXO) Research Report: Q3 CY2025 Update
Freight Delivery Company RXO (NYSE:RXO) met Wall Streets revenue expectations in Q3 CY2025, with sales up 36.6% year on year to $1.42 billion. Its non-GAAP profit of $0.01 per share was $0.03 below analysts’ consensus estimates.
RXO (RXO) Q3 CY2025 Highlights:
- Revenue: $1.42 billion vs analyst estimates of $1.43 billion (36.6% year-on-year growth, in line)
- Adjusted EPS: $0.01 vs analyst estimates of $0.04 ($0.03 miss)
- Adjusted EBITDA: $32 million vs analyst estimates of $35.31 million (2.3% margin, 9.4% miss)
- EBITDA guidance for Q4 CY2025 is $25 million at the midpoint, below analyst estimates of $43.64 million
- Operating Margin: -0.5%, up from -1.9% in the same quarter last year
- Free Cash Flow was $9 million, up from -$18 million in the same quarter last year
- Sales Volumes rose 1% year on year (-5% in the same quarter last year)
- Market Capitalization: $2.89 billion
Company Overview
With access to millions of trucks, RXO (NYSE:RXO) offers full-truckload, less-than-truckload, and last-mile deliveries.
RXO originated as a spin-off from XPO, a transportation and logistics service company offering similar services, in 2022 to become an independent company offering freight delivery services.
RXO connects shippers with third-party carriers who own and operate vehicles to make full-truckload and less-than-truckload deliveries. Its full-truckload freight deliveries are made by dedicating an entire truck to a single customer’s shipment, adhering to specific needs like temperature control for perishable items. On the other hand, the company consolidates smaller shipments from multiple customers for its less-than-truckload deliveries. RXO coordinates the pickups, manages the logistics, and ensures that each shipment is delivered to its final destination.
The company’s last-mile delivery service focuses on transporting goods from distribution centers or warehouses directly to their final destinations. RXO coordinates the logistics of last mile delivery, managing everything from scheduling and route planning to final delivery confirmation. It does not actually make the deliveries, instead, it connects shippers with third-party carriers.
RXO engages in contracts that range from short-term agreements for specific shipments to long-term partnerships that span multiple years. Its pricing is based on the volume and frequency of shipments, often providing volume discounts to incentivize higher shipping volumes.
4. Ground Transportation
The growth of e-commerce and global trade continues to drive demand for shipping services, especially last-mile delivery, presenting opportunities for ground transportation companies. The industry continues to invest in data, analytics, and autonomous fleets to optimize efficiency and find the most cost-effective routes. Despite the essential services this industry provides, ground transportation companies are still at the whim of economic cycles. Consumer spending, for example, can greatly impact the demand for these companies’ offerings while fuel costs can influence profit margins.
Competitors offering similar products include C.H. Robinson (NASDAQ:CHRW), XPO (NYSE:XPO), and J.B. Hunt (NASDAQ:JBHT).
5. Revenue Growth
A company’s long-term performance is an indicator of its overall quality. Any business can put up a good quarter or two, but the best consistently grow over the long haul. Over the last five years, RXO grew its sales at an exceptional 13.6% compounded annual growth rate. Its growth beat the average industrials company and shows its offerings resonate with customers.
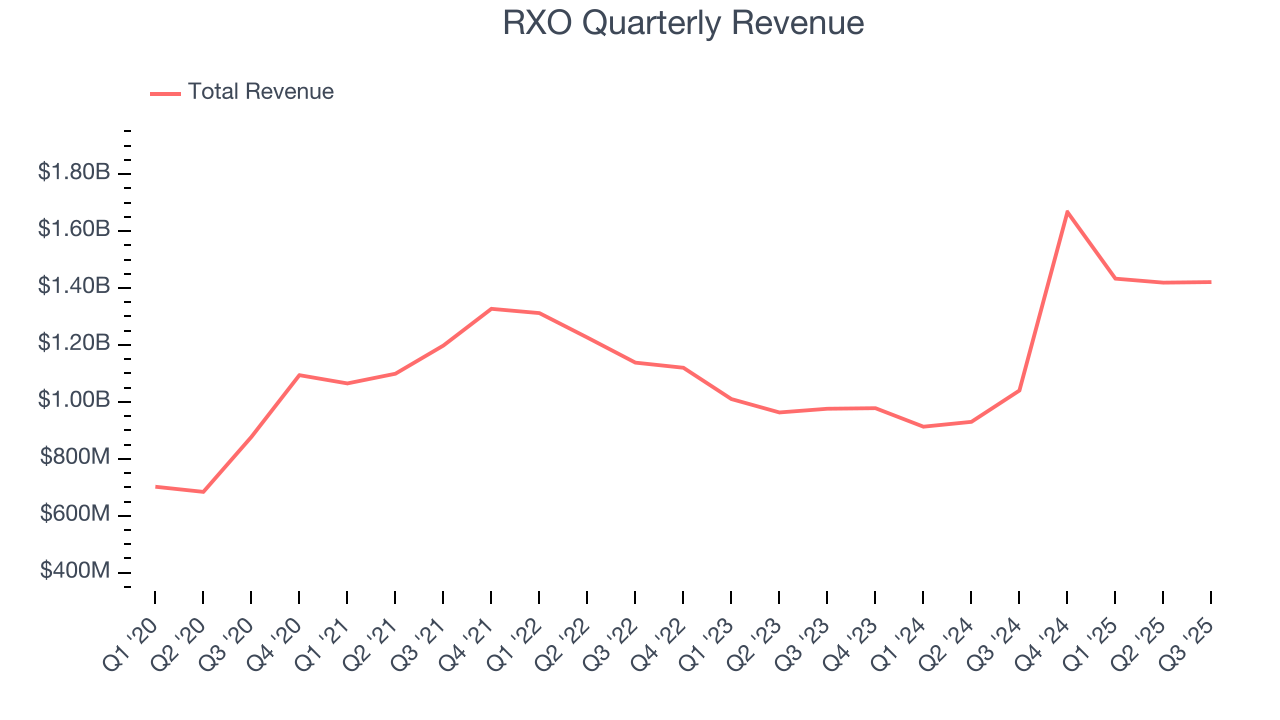
We at StockStory place the most emphasis on long-term growth, but within industrials, a half-decade historical view may miss cycles, industry trends, or a company capitalizing on catalysts such as a new contract win or a successful product line. RXO’s annualized revenue growth of 20.8% over the last two years is above its five-year trend, suggesting its demand was strong and recently accelerated. RXO recent performance stands out, especially when considering many similar Ground Transportation businesses faced declining sales because of cyclical headwinds. 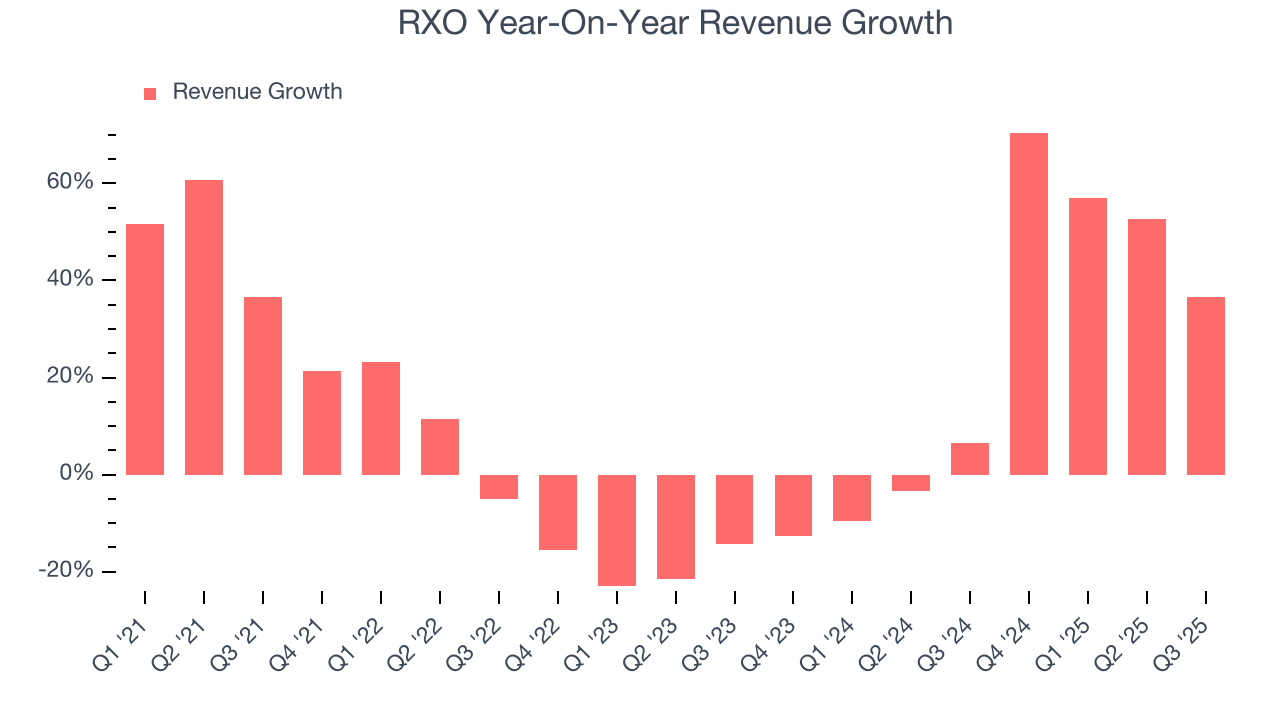
We can dig further into the company’s revenue dynamics by analyzing its number of units sold. Over the last two years, RXO’s units sold averaged 35% year-on-year growth. Because this number is better than its revenue growth, we can see the company’s average selling price decreased. 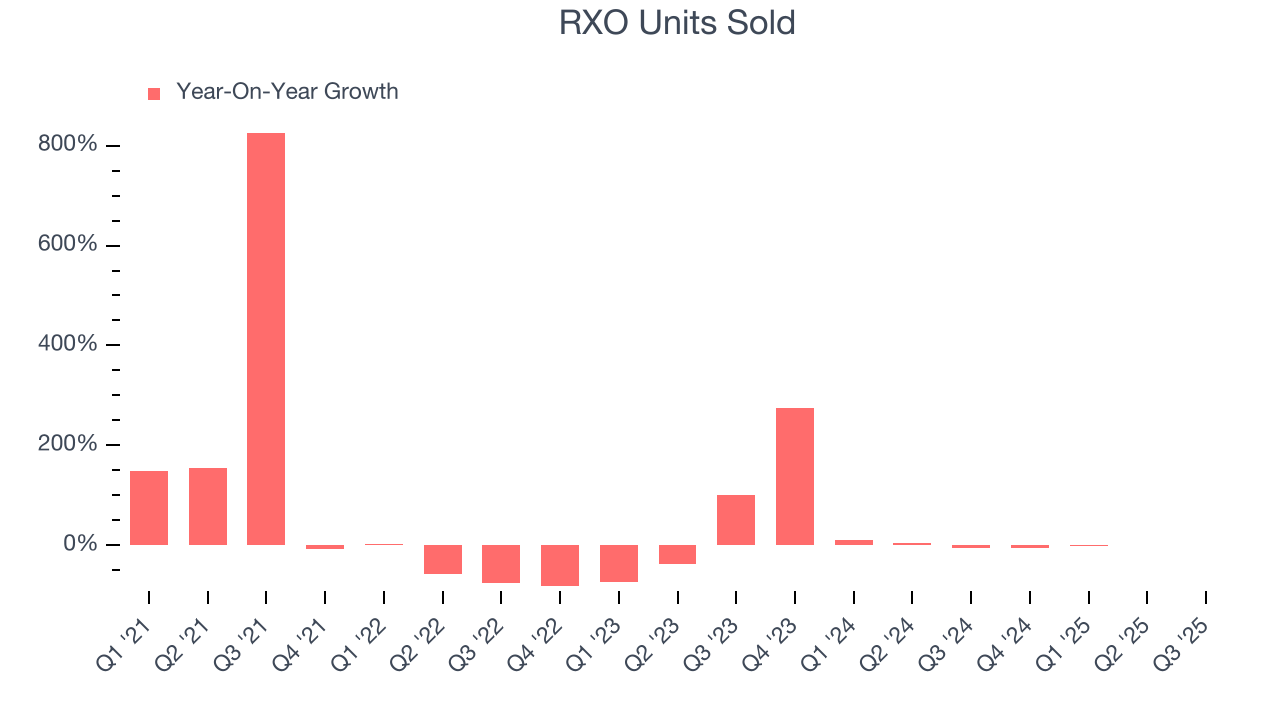
This quarter, RXO’s year-on-year revenue growth of 36.6% was wonderful, and its $1.42 billion of revenue was in line with Wall Street’s estimates.
Looking ahead, sell-side analysts expect revenue to grow 2% over the next 12 months, a deceleration versus the last two years. This projection is underwhelming and suggests its products and services will face some demand challenges.
6. Gross Margin & Pricing Power
RXO has bad unit economics for an industrials business, signaling it operates in a competitive market. As you can see below, it averaged a 18.2% gross margin over the last five years. Said differently, RXO had to pay a chunky $81.79 to its suppliers for every $100 in revenue. 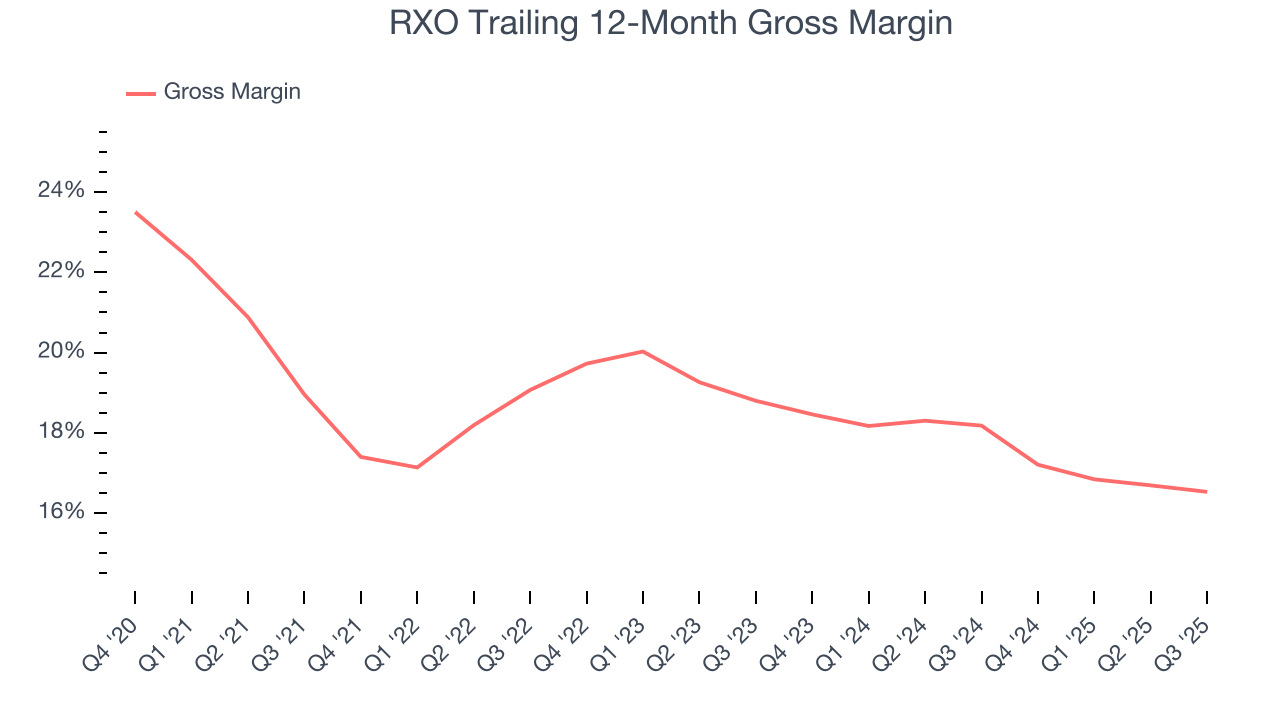
RXO produced a 16.6% gross profit margin in Q3, in line with the same quarter last year. Zooming out, RXO’s full-year margin has been trending down over the past 12 months, decreasing by 1.6 percentage points. If this move continues, it could suggest a more competitive environment with some pressure to lower prices and higher input costs (such as raw materials and manufacturing expenses).
7. Operating Margin
Operating margin is an important measure of profitability as it shows the portion of revenue left after accounting for all core expenses – everything from the cost of goods sold to advertising and wages. It’s also useful for comparing profitability across companies with different levels of debt and tax rates because it excludes interest and taxes.
RXO was profitable over the last five years but held back by its large cost base. Its average operating margin of 1.4% was weak for an industrials business. This result isn’t too surprising given its low gross margin as a starting point.
Looking at the trend in its profitability, RXO’s operating margin decreased by 5 percentage points over the last five years. This raises questions about the company’s expense base because its revenue growth should have given it leverage on its fixed costs, resulting in better economies of scale and profitability. We’ve noticed many Ground Transportation companies also saw their margins fall (along with revenue, as mentioned above) because the cycle turned in the wrong direction, but RXO’s performance was poor no matter how you look at it. It shows that costs were rising and it couldn’t pass them onto its customers.
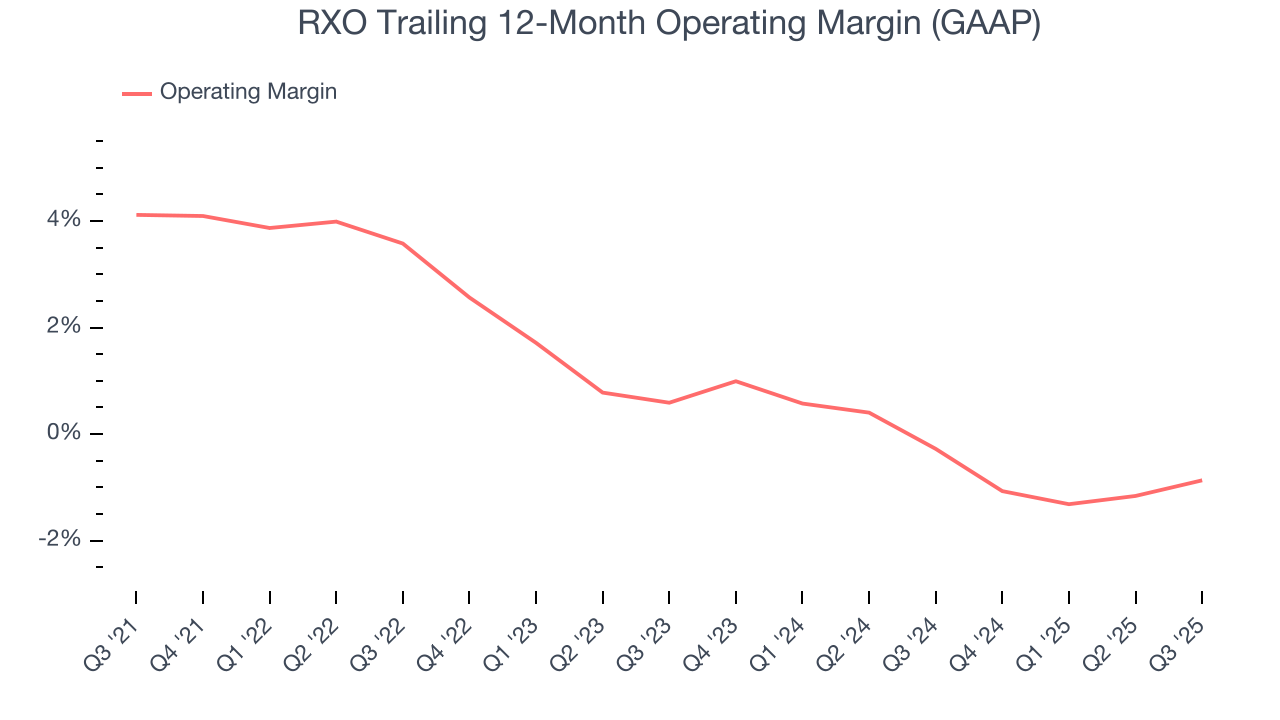
In Q3, RXO’s breakeven margin was up 1.4 percentage points year on year. The increase was encouraging, and because its operating margin rose more than its gross margin, we can infer it was more efficient with expenses such as marketing, R&D, and administrative overhead.
8. Earnings Per Share
Revenue trends explain a company’s historical growth, but the long-term change in earnings per share (EPS) points to the profitability of that growth – for example, a company could inflate its sales through excessive spending on advertising and promotions.
Sadly for RXO, its EPS declined by 22.7% annually over the last five years while its revenue grew by 13.6%. This tells us the company became less profitable on a per-share basis as it expanded.
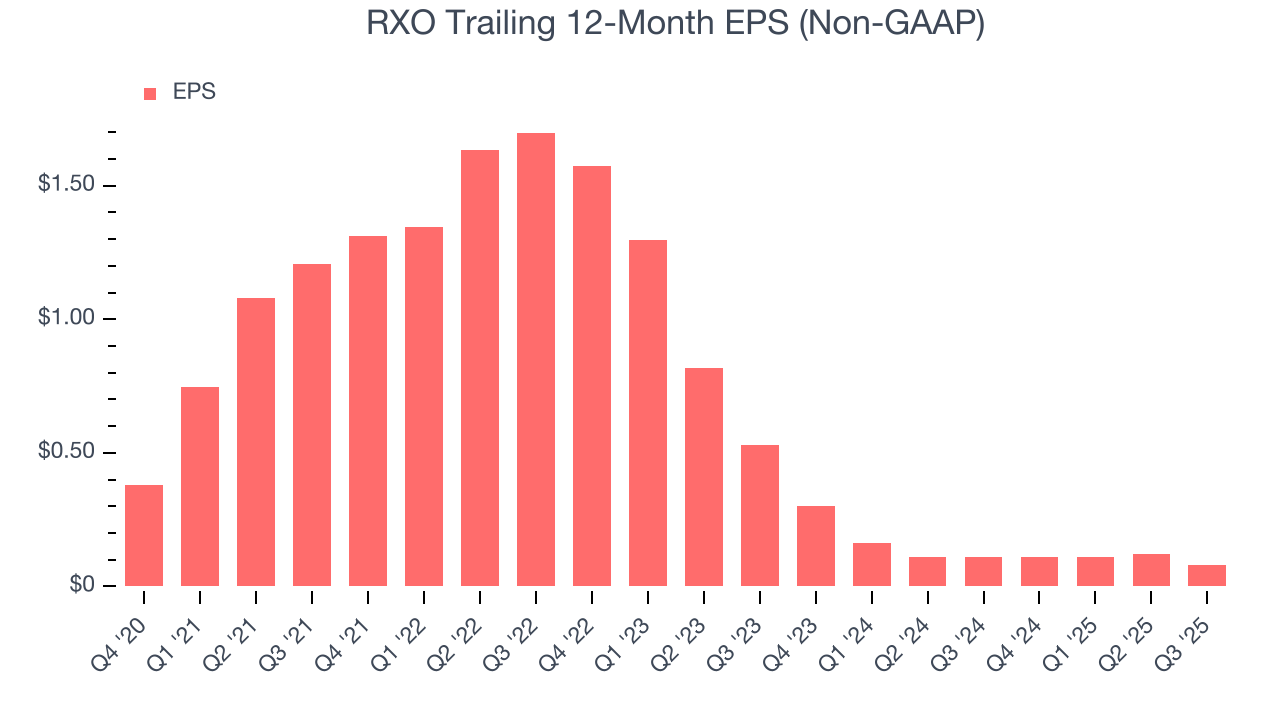
Diving into the nuances of RXO’s earnings can give us a better understanding of its performance. As we mentioned earlier, RXO’s operating margin expanded this quarter but declined by 5 percentage points over the last five years. This was the most relevant factor (aside from the revenue impact) behind its lower earnings; interest expenses and taxes can also affect EPS but don’t tell us as much about a company’s fundamentals.
Like with revenue, we analyze EPS over a shorter period to see if we are missing a change in the business.
For RXO, its two-year annual EPS declines of 61.1% show it’s continued to underperform. These results were bad no matter how you slice the data.
In Q3, RXO reported adjusted EPS of $0.01, down from $0.05 in the same quarter last year. This print missed analysts’ estimates. Over the next 12 months, Wall Street expects RXO’s full-year EPS of $0.08 to grow 250%.
9. Cash Is King
Although earnings are undoubtedly valuable for assessing company performance, we believe cash is king because you can’t use accounting profits to pay the bills.
RXO has shown poor cash profitability over the last five years, giving the company limited opportunities to return capital to shareholders. Its free cash flow margin averaged 1.5%, lousy for an industrials business.
Taking a step back, we can see that RXO’s margin dropped by 2.4 percentage points during that time. Almost any movement in the wrong direction is undesirable because of its already low cash conversion. If the trend continues, it could signal it’s in the middle of an investment cycle.
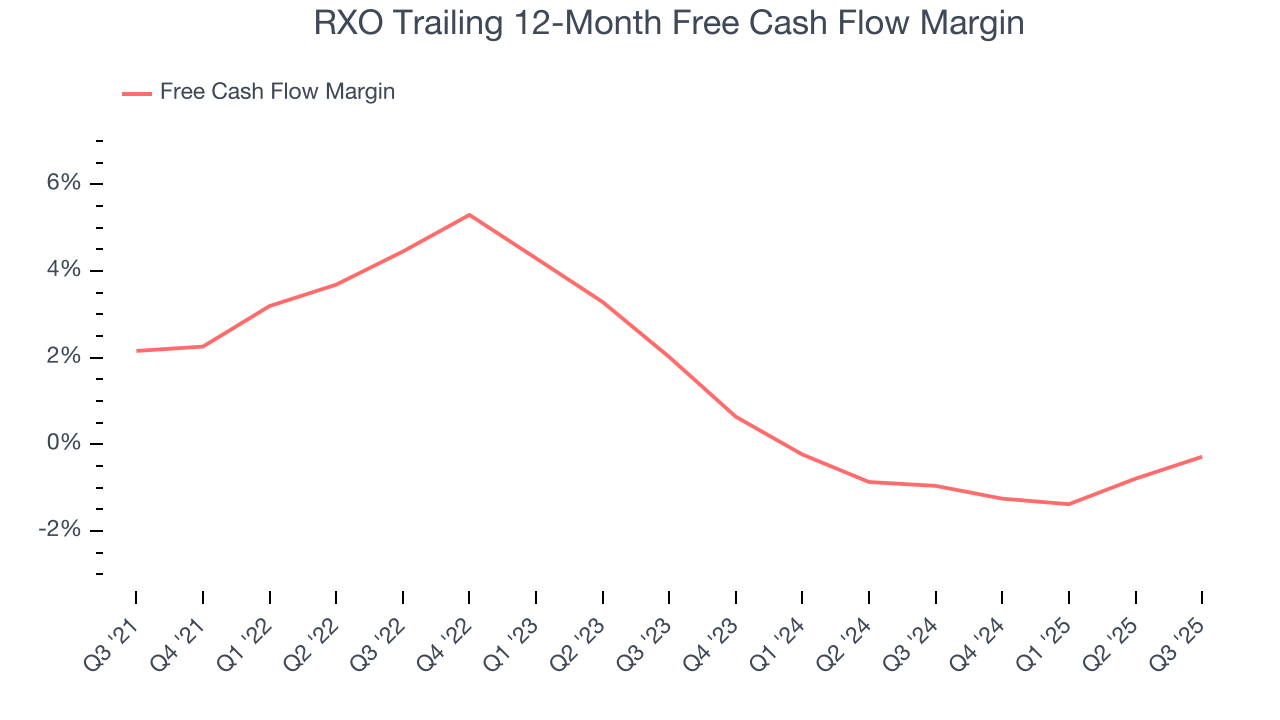
RXO broke even from a free cash flow perspective in Q3. This result was good as its margin was 2.4 percentage points higher than in the same quarter last year, but we wouldn’t read too much into the short term because investment needs can be seasonal, causing temporary swings. Long-term trends are more important.
10. Balance Sheet Assessment
RXO reported $25 million of cash and $682 million of debt on its balance sheet in the most recent quarter. As investors in high-quality companies, we primarily focus on two things: 1) that a company’s debt level isn’t too high and 2) that its interest payments are not excessively burdening the business.
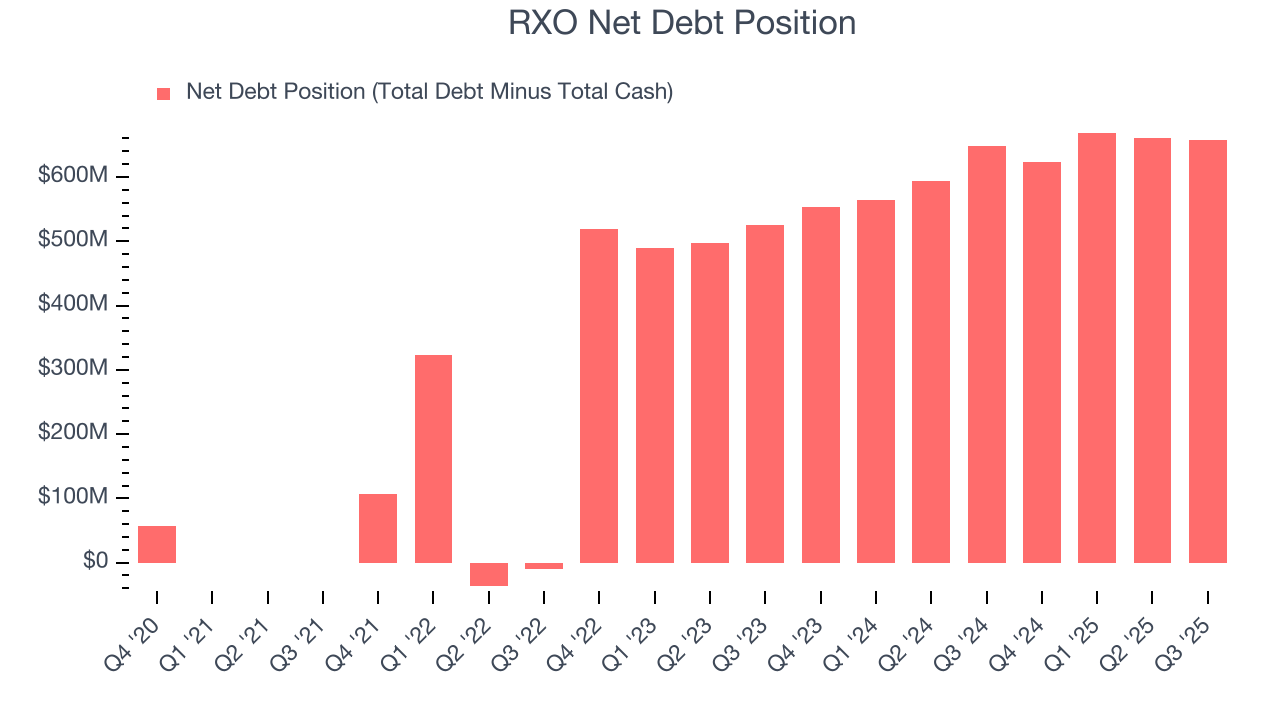
With $134 million of EBITDA over the last 12 months, we view RXO’s 4.9× net-debt-to-EBITDA ratio as safe. We also see its $16 million of annual interest expenses as appropriate. The company’s profits give it plenty of breathing room, allowing it to continue investing in growth initiatives.
11. Key Takeaways from RXO’s Q3 Results
We struggled to find many positives in these results. Its EBITDA missed and its EBITDA guidance came in below Wall Street’s estimates. Overall, this was a softer quarter. The stock traded down 15% to $15 immediately following the results.
12. Is Now The Time To Buy RXO?
Updated: January 21, 2026 at 10:53 PM EST
Before making an investment decision, investors should account for RXO’s business fundamentals and valuation in addition to what happened in the latest quarter.
RXO’s business quality ultimately falls short of our standards. Although its revenue growth was exceptional over the last five years, it’s expected to deteriorate over the next 12 months and its projected EPS for the next year is lacking. And while the company’s growth in unit sales was surging, the downside is its declining operating margin shows the business has become less efficient.
RXO’s EV-to-EBITDA ratio based on the next 12 months is 30x. At this valuation, there’s a lot of good news priced in - we think there are better opportunities elsewhere.
Wall Street analysts have a consensus one-year price target of $15.50 on the company (compared to the current share price of $15.48).