Trex (TREX)
Trex faces an uphill battle. Its weak sales growth and declining returns on capital show its demand and profits are shrinking.― StockStory Analyst Team
1. News


2. Summary
Why We Think Trex Will Underperform
Addressing the demand for aesthetically-pleasing and unique outdoor living spaces, Trex Company (NYSE:TREX) makes wood-alternative decking, railing, and patio furniture.
- Flat earnings per share over the last two years lagged its peers
- Anticipated sales growth of 3.2% for the next year implies demand will be shaky
- Muted 3.6% annual revenue growth over the last two years shows its demand lagged behind its industrials peers


Trex’s quality isn’t great. There are better opportunities in the market.
Why There Are Better Opportunities Than Trex


Trex is trading at $37.49 per share, or 22.7x forward P/E. This multiple is high given its weaker fundamentals.
Paying up for elite businesses with strong earnings potential is better than investing in lower-quality companies with shaky fundamentals. That’s how you avoid big downside over the long term.
3. Trex (TREX) Research Report: Q4 CY2025 Update
Composite decking and railing products manufacturer Trex Company (NYSE:TREX) reported Q4 CY2025 results beating Wall Street’s revenue expectations, but sales fell by 3.9% year on year to $161.1 million. The company’s full-year revenue guidance of $1.21 billion at the midpoint came in 0.6% above analysts’ estimates. Its non-GAAP profit of $0.04 per share was significantly above analysts’ consensus estimates.
Trex (TREX) Q4 CY2025 Highlights:
- Revenue: $161.1 million vs analyst estimates of $144.7 million (3.9% year-on-year decline, 11.3% beat)
- Adjusted EPS: $0.04 vs analyst estimates of -$0.01 (significant beat)
- Adjusted EBITDA: $22.32 million vs analyst estimates of $15.02 million (13.9% margin, 48.6% beat)
- EBITDA guidance for the upcoming financial year 2026 is $327.5 million at the midpoint, above analyst estimates of $314.7 million
- Operating Margin: 2.2%, down from 9.2% in the same quarter last year
- Free Cash Flow was $22.11 million, up from -$89.33 million in the same quarter last year
- Market Capitalization: $4.32 billion
Company Overview
Addressing the demand for aesthetically-pleasing and unique outdoor living spaces, Trex Company (NYSE:TREX) makes wood-alternative decking, railing, and patio furniture.
Founded in 1996 and headquartered in Winchester, Virginia, Trex has established itself as the world's largest manufacturer of composite decking and railing, with a strong commitment to innovation and sustainability. Trex operates primarily through its Trex Residential segment, which forms the core of the company's business. This segment offers outdoor living products, including decking, railing, fencing, cladding, and outdoor lighting solutions.
Trex's flagship decking products include the Trex Signature, Trex Transcend Lineage, Trex Transcend, Trex Select, and Trex Enhance lines. These products offer different levels of performance and pricing to meet the needs of various market segments. In addition to decking, Trex offers railing systems, fencing solutions, and outdoor furniture through licensing agreements. Additionally, the company's business model benefits from the recurring nature of deck maintenance and replacement, as well as the ongoing trend of wood-to-composite conversion in the decking industry.
In the past, Trex acquired SC Company, a manufacturer of railing systems, to expand its product offerings. More recently, the company has concentrated on internal expansion, such as the construction of a new manufacturing facility in Arkansas, which is designed to increase production capacity and support future growth.
4. Home Construction Materials
Traditionally, home construction materials companies have built economic moats with expertise in specialized areas, brand recognition, and strong relationships with contractors. More recently, advances to address labor availability and job site productivity have spurred innovation that is driving incremental demand. However, these companies are at the whim of residential construction volumes, which tend to be cyclical and can be impacted heavily by economic factors such as interest rates. Additionally, the costs of raw materials can be driven by a myriad of worldwide factors and greatly influence the profitability of home construction materials companies.
Other companies offering outdoor building materials and products include Fortune Brands Innovations (NYSE:FBIN), Masco (NYSE:MAS), and Azek Building Products (NYSE:AZEK)
5. Revenue Growth
A company’s long-term sales performance is one signal of its overall quality. Even a bad business can shine for one or two quarters, but a top-tier one grows for years. Unfortunately, Trex’s 5.9% annualized revenue growth over the last five years was tepid. This was below our standard for the industrials sector and is a rough starting point for our analysis.
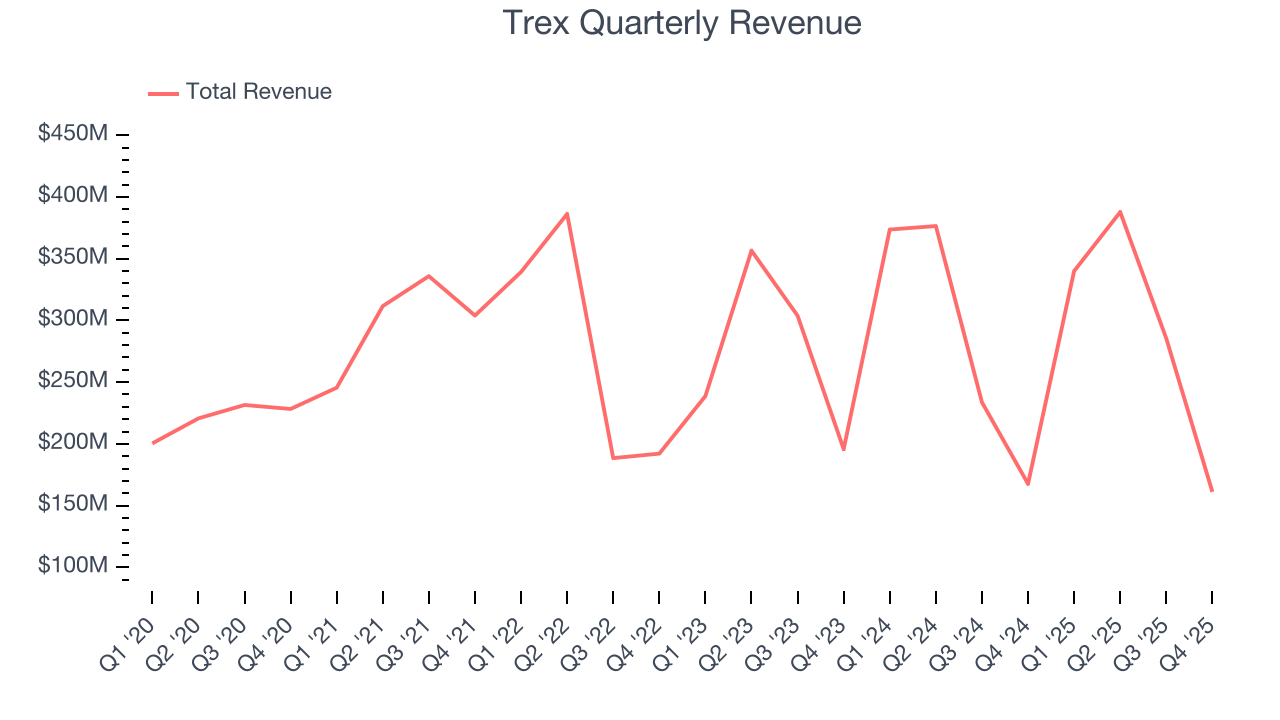
We at StockStory place the most emphasis on long-term growth, but within industrials, a half-decade historical view may miss cycles, industry trends, or a company capitalizing on catalysts such as a new contract win or a successful product line. Trex’s recent performance shows its demand has slowed as its annualized revenue growth of 3.6% over the last two years was below its five-year trend. We’re wary when companies in the sector see decelerations in revenue growth, as it could signal changing consumer tastes aided by low switching costs. 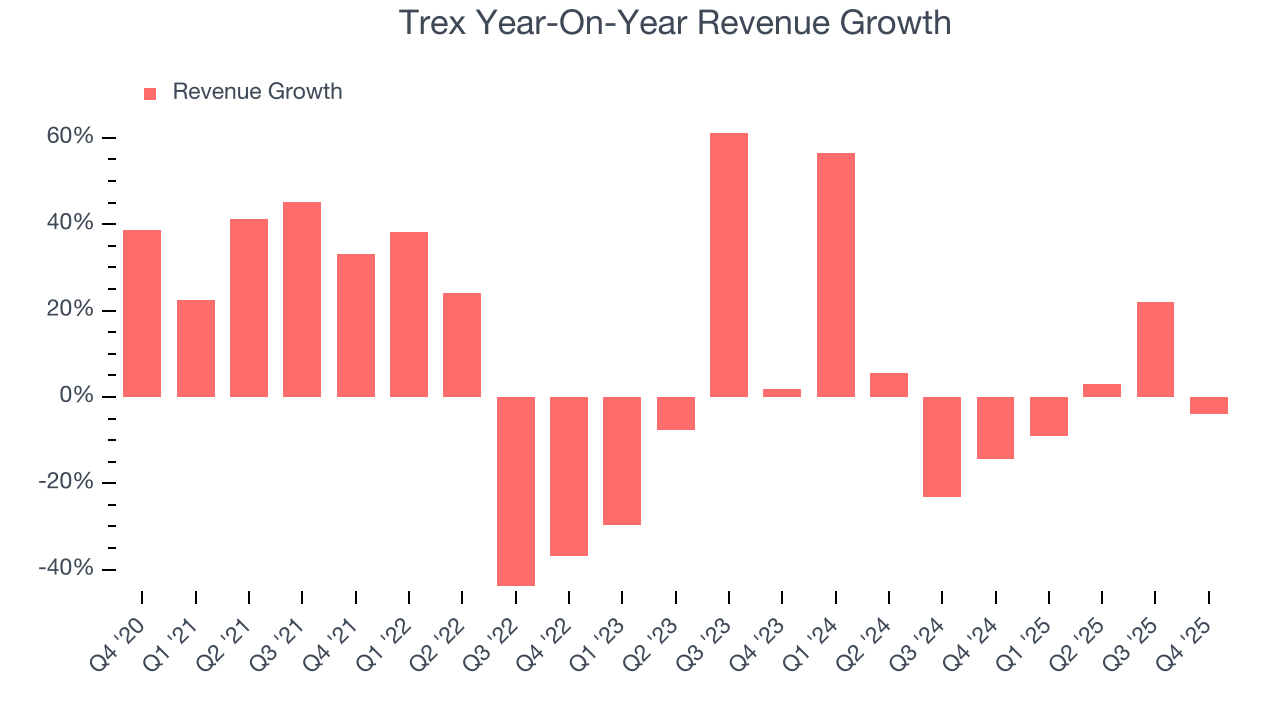
This quarter, Trex’s revenue fell by 3.9% year on year to $161.1 million but beat Wall Street’s estimates by 11.3%.
Looking ahead, sell-side analysts expect revenue to grow 2.3% over the next 12 months, similar to its two-year rate. This projection doesn't excite us and suggests its products and services will face some demand challenges.
6. Gross Margin & Pricing Power
Gross profit margin is a critical metric to track because it sheds light on its pricing power, complexity of products, and ability to procure raw materials, equipment, and labor.
Trex’s unit economics are great compared to the broader industrials sector and signal that it enjoys product differentiation through quality or brand. As you can see below, it averaged an excellent 39.5% gross margin over the last five years. Said differently, roughly $39.53 was left to spend on selling, marketing, R&D, and general administrative overhead for every $100 in revenue. 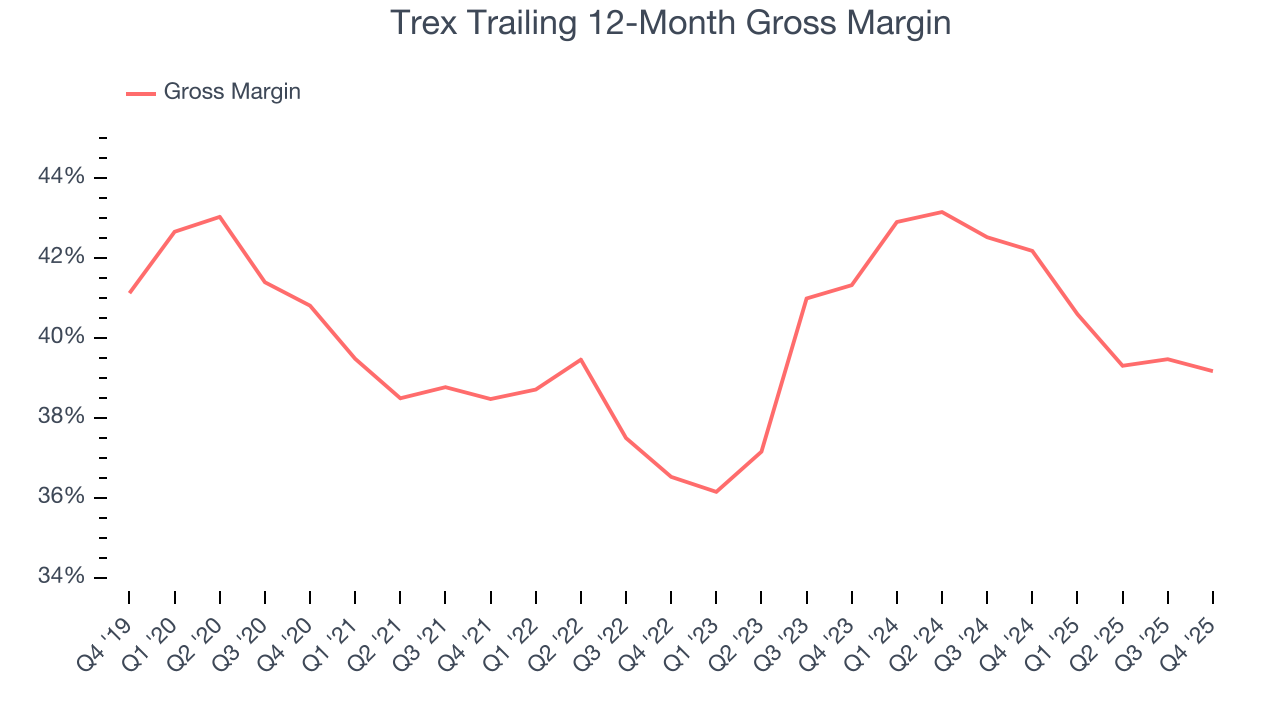
Trex produced a 30.2% gross profit margin in Q4 , marking a 2.5 percentage point decrease from 32.7% in the same quarter last year. Trex’s full-year margin has also been trending down over the past 12 months, decreasing by 3 percentage points. If this move continues, it could suggest a more competitive environment with some pressure to lower prices and higher input costs (such as raw materials and manufacturing expenses).
7. Operating Margin
Operating margin is one of the best measures of profitability because it tells us how much money a company takes home after procuring and manufacturing its products, marketing and selling those products, and most importantly, keeping them relevant through research and development.
Trex has been a well-oiled machine over the last five years. It demonstrated elite profitability for an industrials business, boasting an average operating margin of 24.7%. This result isn’t surprising as its high gross margin gives it a favorable starting point.
Looking at the trend in its profitability, Trex’s operating margin decreased by 5.3 percentage points over the last five years. This raises questions about the company’s expense base because its revenue growth should have given it leverage on its fixed costs, resulting in better economies of scale and profitability.
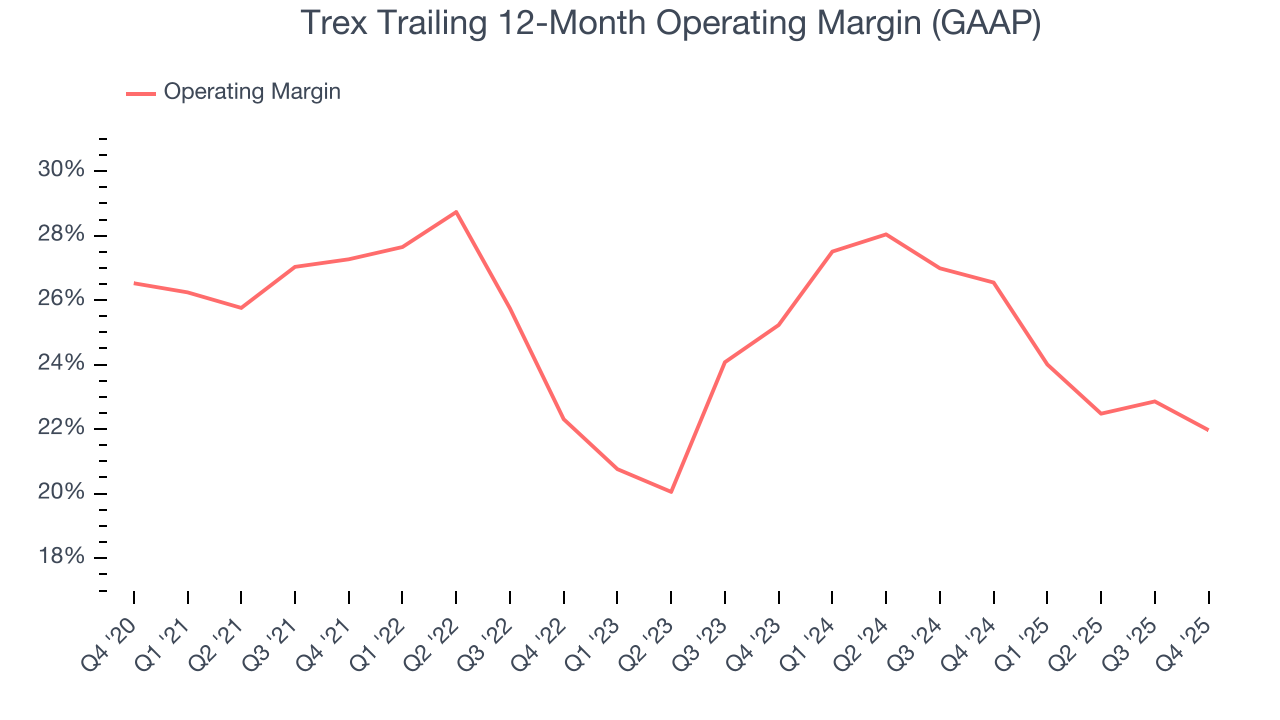
In Q4, Trex generated an operating margin profit margin of 2.2%, down 7 percentage points year on year. Since Trex’s operating margin decreased more than its gross margin, we can assume it was less efficient because expenses such as marketing, R&D, and administrative overhead increased.
8. Earnings Per Share
Revenue trends explain a company’s historical growth, but the long-term change in earnings per share (EPS) points to the profitability of that growth – for example, a company could inflate its sales through excessive spending on advertising and promotions.
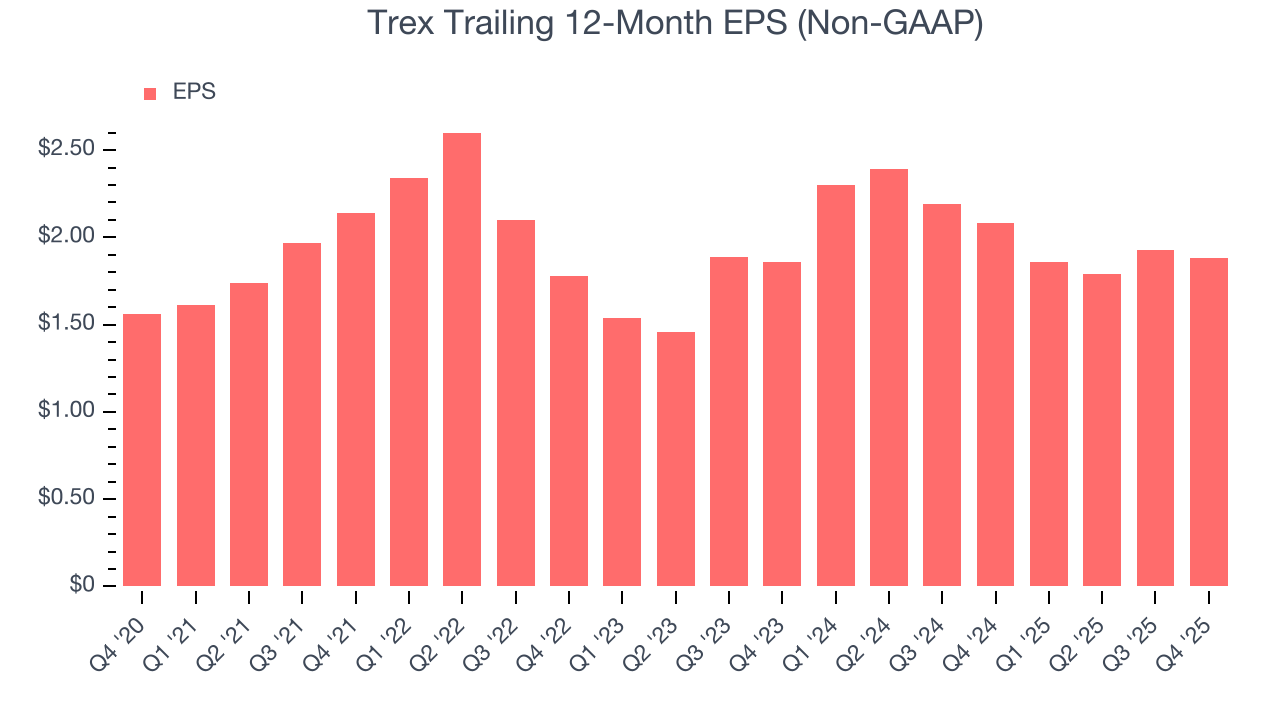
Trex’s EPS grew at a weak 3.8% compounded annual growth rate over the last five years, lower than its 5.9% annualized revenue growth. This tells us the company became less profitable on a per-share basis as it expanded due to non-fundamental factors such as interest expenses and taxes.
Diving into the nuances of Trex’s earnings can give us a better understanding of its performance. As we mentioned earlier, Trex’s operating margin declined by 5.3 percentage points over the last five years. This was the most relevant factor (aside from the revenue impact) behind its lower earnings; interest expenses and taxes can also affect EPS but don’t tell us as much about a company’s fundamentals.
Like with revenue, we analyze EPS over a more recent period because it can provide insight into an emerging theme or development for the business.
For Trex, EPS didn’t budge over the last two years, a regression from its five-year trend. We hope it can revert to earnings growth in the coming years.
In Q4, Trex reported adjusted EPS of $0.04, down from $0.09 in the same quarter last year. Despite falling year on year, this print easily cleared analysts’ estimates. Over the next 12 months, Wall Street expects Trex’s full-year EPS of $1.88 to shrink by 13.1%.
9. Cash Is King
If you’ve followed StockStory for a while, you know we emphasize free cash flow. Why, you ask? We believe that in the end, cash is king, and you can’t use accounting profits to pay the bills.
Trex has shown decent cash profitability, giving it some flexibility to reinvest or return capital to investors. The company’s free cash flow margin averaged 7.1% over the last five years, slightly better than the broader industrials sector.
Taking a step back, we can see that Trex’s margin expanded by 3.2 percentage points during that time. This shows the company is heading in the right direction, and we can see it became a less capital-intensive business because its free cash flow profitability rose while its operating profitability fell.
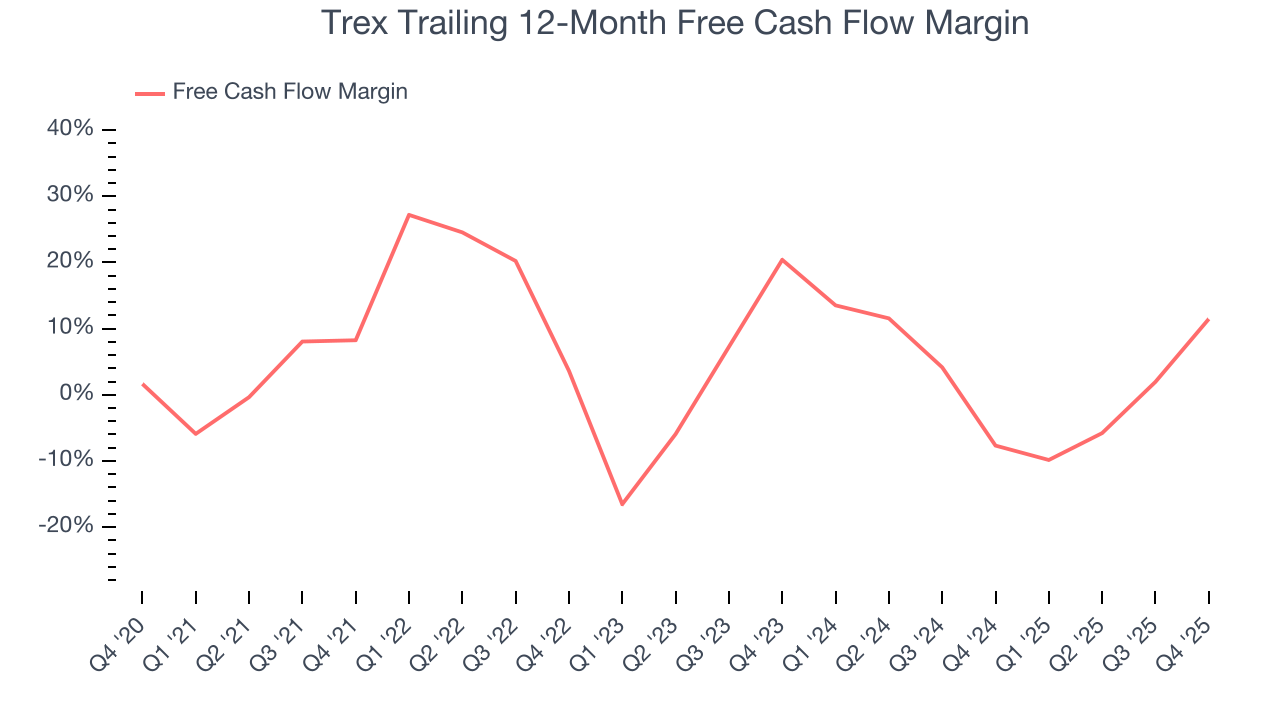
Trex’s free cash flow clocked in at $22.11 million in Q4, equivalent to a 13.7% margin. Its cash flow turned positive after being negative in the same quarter last year, building on its favorable historical trend.
10. Return on Invested Capital (ROIC)
EPS and free cash flow tell us whether a company was profitable while growing its revenue. But was it capital-efficient? Enter ROIC, a metric showing how much operating profit a company generates relative to the money it has raised (debt and equity).
Although Trex hasn’t been the highest-quality company lately because of its poor bottom-line (EPS) performance, it found a few growth initiatives in the past that worked out wonderfully. Its five-year average ROIC was 25.2%, splendid for an industrials business.
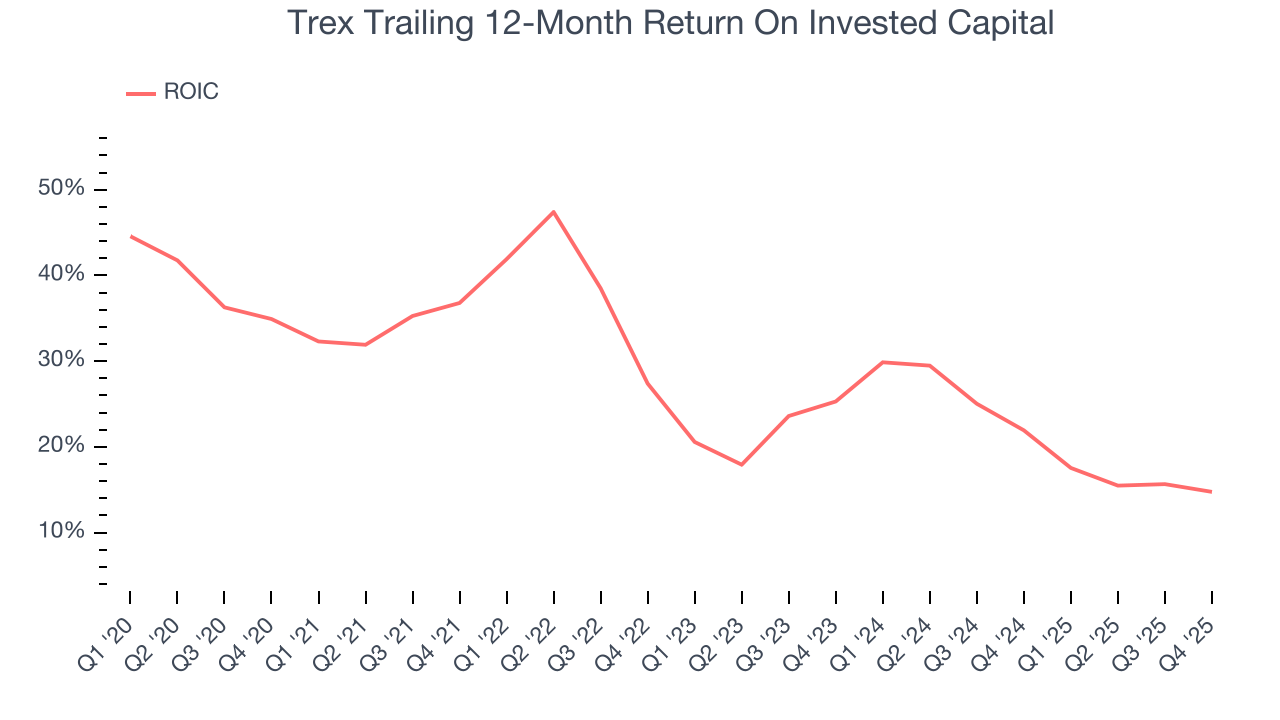
We like to invest in businesses with high returns, but the trend in a company’s ROIC is what often surprises the market and moves the stock price. Over the last few years, Trex’s ROIC has unfortunately decreased significantly. We like what management has done in the past, but its declining returns are perhaps a symptom of fewer profitable growth opportunities.
11. Balance Sheet Assessment
Trex reported $3.81 million of cash and $175.3 million of debt on its balance sheet in the most recent quarter. As investors in high-quality companies, we primarily focus on two things: 1) that a company’s debt level isn’t too high and 2) that its interest payments are not excessively burdening the business.
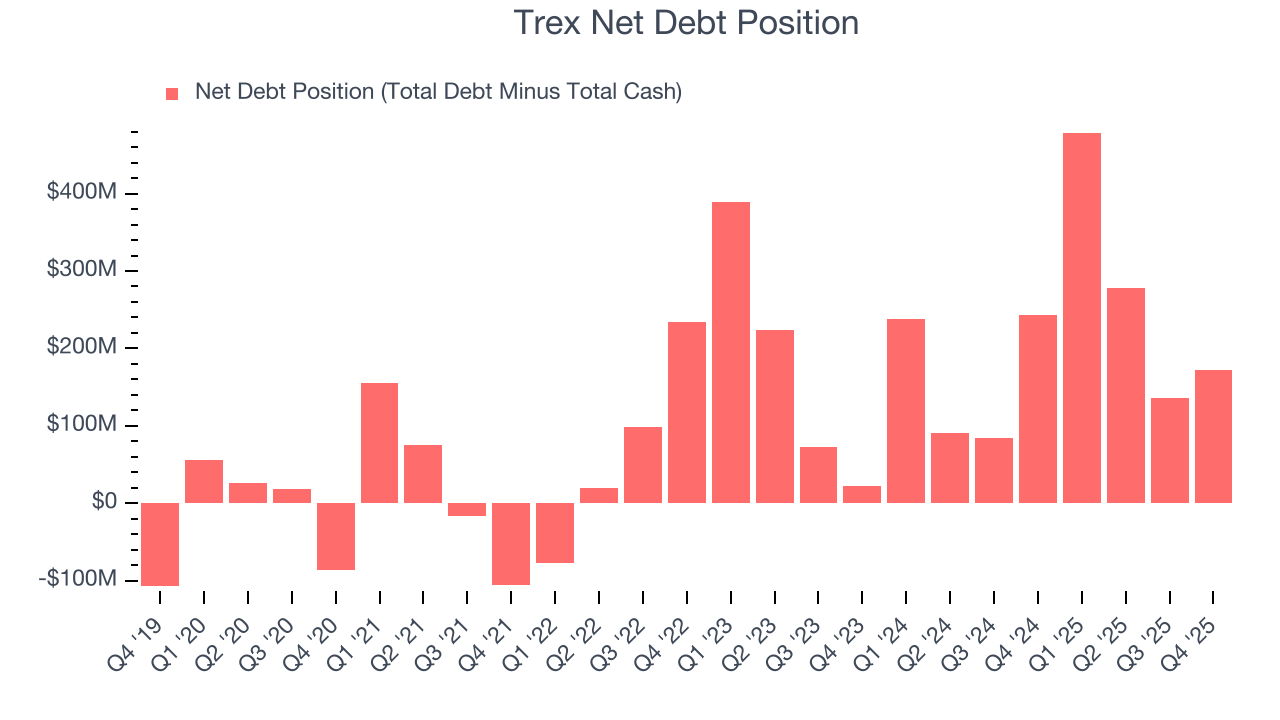
With $336 million of EBITDA over the last 12 months, we view Trex’s 0.5× net-debt-to-EBITDA ratio as safe. We also see its $1,000 of annual interest expenses as appropriate. The company’s profits give it plenty of breathing room, allowing it to continue investing in growth initiatives.
12. Key Takeaways from Trex’s Q4 Results
It was good to see Trex beat analysts’ EPS expectations this quarter. We were also excited its EBITDA outperformed Wall Street’s estimates by a wide margin. Zooming out, we think this quarter featured some important positives. The stock traded up 4.3% to $43.25 immediately after reporting.
13. Is Now The Time To Buy Trex?
Updated: March 16, 2026 at 11:38 PM EDT
Before making an investment decision, investors should account for Trex’s business fundamentals and valuation in addition to what happened in the latest quarter.
Trex doesn’t pass our quality test. First off, its revenue growth was uninspiring over the last five years, and analysts expect its demand to deteriorate over the next 12 months. While its impressive operating margins show it has a highly efficient business model, the downside is its diminishing returns show management's prior bets haven't worked out. On top of that, its projected EPS for the next year is lacking.
Trex’s P/E ratio based on the next 12 months is 22.8x. This multiple tells us a lot of good news is priced in - we think there are better stocks to buy right now.
Wall Street analysts have a consensus one-year price target of $48.95 on the company (compared to the current share price of $37.92).
Although the price target is bullish, readers should exercise caution because analysts tend to be overly optimistic. The firms they work for, often big banks, have relationships with companies that extend into fundraising, M&A advisory, and other rewarding business lines. As a result, they typically hesitate to say bad things for fear they will lose out. We at StockStory do not suffer from such conflicts of interest, so we’ll always tell it like it is.