
Titan International (TWI)
We wouldn’t recommend Titan International. Its poor sales growth and falling returns on capital suggest its growth opportunities are shrinking.― StockStory Analyst Team
1. News


2. Summary
Why We Think Titan International Will Underperform
Acquiring Goodyear’s farm tire business in 2005, Titan (NSYE:TWI) is a manufacturer and supplier of wheels, tires, and undercarriages used in off-highway vehicles such as construction vehicles.
- Performance over the past two years shows each sale was less profitable, as its earnings per share fell by 46.7% annually
- Gross margin of 14.4% reflects its high production costs
- Products and services are facing end-market challenges during this cycle, as seen in its flat sales over the last two years


Titan International’s quality doesn’t meet our hurdle. We believe there are better opportunities elsewhere.
Why There Are Better Opportunities Than Titan International


Titan International is trading at $7.31 per share, or 159.6x forward P/E. We consider this valuation aggressive considering the business fundamentals.
There are stocks out there featuring similar valuation multiples with better fundamentals. We prefer to invest in those.
3. Titan International (TWI) Research Report: Q4 CY2025 Update
Agricultural and farm machinery company Titan (NSYE:TWI) reported Q4 CY2025 results beating Wall Street’s revenue expectations, with sales up 7% year on year to $410.4 million. Guidance for next quarter’s revenue was better than expected at $500 million at the midpoint, 1.7% above analysts’ estimates. Its non-GAAP loss of $0.27 per share was in line with analysts’ consensus estimates.
Titan International (TWI) Q4 CY2025 Highlights:
- Revenue: $410.4 million vs analyst estimates of $396.9 million (7% year-on-year growth, 3.4% beat)
- Adjusted EPS: -$0.27 vs analyst estimates of -$0.28 (in line)
- Adjusted EBITDA: $10.76 million vs analyst estimates of $9.97 million (2.6% margin, 7.9% beat)
- Revenue Guidance for Q1 CY2026 is $500 million at the midpoint, above analyst estimates of $491.5 million
- EBITDA guidance for the upcoming financial year 2026 is $110 million at the midpoint, below analyst estimates of $114.8 million
- Operating Margin: -2.7%, up from -7.4% in the same quarter last year
- Free Cash Flow was -$5.08 million compared to -$4.57 million in the same quarter last year
- Market Capitalization: $672.1 million
Company Overview
Acquiring Goodyear’s farm tire business in 2005, Titan (NSYE:TWI) is a manufacturer and supplier of wheels, tires, and undercarriages used in off-highway vehicles such as construction vehicles.
Titan offers a diverse range of wheels, tires, and tracks designed to meet the specific needs of various off-highway applications. From agricultural tractors to mining haul trucks, Titan's products are engineered for traction, stability, and longevity in rugged conditions. The company also provides tire and wheel assemblies, tire chains, and other accessories to complement its core offerings.
Titan mainly serves original equipment manufacturers (OEMs) like Deere and Caterpillar, while also serving dealers, distributors, and end-users across multiple industries. Customers use the company’s wheels, tires, and undercarriage systems in a wide array of equipment, including tractors, combines, skid steers, and earthmoving machinery.
Titan heavily focuses on aftermarket sales, specifically with its tires, as well as entering contracts with OEMs for the procurement of products and services. The company further leverages a combination of direct sales teams, independent dealers, and distribution partners to reach customers.
4. Agricultural Machinery
Agricultural machinery companies are investing to develop and produce more precise machinery, automated systems, and connected equipment that collects analyzable data to help farmers and other customers improve yields and increase efficiency. On the other hand, agriculture is seasonal and natural disasters or bad weather can impact the entire industry. Additionally, macroeconomic factors such as commodity prices or changes in interest rates–which dictate the willingness of these companies or their customers to invest–can impact demand for agricultural machinery.
Titan’s peers and competitors include Goodyear (NASDAQ:GT) and Myers Industries (NYSE:MYE).
5. Revenue Growth
A company’s long-term sales performance is one signal of its overall quality. Any business can put up a good quarter or two, but the best consistently grow over the long haul. Over the last five years, Titan International grew its sales at a decent 7.7% compounded annual growth rate. Its growth was slightly above the average industrials company and shows its offerings resonate with customers.
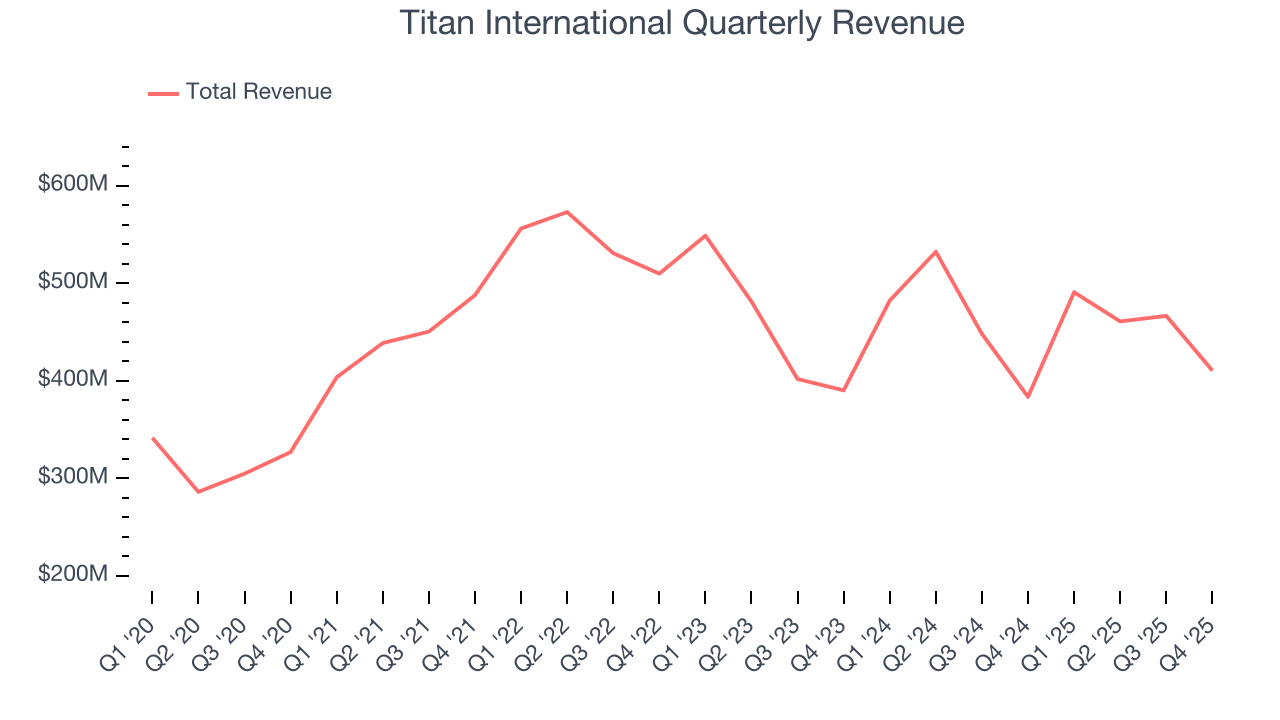
Long-term growth is the most important, but within industrials, a half-decade historical view may miss new industry trends or demand cycles. Titan International’s recent performance shows its demand has slowed as its revenue was flat over the last two years. 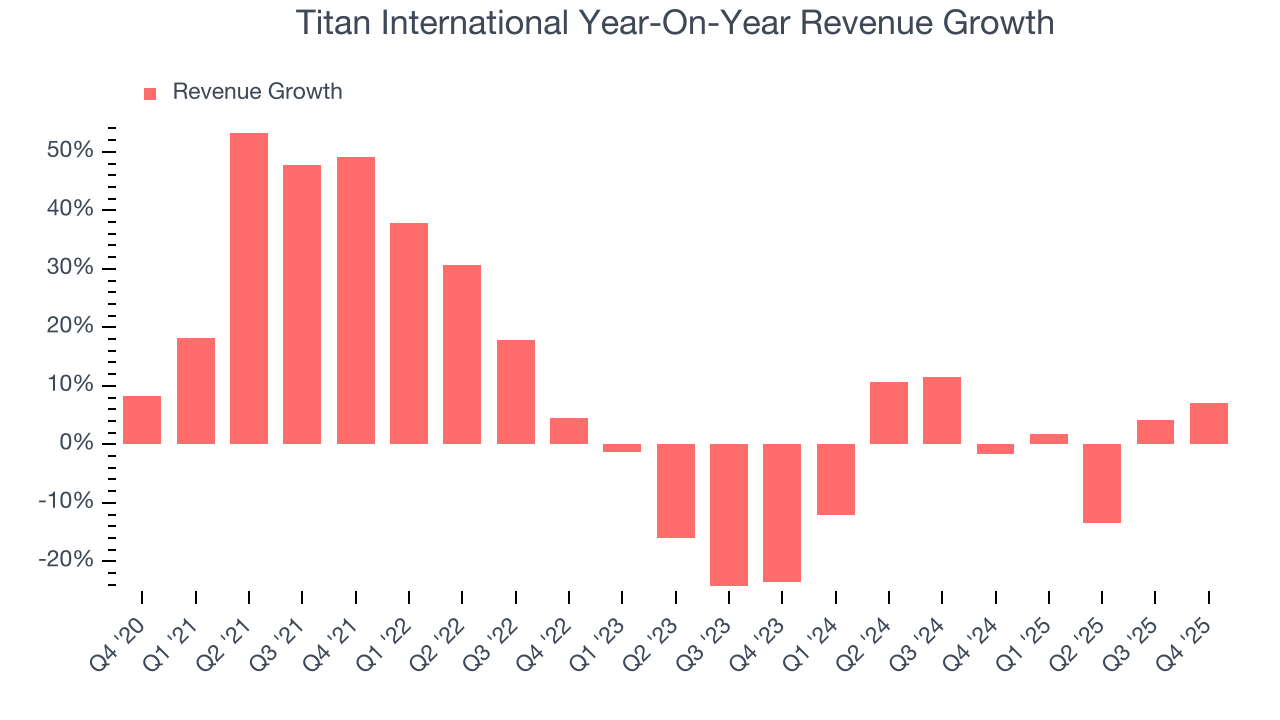
This quarter, Titan International reported year-on-year revenue growth of 7%, and its $410.4 million of revenue exceeded Wall Street’s estimates by 3.4%. Company management is currently guiding for a 1.9% year-on-year increase in sales next quarter.
Looking further ahead, sell-side analysts expect revenue to grow 1.9% over the next 12 months. Although this projection implies its newer products and services will spur better top-line performance, it is still below average for the sector.
6. Gross Margin & Pricing Power
For industrials businesses, cost of sales is usually comprised of the direct labor, raw materials, and supplies needed to offer a product or service. These costs can be impacted by inflation and supply chain dynamics in the short term and a company’s purchasing power and scale over the long term.
Titan International has bad unit economics for an industrials business, signaling it operates in a competitive market. As you can see below, it averaged a 14.3% gross margin over the last five years. That means Titan International paid its suppliers a lot of money ($85.66 for every $100 in revenue) to run its business. 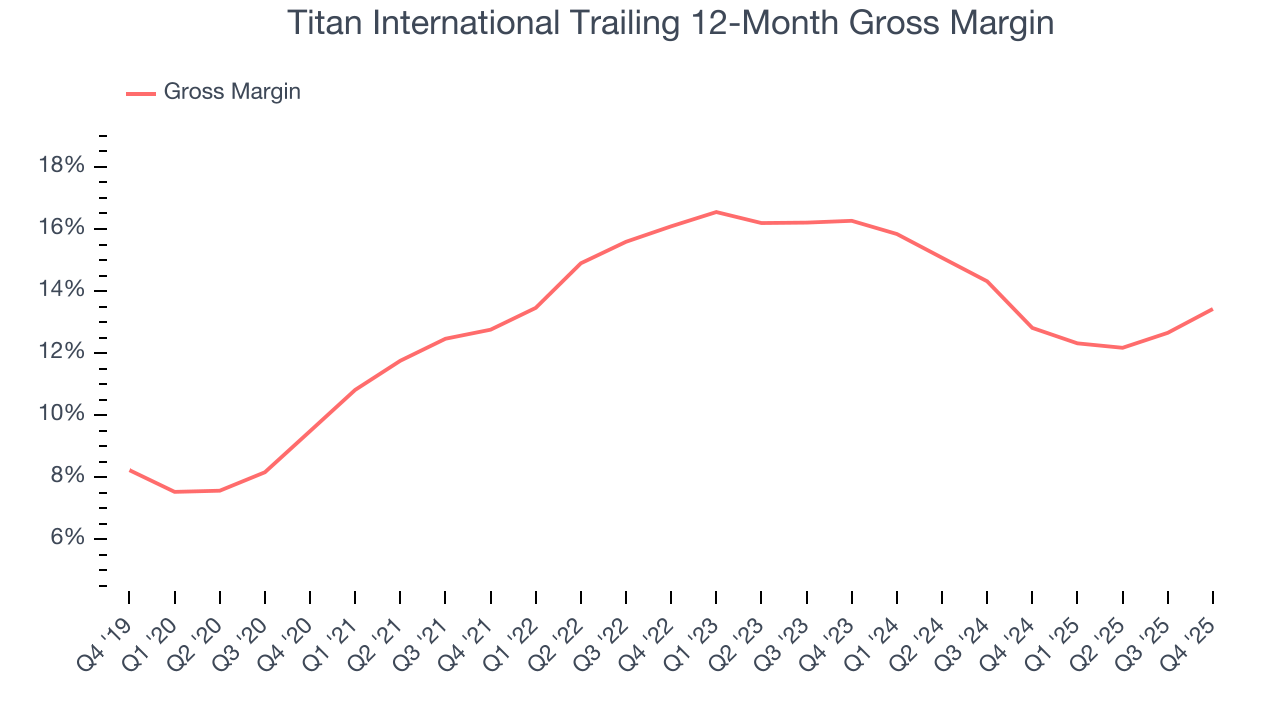
Titan International produced a 10.9% gross profit margin in Q4, up 3.8 percentage points year on year. Zooming out, the company’s full-year margin has remained steady over the past 12 months, suggesting its input costs (such as raw materials and manufacturing expenses) have been stable and it isn’t under pressure to lower prices.
7. Operating Margin
Operating margin is a key measure of profitability. Think of it as net income - the bottom line - excluding the impact of taxes and interest on debt, which are less connected to business fundamentals.
Titan International was profitable over the last five years but held back by its large cost base. Its average operating margin of 5.2% was weak for an industrials business. This result isn’t too surprising given its low gross margin as a starting point.
Looking at the trend in its profitability, Titan International’s operating margin decreased by 3.6 percentage points over the last five years. This raises questions about the company’s expense base because its revenue growth should have given it leverage on its fixed costs, resulting in better economies of scale and profitability. Titan International’s performance was poor no matter how you look at it - it shows that costs were rising and it couldn’t pass them onto its customers.
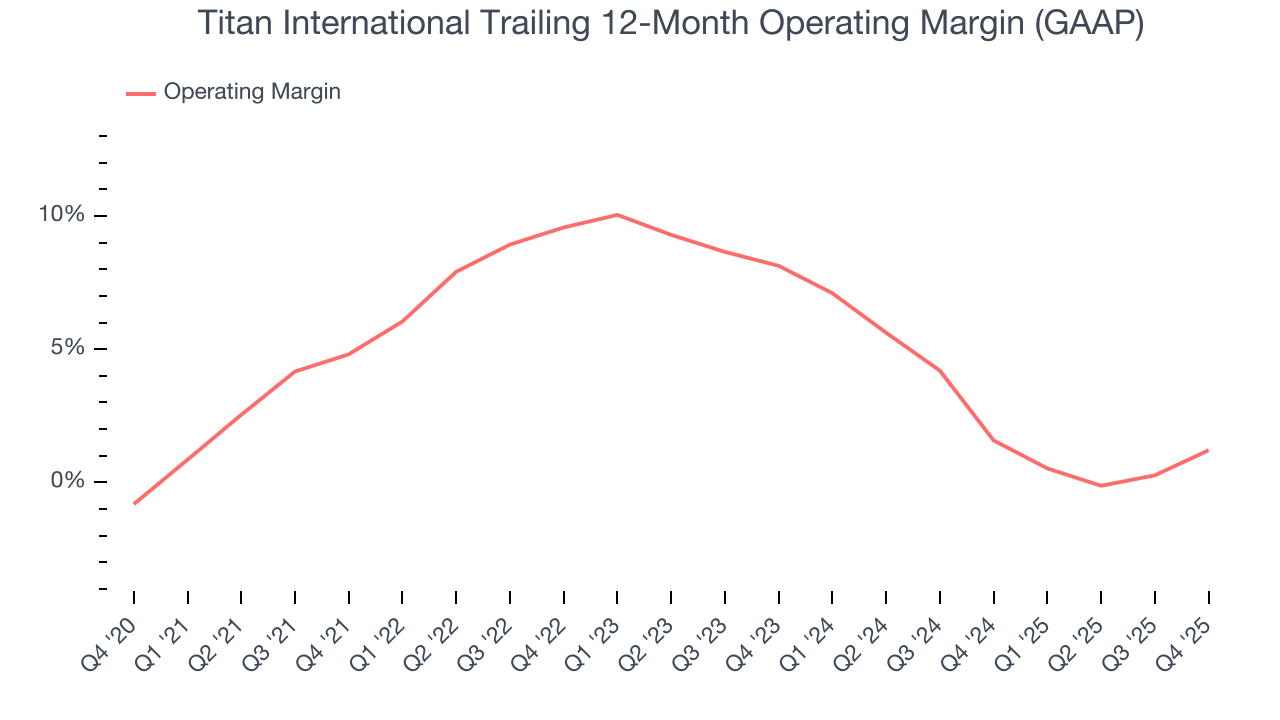
In Q4, Titan International generated an operating margin profit margin of negative 2.7%, up 4.7 percentage points year on year. The increase was encouraging, and because its operating margin rose more than its gross margin, we can infer it was more efficient with expenses such as marketing, R&D, and administrative overhead.
8. Earnings Per Share
Revenue trends explain a company’s historical growth, but the long-term change in earnings per share (EPS) points to the profitability of that growth – for example, a company could inflate its sales through excessive spending on advertising and promotions.
Although Titan International’s full-year earnings are still negative, it reduced its losses and improved its EPS by 15.3% annually over the last five years. The next few quarters will be critical for assessing its long-term profitability.
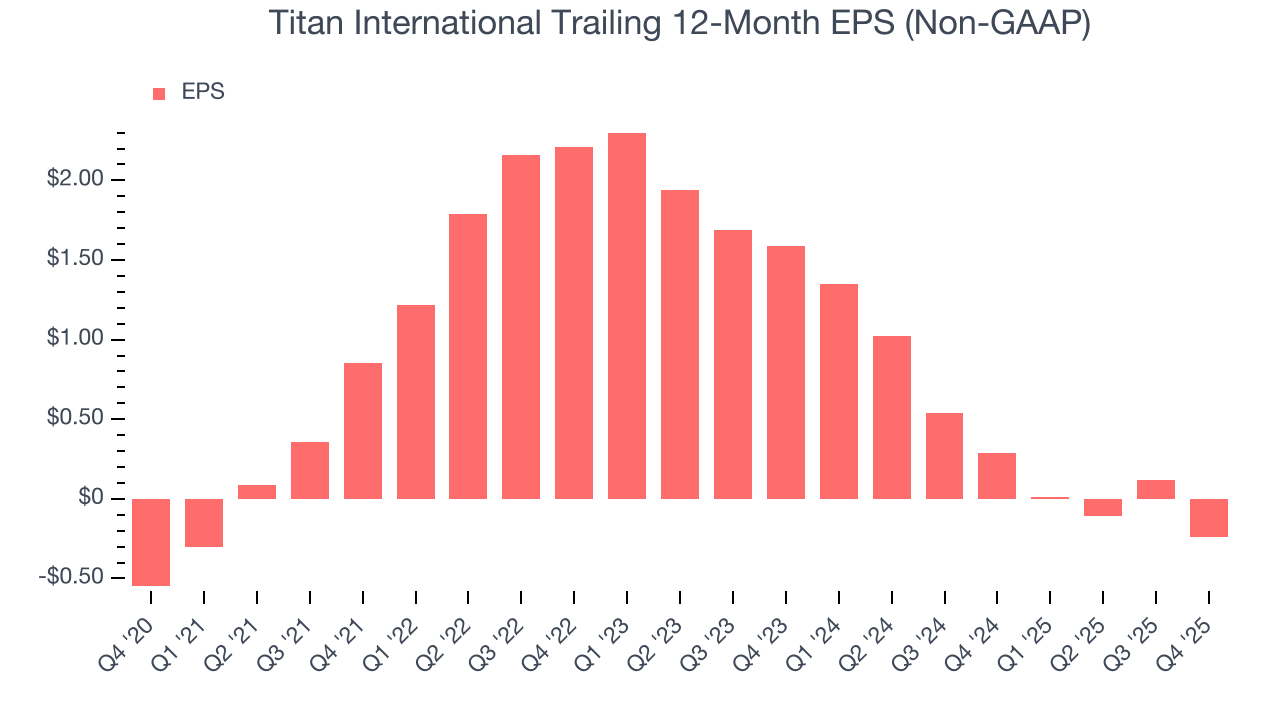
Like with revenue, we analyze EPS over a shorter period to see if we are missing a change in the business.
Sadly for Titan International, its EPS declined by 46.7% annually over the last two years while its revenue was flat. This tells us the company struggled to adjust to choppy demand.
We can take a deeper look into Titan International’s earnings to better understand the drivers of its performance. We mentioned earlier that Titan International’s operating margin expanded this quarter, but a two-year view shows its margin has declinedwhile its share count has grown 3%. This means the company not only became less efficient with its operating expenses but also diluted its shareholders. 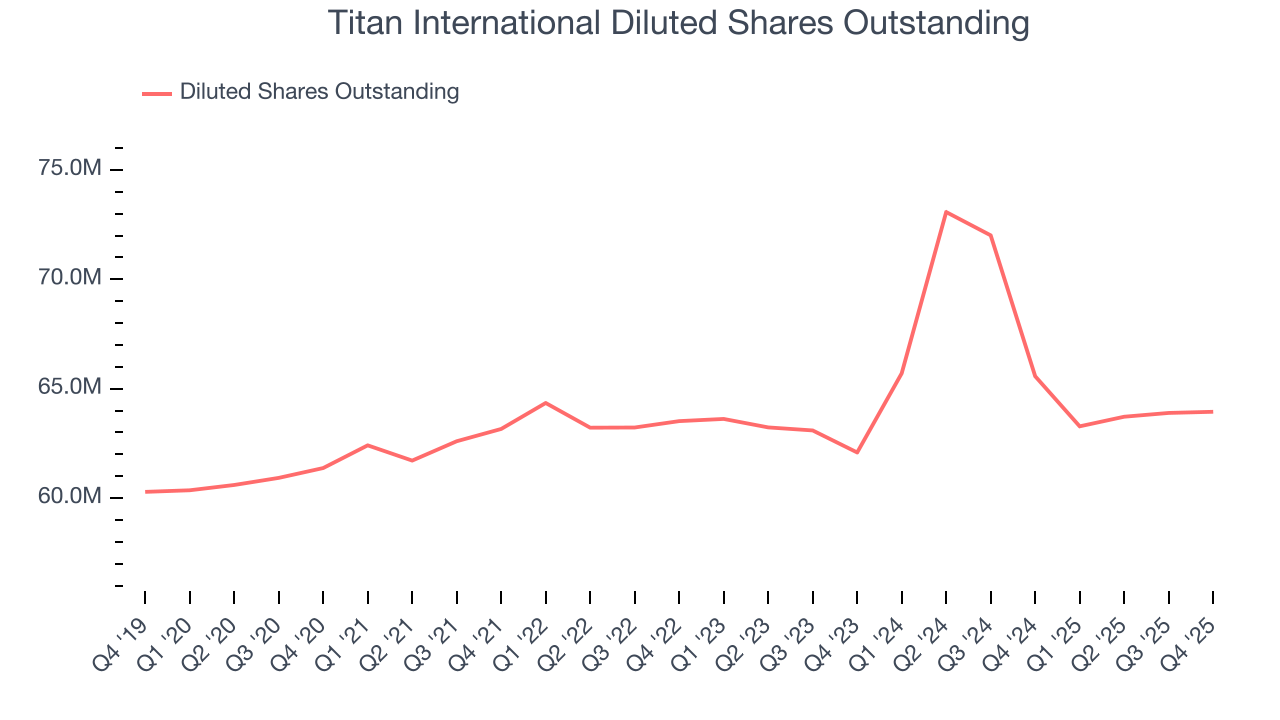
In Q4, Titan International reported adjusted EPS of negative $0.27, down from $0.09 in the same quarter last year. Despite falling year on year, this print beat analysts’ estimates by 1.8%. Over the next 12 months, Wall Street is optimistic. Analysts forecast Titan International’s full-year EPS of negative $0.24 will flip to positive $0.17.
9. Cash Is King
Free cash flow isn't a prominently featured metric in company financials and earnings releases, but we think it's telling because it accounts for all operating and capital expenses, making it tough to manipulate. Cash is king.
Titan International has shown poor cash profitability over the last five years, giving the company limited opportunities to return capital to shareholders. Its free cash flow margin averaged 2.7%, lousy for an industrials business.
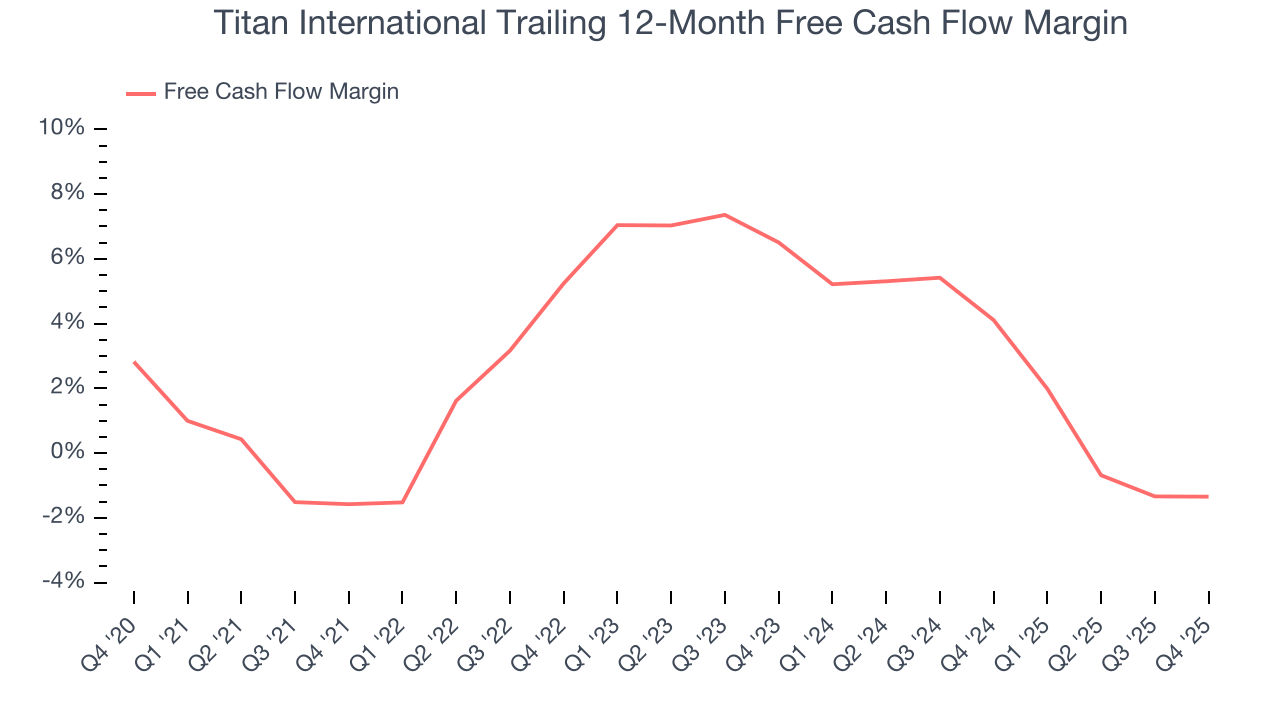
Titan International burned through $5.08 million of cash in Q4, equivalent to a negative 1.2% margin. The company’s cash burn was similar to its $4.57 million of lost cash in the same quarter last year. These numbers deviate from its longer-term margin, indicating it is a seasonal business that must build up inventory during certain quarters.
10. Return on Invested Capital (ROIC)
EPS and free cash flow tell us whether a company was profitable while growing its revenue. But was it capital-efficient? A company’s ROIC explains this by showing how much operating profit it makes compared to the money it has raised (debt and equity).
Although Titan International hasn’t been the highest-quality company lately, it historically found a few growth initiatives that worked out well. Its five-year average ROIC was 16.1%, impressive for an industrials business.
We like to invest in businesses with high returns, but the trend in a company’s ROIC is what often surprises the market and moves the stock price. Over the last few years, Titan International’s ROIC has unfortunately decreased significantly. We like what management has done in the past, but its declining returns are perhaps a symptom of fewer profitable growth opportunities.
11. Balance Sheet Risk
Debt is a tool that can boost company returns but presents risks if used irresponsibly. As long-term investors, we aim to avoid companies taking excessive advantage of this instrument because it could lead to insolvency.
Titan International’s $710.8 million of debt exceeds the $202.9 million of cash on its balance sheet. Furthermore, its 5× net-debt-to-EBITDA ratio (based on its EBITDA of $101.5 million over the last 12 months) shows the company is overleveraged.
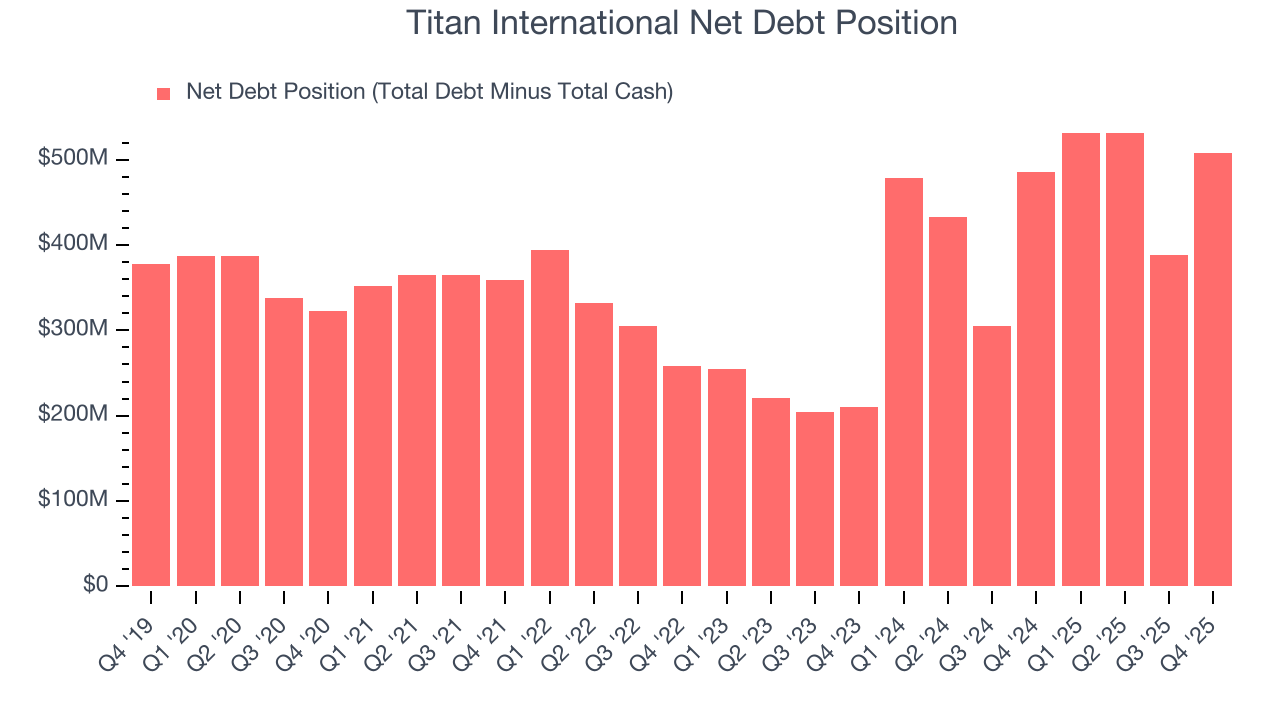
At this level of debt, incremental borrowing becomes increasingly expensive and credit agencies could downgrade the company’s rating if profitability falls. Titan International could also be backed into a corner if the market turns unexpectedly – a situation we seek to avoid as investors in high-quality companies.
We hope Titan International can improve its balance sheet and remain cautious until it increases its profitability or pays down its debt.
12. Key Takeaways from Titan International’s Q4 Results
We were impressed by how significantly Titan International blew past analysts’ EBITDA expectations this quarter. We were also glad its revenue outperformed Wall Street’s estimates. On the other hand, its full-year EBITDA guidance missed and its EBITDA guidance for next quarter fell short of Wall Street’s estimates. Overall, we think this was still a solid quarter with some key areas of upside. The stock remained flat at $10.51 immediately following the results.
13. Is Now The Time To Buy Titan International?
Updated: March 19, 2026 at 11:14 PM EDT
When considering an investment in Titan International, investors should account for its valuation and business qualities as well as what’s happened in the latest quarter.
We cheer for all companies making their customers lives easier, but in the case of Titan International, we’ll be cheering from the sidelines. Although its revenue growth was decent over the last five years, it’s expected to deteriorate over the next 12 months and its diminishing returns show management's prior bets haven't worked out. And while the company’s projected EPS for the next year implies the company’s fundamentals will improve, the downside is its low gross margins indicate some combination of competitive pressures and high production costs.
Titan International’s P/E ratio based on the next 12 months is 161.1x. This valuation tells us it’s a bit of a market darling with a lot of good news priced in - we think other companies feature superior fundamentals at the moment.
Wall Street analysts have a consensus one-year price target of $11.75 on the company (compared to the current share price of $7.16).
Although the price target is bullish, readers should exercise caution because analysts tend to be overly optimistic. The firms they work for, often big banks, have relationships with companies that extend into fundraising, M&A advisory, and other rewarding business lines. As a result, they typically hesitate to say bad things for fear they will lose out. We at StockStory do not suffer from such conflicts of interest, so we’ll always tell it like it is.