
Wayfair (W)
We aren’t fans of Wayfair. Its inability to grow sales suggests demand is weak and its meager free cash flow margin puts it in a pinch.― StockStory Analyst Team
1. News


2. Summary
Why We Think Wayfair Will Underperform
Founded in 2002 by Niraj Shah, Wayfair (NYSE:W) is a leading online retailer of mass-market home goods in the US, UK, Canada, and Germany.
- Active Customers averaged 2.3% declines, showing that intense competition is diverting traffic from its platform
- Bad unit economics and steep infrastructure costs are reflected in its low gross margin of 30.2%
- One positive is that its customers are spending more money on its platform as its average revenue per buyer has increased by 116% annually over the last two years


Wayfair doesn’t measure up to our expectations. We’re looking for better stocks elsewhere.
Why There Are Better Opportunities Than Wayfair


Wayfair is trading at $77.40 per share, or 15.4x forward EV/EBITDA. This multiple is quite expensive for the quality you get.
Paying a premium for high-quality companies with strong long-term earnings potential is preferable to owning challenged businesses with questionable prospects. That helps the prudent investor sleep well at night.
3. Wayfair (W) Research Report: Q4 CY2025 Update
Online home goods retailer Wayfair (NYSE:W) beat Wall Street’s revenue expectations in Q4 CY2025, with sales up 6.9% year on year to $3.34 billion. Its non-GAAP profit of $0.85 per share was 23.9% above analysts’ consensus estimates.
Wayfair (W) Q4 CY2025 Highlights:
- Revenue: $3.34 billion vs analyst estimates of $3.3 billion (6.9% year-on-year growth, 1.1% beat)
- Adjusted EPS: $0.85 vs analyst estimates of $0.69 (23.9% beat)
- Adjusted EBITDA: $224 million vs analyst estimates of $199.2 million (6.7% margin, 12.5% beat)
- Operating Margin: 2.5%, up from -3.7% in the same quarter last year
- Free Cash Flow Margin: 4.3%, up from 3% in the previous quarter
- Active Customers: 21 million, down 400,000 year on year
- Market Capitalization: $11.92 billion
Company Overview
Founded in 2002 by Niraj Shah, Wayfair (NYSE:W) is a leading online retailer of mass-market home goods in the US, UK, Canada, and Germany.
Wayfair operates an ecommerce platform that operates through 5 brands: its flagship Wayfair.com, Joss & Main, Birch Lane, AllModern, and Perigold, who collectively offer over 20 million products from over 16K suppliers in the largely unbranded furniture manufacturing industry. The company offers the widest array of home furnishing options online, and because of the unbranded nature, is often relatively low priced, due to its lack of brick and mortar infrastructure, allowing consumers to personalize home stylings that mimic designer fashions at a fraction of the price.
Wayfair’s business model differentiation is threefold: a combination of scale-driven online marketing investments and expertise in converting customers, along with holding minimal inventory, instead orchestrating a logistics network where the majority of its products are shipped directly to customers from its suppliers, while also offering an Amazon-like ability for its suppliers to house inventory in Wayfair warehouses to speed delivery (for a fee).
4. Online Retail
Consumers ever rising demand for convenience, selection, and speed are secular engines underpinning ecommerce adoption. For years prior to Covid, ecommerce penetration as a percentage of overall retail would grow 1-2% annually, but in 2020 adoption accelerated by 5%, reaching 25%, as increased emphasis on convenience drove consumers to structurally buy more online. The surge in buying caused many online retailers to rapidly grow their logistics infrastructures, preparing them for further growth in the years ahead as consumer shopping habits continue to shift online.
Wayfair (NYSE:W) competes with Amazon (NASDAQ:AMZN), Overstock (NASDAQ: OSTK), Bed Bath and Beyond (NYSE:BBBY), RH (NYSE:RH), Williams Sonoma (NYSE:WSM), Target (NYSE:TGT), Macy’s (NYSE:M), and privately held Ikea.
5. Revenue Growth
A company’s long-term sales performance is one signal of its overall quality. Any business can put up a good quarter or two, but many enduring ones grow for years. Unfortunately, Wayfair struggled to consistently increase demand as its $12.46 billion of sales for the trailing 12 months was close to its revenue three years ago. This was below our standards and is a sign of lacking business quality.
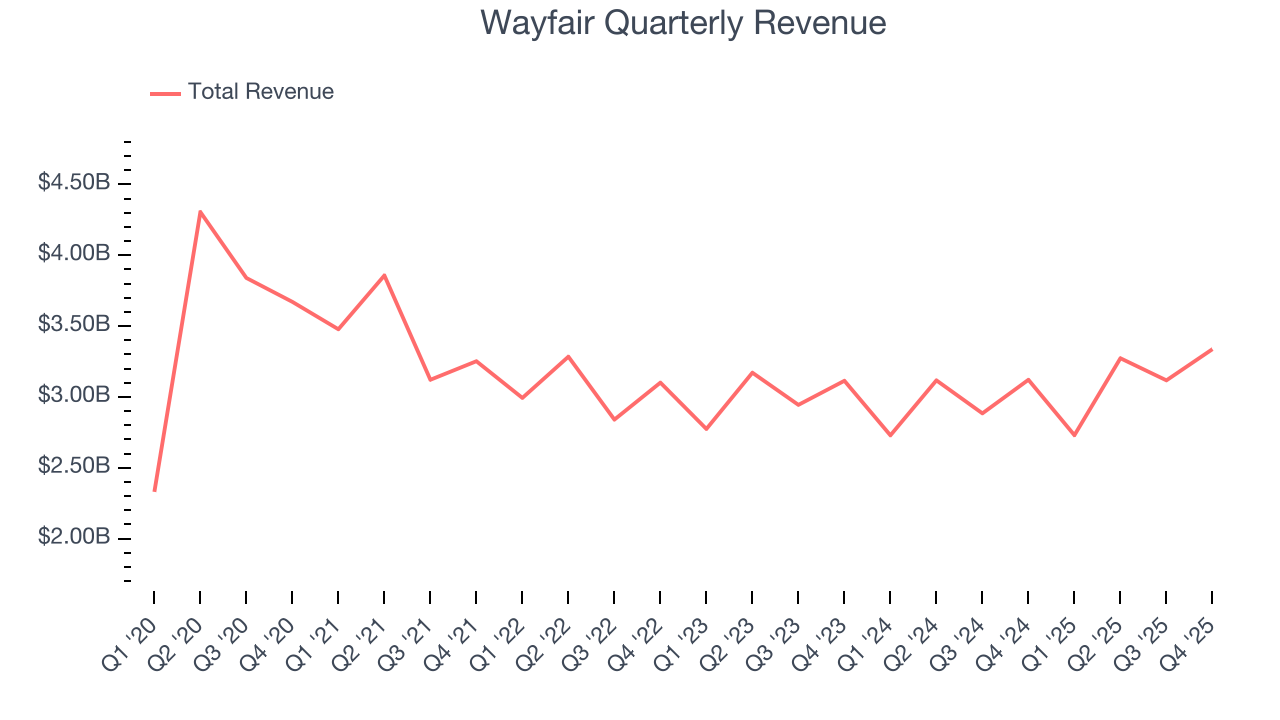
This quarter, Wayfair reported year-on-year revenue growth of 6.9%, and its $3.34 billion of revenue exceeded Wall Street’s estimates by 1.1%.
Looking ahead, sell-side analysts expect revenue to grow 4.9% over the next 12 months. While this projection suggests its newer products and services will catalyze better top-line performance, it is still below average for the sector.
6. Active Customers
Buyer Growth
As an online retailer, Wayfair generates revenue growth by expanding its number of users and the average order size in dollars.
Wayfair struggled with new customer acquisition over the last two years as its active customers have declined by 2.3% annually to 21 million in the latest quarter. This performance isn't ideal because internet usage is secular, meaning there are typically unaddressed market opportunities. If Wayfair wants to accelerate growth, it likely needs to enhance the appeal of its current offerings or innovate with new products. 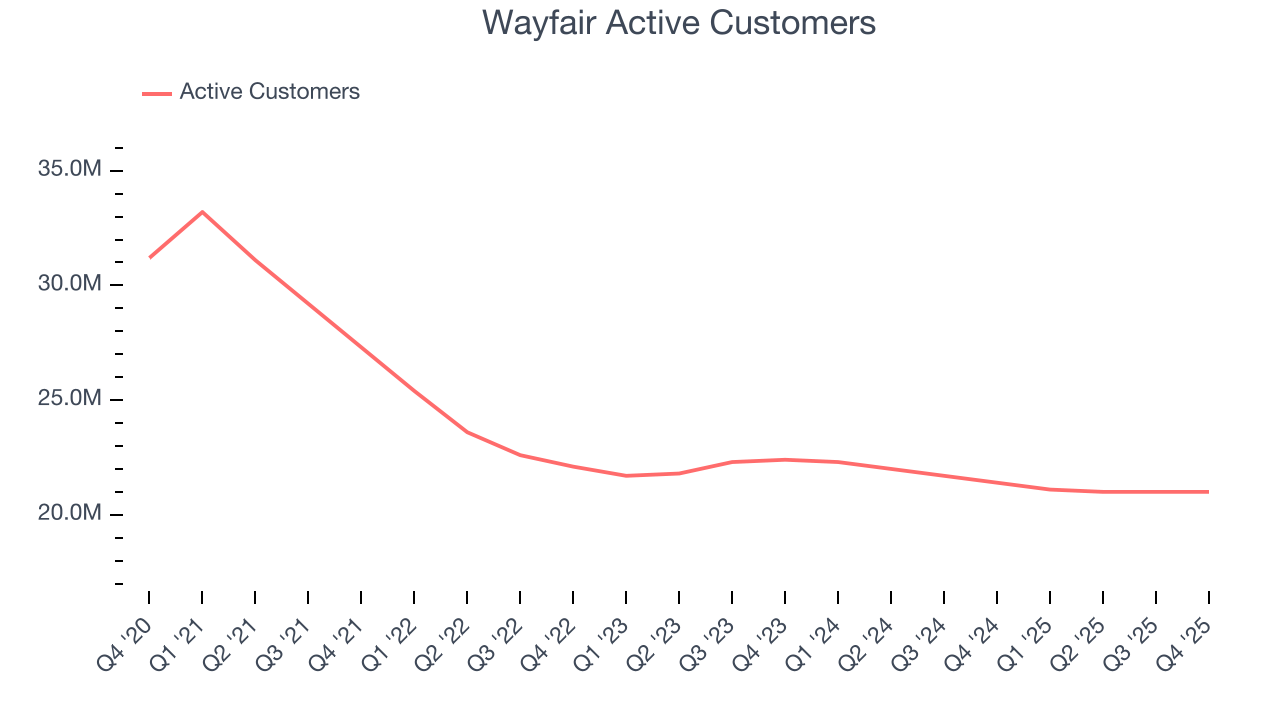
In Q4, Wayfair’s active customers once again decreased by 400,000, a 1.9% drop since last year. The quarterly print isn’t too different from its two-year result, suggesting its new initiatives aren’t accelerating buyer growth just yet.
Revenue Per Buyer
Average revenue per buyer (ARPB) is a critical metric to track because it measures how much customers spend per order.
Wayfair’s ARPB growth has been exceptional over the last two years, averaging 116%. Although its active customers shrank during this time, the company’s ability to successfully increase monetization demonstrates its platform’s value for existing buyers. 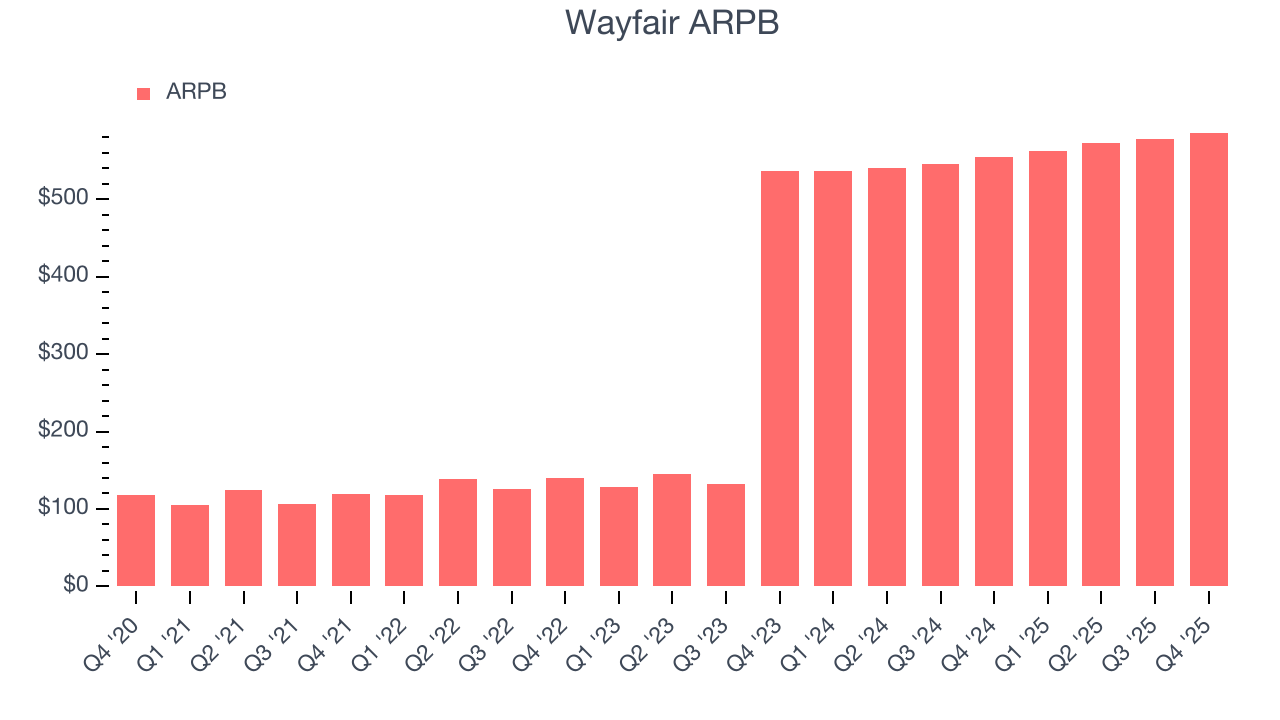
This quarter, Wayfair’s ARPB clocked in at $586. It grew by 5.6% year on year, faster than its active customers.
7. Gross Margin & Pricing Power
For online retail (separate from online marketplaces) businesses like Wayfair, gross profit tells us how much money the company gets to keep after covering the base cost of its products and services, which typically include the cost of acquiring the products sold, shipping and fulfillment, customer service, and digital infrastructure.
Wayfair’s unit economics are far below other consumer internet companies because it must carry inventories as an online retailer. This means it has relatively higher capital intensity than a pure software business like Meta or Airbnb and signals it operates in a competitive market. As you can see below, it averaged a 30.2% gross margin over the last two years. That means Wayfair paid its providers a lot of money ($69.81 for every $100 in revenue) to run its business. 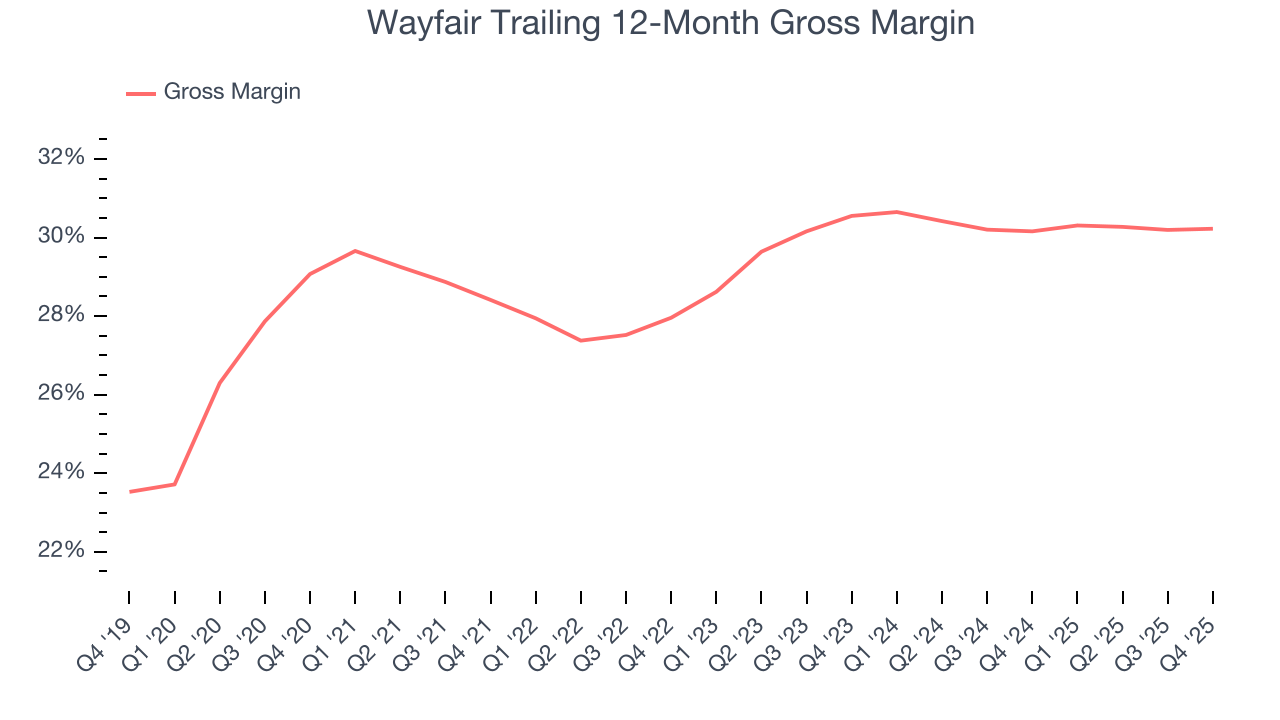
Wayfair’s gross profit margin came in at 30.3% this quarter, in line with the same quarter last year. On a wider time horizon, the company’s full-year margin has remained steady over the past four quarters, suggesting its input costs have been stable and it isn’t under pressure to lower prices.
8. User Acquisition Efficiency
Unlike enterprise software that’s typically sold by dedicated sales teams, consumer internet businesses like Wayfair grow from a combination of product virality, paid advertisement, and incentives.
It’s relatively expensive for Wayfair to acquire new users as the company has spent 47.4% of its gross profit on sales and marketing expenses over the last year. This inefficiency indicates that Wayfair operates in a competitive market and must continue investing to maintain an acceptable growth trajectory. 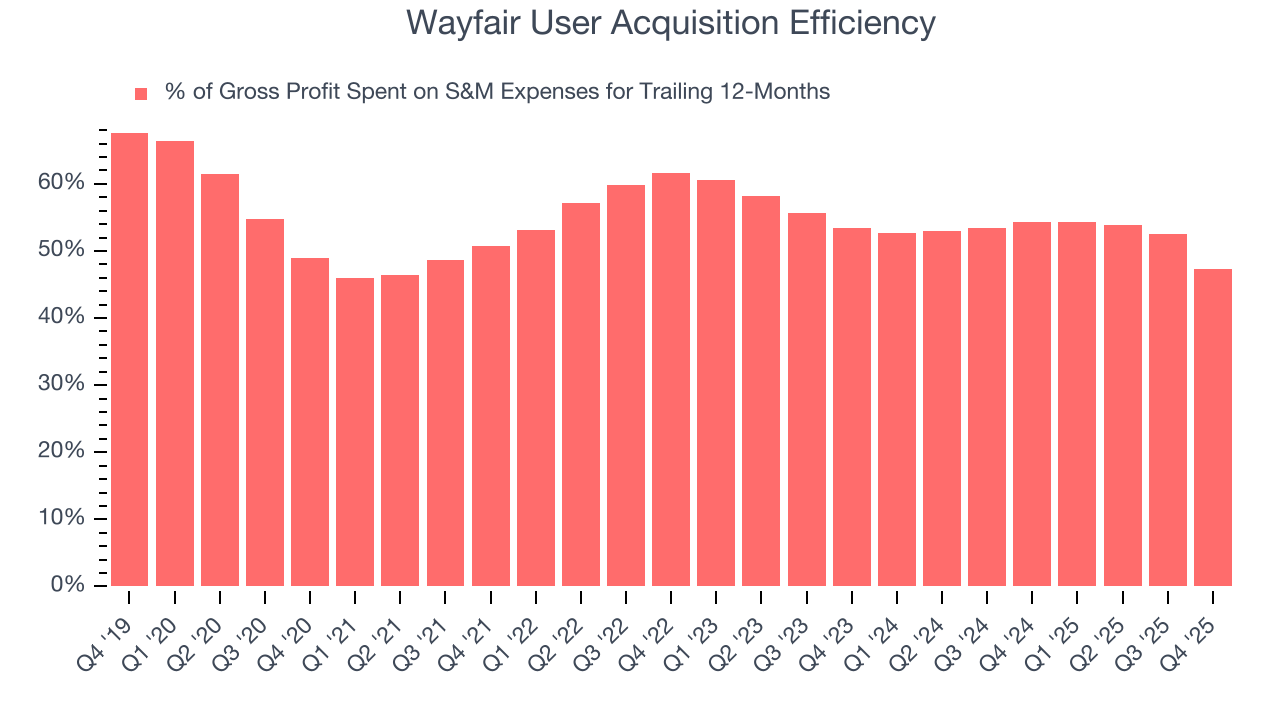
9. EBITDA
Investors frequently analyze operating income to understand a business’s core profitability. Similar to operating income, EBITDA is a common profitability metric for consumer internet companies because it removes various one-time or non-cash expenses, offering a more normalized view of profit potential.
Wayfair has managed its cost base well over the last two years. It demonstrated solid profitability for a consumer internet business, producing an average EBITDA margin of 4.9%. This result was particularly impressive because of its low gross margin, which is mostly a factor of what it sells and takes huge shifts to move meaningfully. Companies have more control over their operating margins, and it’s a show of well-managed operations if they’re high when gross margins are low.
Analyzing the trend in its profitability, Wayfair’s EBITDA margin rose by 9.4 percentage points over the last few years, showing its efficiency has improved.
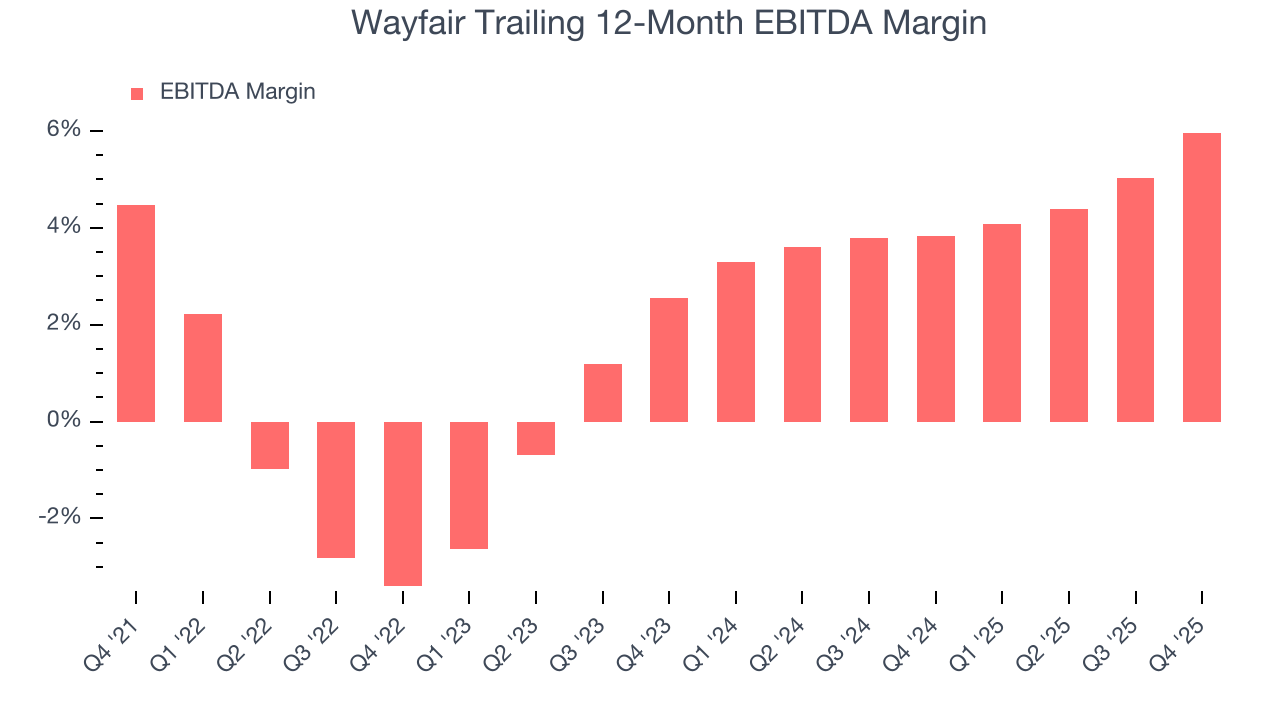
In Q4, Wayfair generated an EBITDA margin profit margin of 6.7%, up 3.6 percentage points year on year. The increase was encouraging, and because its EBITDA margin rose more than its gross margin, we can infer it was more efficient with expenses such as marketing, R&D, and administrative overhead.
10. Earnings Per Share
Revenue trends explain a company’s historical growth, but the long-term change in earnings per share (EPS) points to the profitability of that growth – for example, a company could inflate its sales through excessive spending on advertising and promotions.
Wayfair’s full-year EPS flipped from negative to positive over the last three years. This is encouraging and shows it’s at a critical moment in its life.
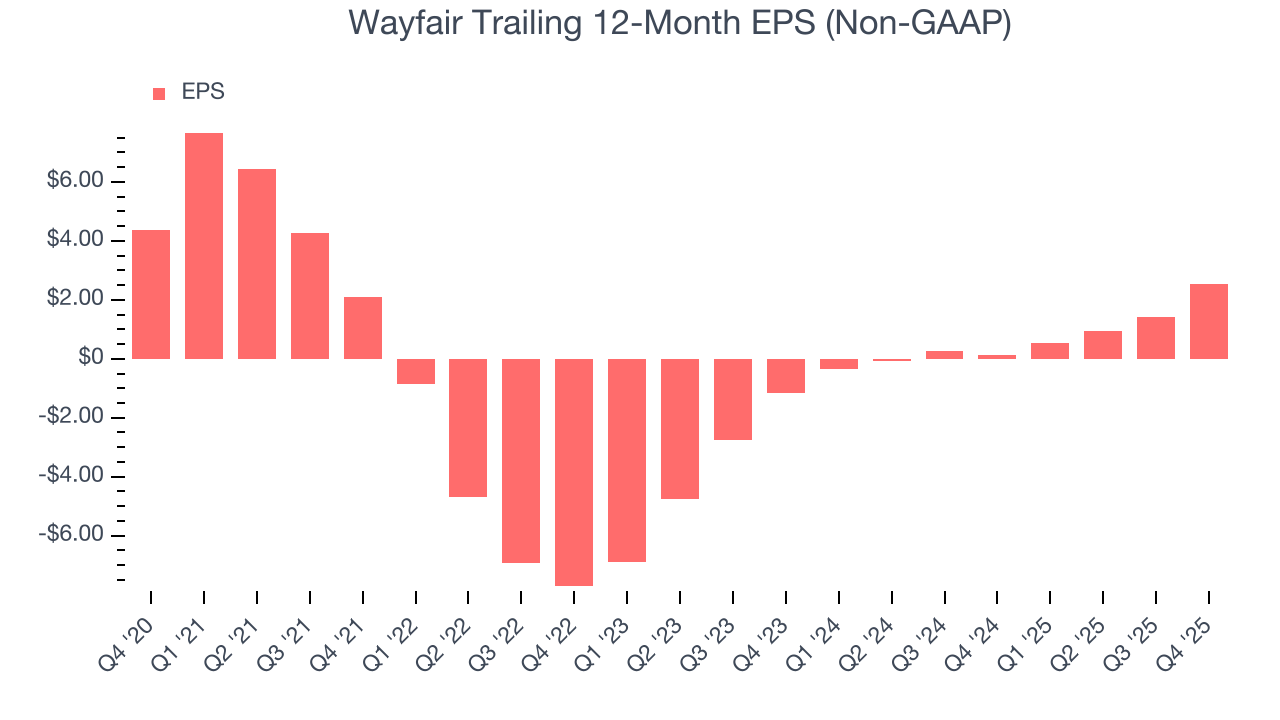
In Q4, Wayfair reported adjusted EPS of $0.85, up from negative $0.25 in the same quarter last year. This print easily cleared analysts’ estimates, and shareholders should be content with the results. Over the next 12 months, Wall Street expects Wayfair’s full-year EPS of $2.52 to grow 17.3%.
11. Cash Is King
Free cash flow isn't a prominently featured metric in company financials and earnings releases, but we think it's telling because it accounts for all operating and capital expenses, making it tough to manipulate. Cash is king.
Wayfair has shown weak cash profitability over the last two years, giving the company limited opportunities to return capital to shareholders. Its free cash flow margin averaged 1.7%, subpar for a consumer internet business. The divergence from its good EBITDA margin stems from its capital-intensive business model, which requires Wayfair to make large cash investments in working capital (i.e., stocking inventories) and capital expenditures (i.e., building new facilities).
Taking a step back, an encouraging sign is that Wayfair’s margin expanded by 11.9 percentage points over the last few years. The company’s improvement shows it’s heading in the right direction, and we can see it became a less capital-intensive business because its free cash flow profitability rose more than its operating profitability.
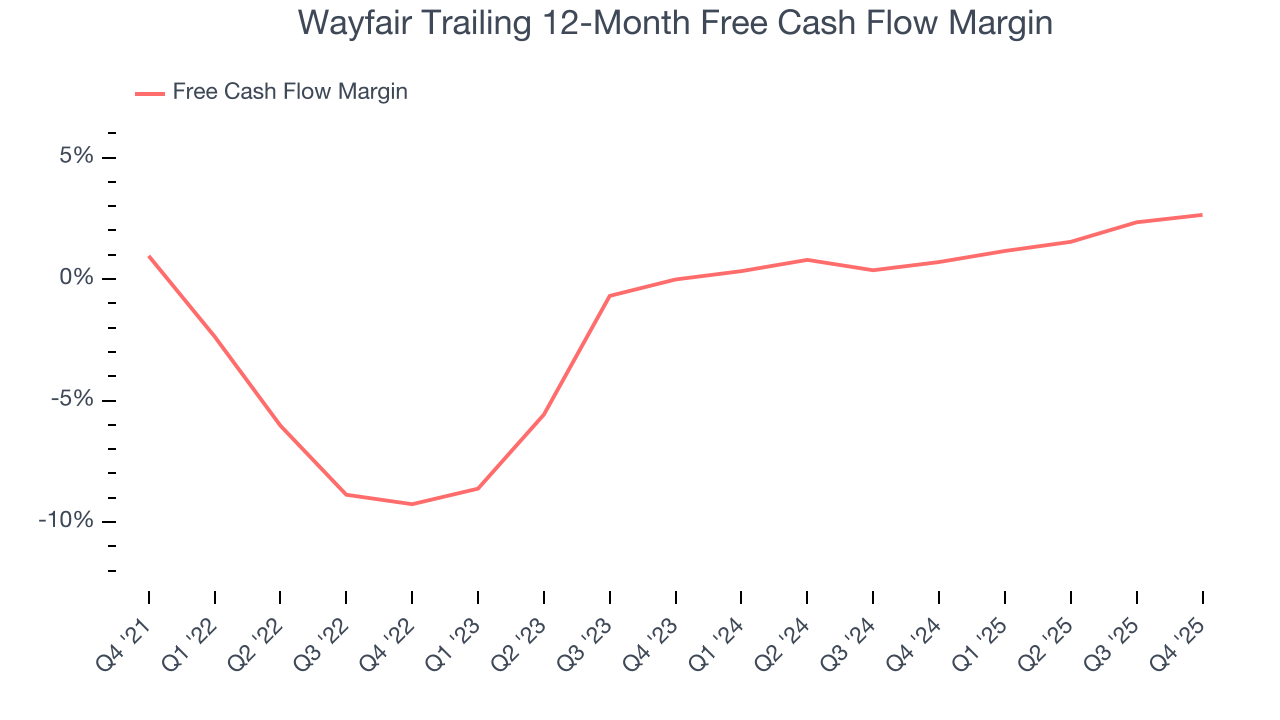
Wayfair’s free cash flow clocked in at $145 million in Q4, equivalent to a 4.3% margin. This result was good as its margin was 1.1 percentage points higher than in the same quarter last year, building on its favorable historical trend.
12. Balance Sheet Assessment
Wayfair reported $1.54 billion of cash and $4.07 billion of debt on its balance sheet in the most recent quarter. As investors in high-quality companies, we primarily focus on two things: 1) that a company’s debt level isn’t too high and 2) that its interest payments are not excessively burdening the business.
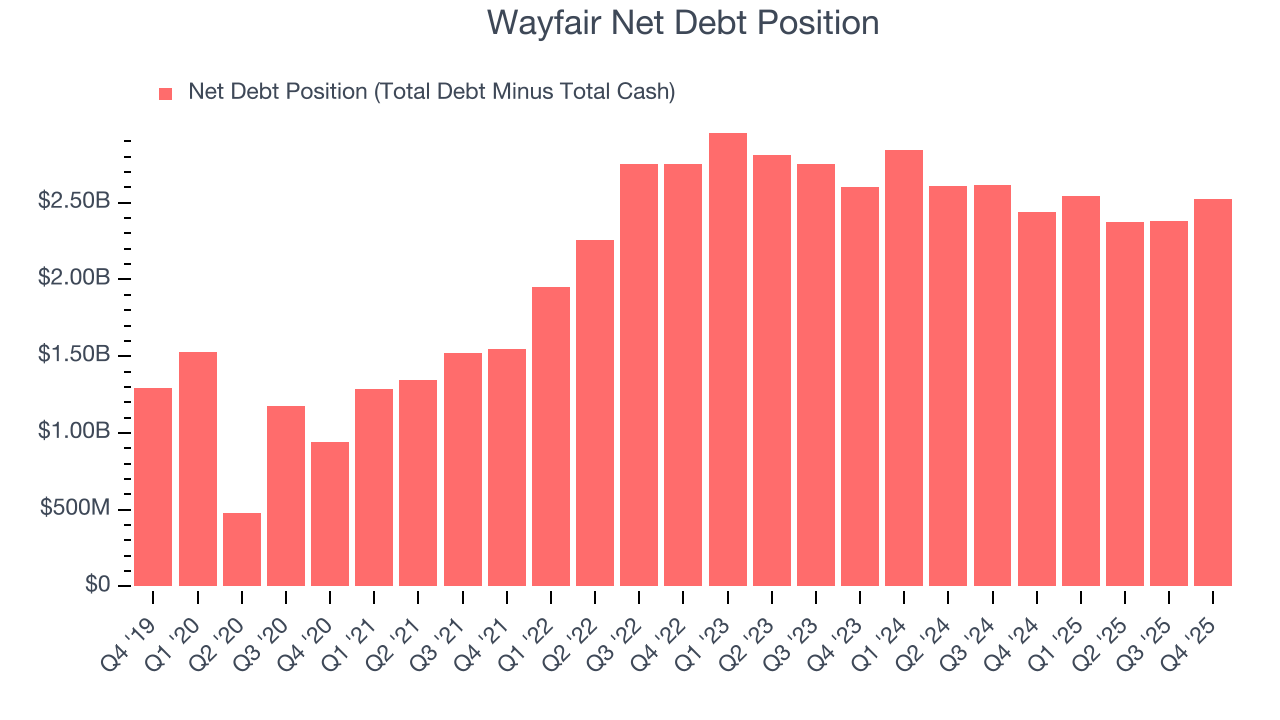
With $743 million of EBITDA over the last 12 months, we view Wayfair’s 3.4× net-debt-to-EBITDA ratio as safe. We also see its $125 million of annual interest expenses as appropriate. The company’s profits give it plenty of breathing room, allowing it to continue investing in growth initiatives.
13. Key Takeaways from Wayfair’s Q4 Results
We were impressed by how significantly Wayfair blew past analysts’ EBITDA expectations this quarter. We were also happy its revenue narrowly outperformed Wall Street’s estimates. On the other hand, its number of buyers declined. Overall, we think this was a solid quarter with some key areas of upside. The market seemed to be hoping for more, and the stock traded down 2.8% to $89.54 immediately following the results.
14. Is Now The Time To Buy Wayfair?
Updated: March 18, 2026 at 10:22 PM EDT
The latest quarterly earnings matters, sure, but we actually think longer-term fundamentals and valuation matter more. Investors should consider all these pieces before deciding whether or not to invest in Wayfair.
Wayfair isn’t a terrible business, but it doesn’t pass our quality test. For starters, its revenue was flat over the last three years. While its rising cash profitability gives it more optionality, the downside is its active buyers have declined. On top of that, its gross margins make it extremely difficult to reach positive operating profits compared to other consumer internet businesses.
Wayfair’s EV/EBITDA ratio based on the next 12 months is 15.4x. This multiple tells us a lot of good news is priced in - we think other companies feature superior fundamentals at the moment.
Wall Street analysts have a consensus one-year price target of $105.41 on the company (compared to the current share price of $77.40).
Although the price target is bullish, readers should exercise caution because analysts tend to be overly optimistic. The firms they work for, often big banks, have relationships with companies that extend into fundraising, M&A advisory, and other rewarding business lines. As a result, they typically hesitate to say bad things for fear they will lose out. We at StockStory do not suffer from such conflicts of interest, so we’ll always tell it like it is.