
Allient (ALNT)
We’re cautious of Allient. Its weak returns on capital indicate management was inefficient with its resources and missed opportunities.― StockStory Analyst Team
1. News


2. Summary
Why We Think Allient Will Underperform
Founded in 1962, Allient (NASDAQ:ALNT) develops and manufactures precision and specialty-controlled motion components and systems.
- Low returns on capital reflect management’s struggle to allocate funds effectively
- Anticipated sales growth of 5.4% for the next year implies demand will be shaky
- A silver lining is that its performance over the past five years shows its incremental sales were extremely profitable, as its annual earnings per share growth of 17.7% outpaced its revenue gains


Allient doesn’t meet our quality criteria. There are better opportunities in the market.
Why There Are Better Opportunities Than Allient


Allient’s stock price of $62.43 implies a valuation ratio of 24.4x forward P/E. This multiple is quite expensive for the quality you get.
Paying up for elite businesses with strong earnings potential is better than investing in lower-quality companies with shaky fundamentals. That’s how you avoid big downside over the long term.
3. Allient (ALNT) Research Report: Q4 CY2025 Update
Precision motion systems specialist Allient (NASDAQ:ALNT) beat Wall Street’s revenue expectations in Q4 CY2025, with sales up 17.5% year on year to $143.4 million. Its non-GAAP profit of $0.55 per share was 23.3% above analysts’ consensus estimates.
Allient (ALNT) Q4 CY2025 Highlights:
- Revenue: $143.4 million vs analyst estimates of $133.3 million (17.5% year-on-year growth, 7.5% beat)
- Adjusted EPS: $0.55 vs analyst estimates of $0.45 (23.3% beat)
- Adjusted EBITDA: $19.03 million vs analyst estimates of $16.19 million (13.3% margin, 17.5% beat)
- Operating Margin: 7.9%, up from 3.5% in the same quarter last year
- Free Cash Flow Margin: 8.1%, similar to the same quarter last year
- Backlog: $232.9 million at quarter end
- Market Capitalization: $1.08 billion
Company Overview
Founded in 1962, Allient (NASDAQ:ALNT) develops and manufactures precision and specialty-controlled motion components and systems.
Since its founding, Allient has transitioned from a products-based business to providing comprehensive systems that address complex customer needs. Specifically, the company focuses on Motion technologies (precision positioning, motors, drives), Controls technologies (controllers, encoders, input/output modules), and Power technologies (power quality filters, light-weighting solutions), with facilities located across North America, Europe, and Asia-Pacific.
The company's product range includes nano precision positioning systems, servo control systems, brushless and brush motors, gear motors, encoders, and power quality filters. Allient serves four primary markets: Industrial, Vehicle, Medical, and Aerospace & Defense.
The company has historically made acquisitions to grow its business, and some examples include Sierramotion, Airex, FPH Group, and ThinGap (all made in 2022/2023). These deals expanded its product portfolio and deepened its presence in the robotics, medical, industrial, defense, life sciences, and semiconductor industries.
4. Electronic Components
Like many equipment and component manufacturers, electronic components companies are buoyed by secular trends such as connectivity and industrial automation. More specific pockets of strong demand include data centers and telecommunications, which can benefit companies whose optical and transceiver offerings fit those markets. But like the broader industrials sector, these companies are also at the whim of economic cycles. Consumer spending, for example, can greatly impact these companies’ volumes.
Competitors of Allient Inc. (NASDAQ: ALNT) include Altra Industrial Motion Corp. (NASDAQ: AIMC), Regal Rexnord Corporation (NYSE: RRX), and Ametek Inc. (NYSE: AME).
5. Revenue Growth
A company’s long-term sales performance is one signal of its overall quality. Any business can put up a good quarter or two, but many enduring ones grow for years. Over the last five years, Allient grew its sales at a decent 8.6% compounded annual growth rate. Its growth was slightly above the average industrials company and shows its offerings resonate with customers.
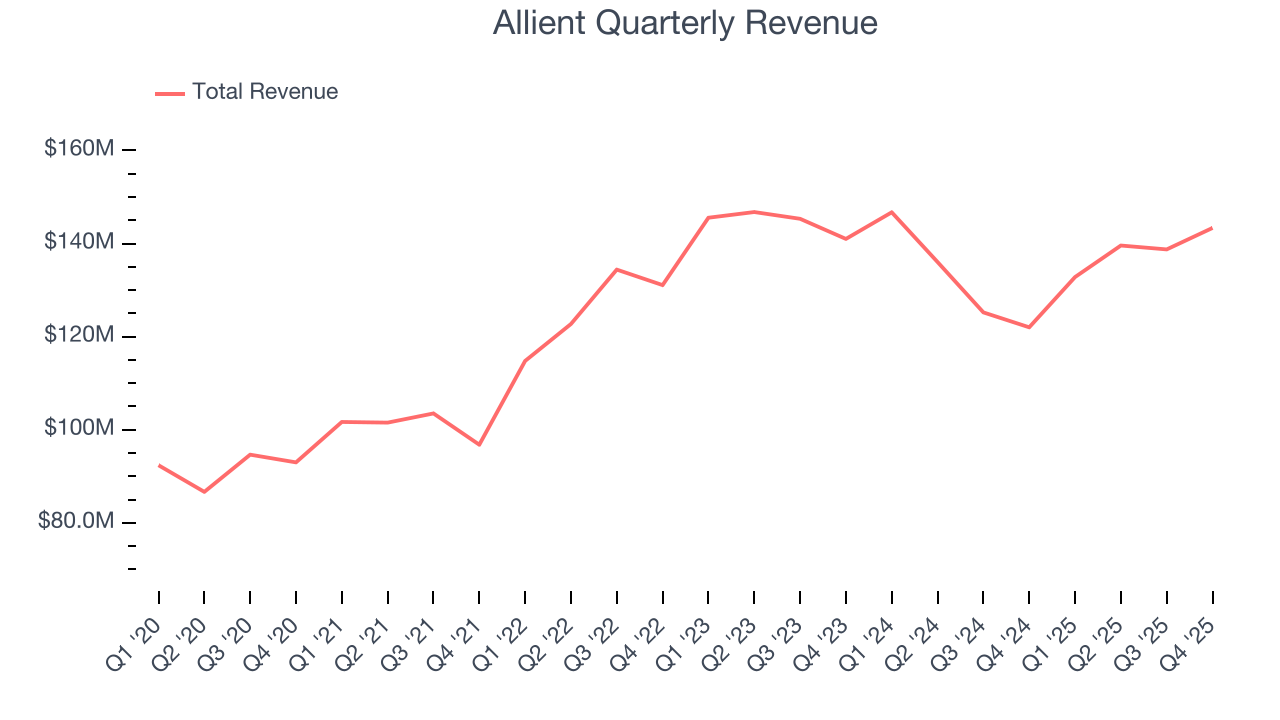
Long-term growth is the most important, but within industrials, a half-decade historical view may miss new industry trends or demand cycles. Allient’s recent performance marks a sharp pivot from its five-year trend as its revenue has shown annualized declines of 2.1% over the last two years. 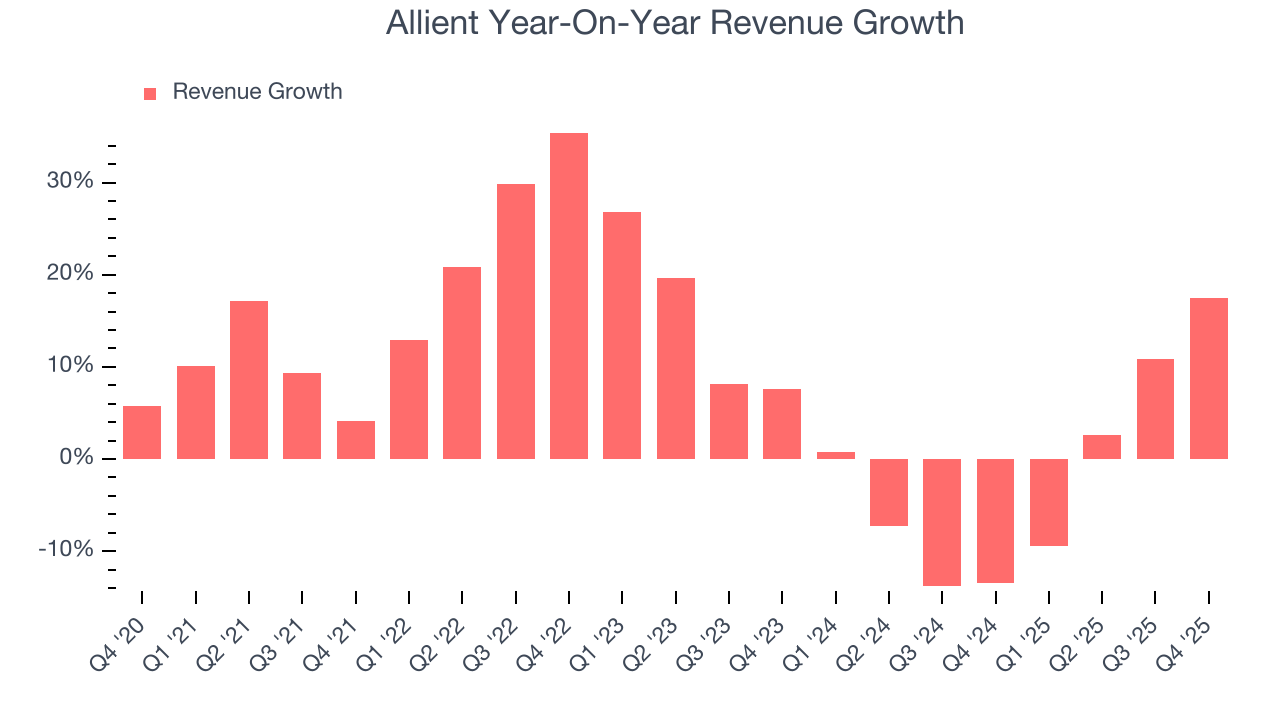
This quarter, Allient reported year-on-year revenue growth of 17.5%, and its $143.4 million of revenue exceeded Wall Street’s estimates by 7.5%.
Looking ahead, sell-side analysts expect revenue to grow 3.4% over the next 12 months. While this projection implies its newer products and services will catalyze better top-line performance, it is still below average for the sector.
6. Gross Margin & Pricing Power
Allient’s unit economics are better than the typical industrials business, signaling its products are somewhat differentiated through quality or brand.As you can see below, it averaged a decent 31.5% gross margin over the last five years. Said differently, Allient paid its suppliers $68.50 for every $100 in revenue. 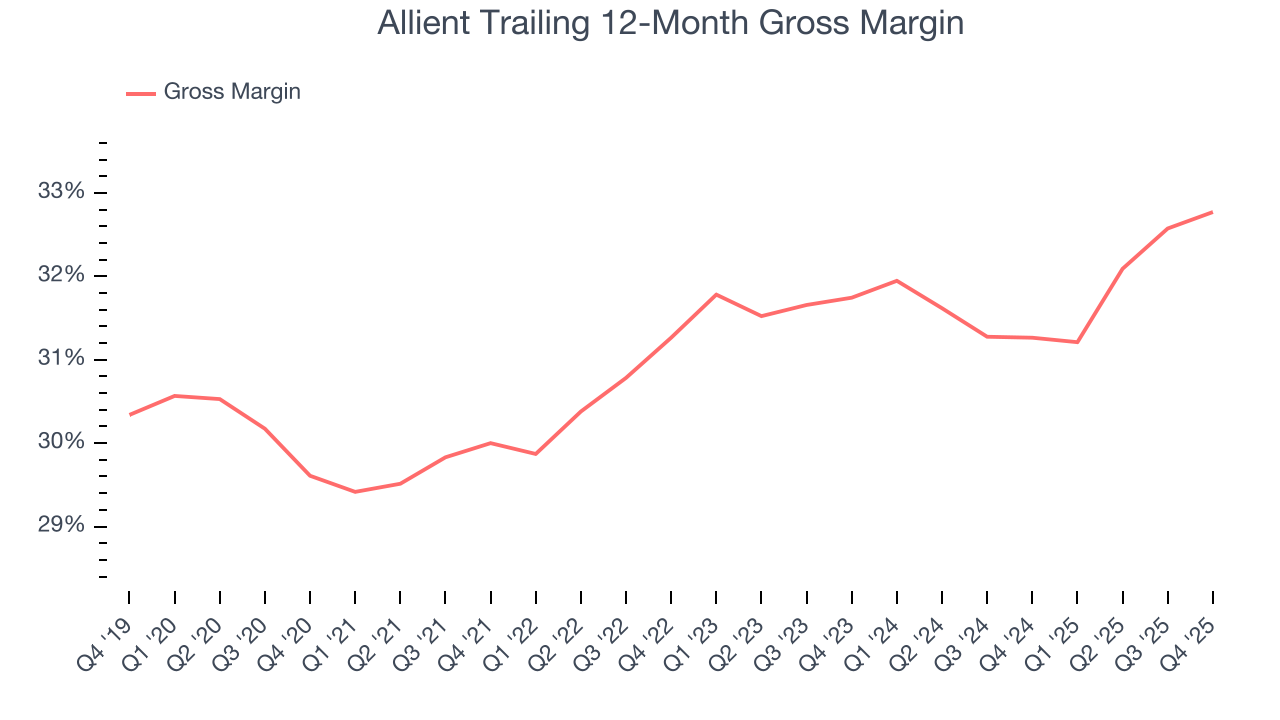
This quarter, Allient’s gross profit margin was 32.4%, in line with the same quarter last year. On a wider time horizon, Allient’s full-year margin has been trending up over the past 12 months, increasing by 1.5 percentage points. If this move continues, it could suggest better unit economics due to more leverage from its growing sales on the fixed portion of its cost of goods sold (such as manufacturing expenses).
7. Operating Margin
Allient was profitable over the last five years but held back by its large cost base. Its average operating margin of 7% was weak for an industrials business.
On the plus side, Allient’s operating margin rose by 1.7 percentage points over the last five years, as its sales growth gave it operating leverage.
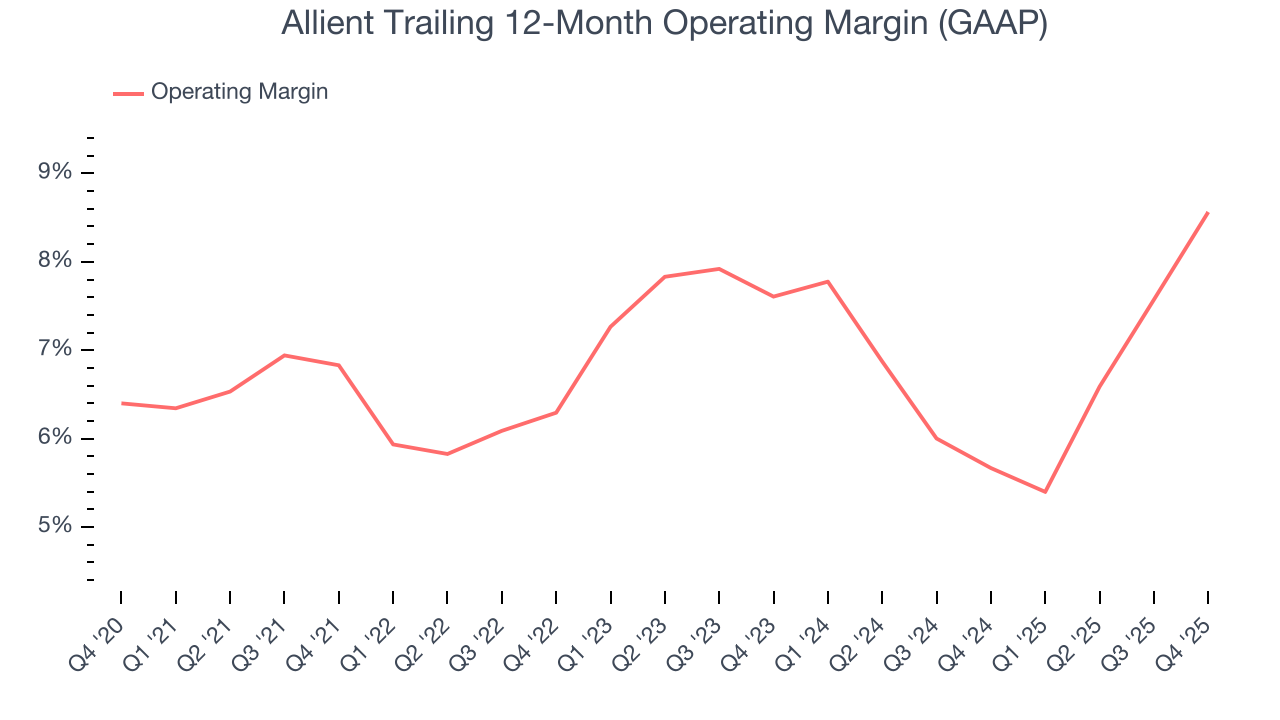
In Q4, Allient generated an operating margin profit margin of 7.9%, up 4.4 percentage points year on year. The increase was encouraging, and because its operating margin rose more than its gross margin, we can infer it was more efficient with expenses such as marketing, R&D, and administrative overhead.
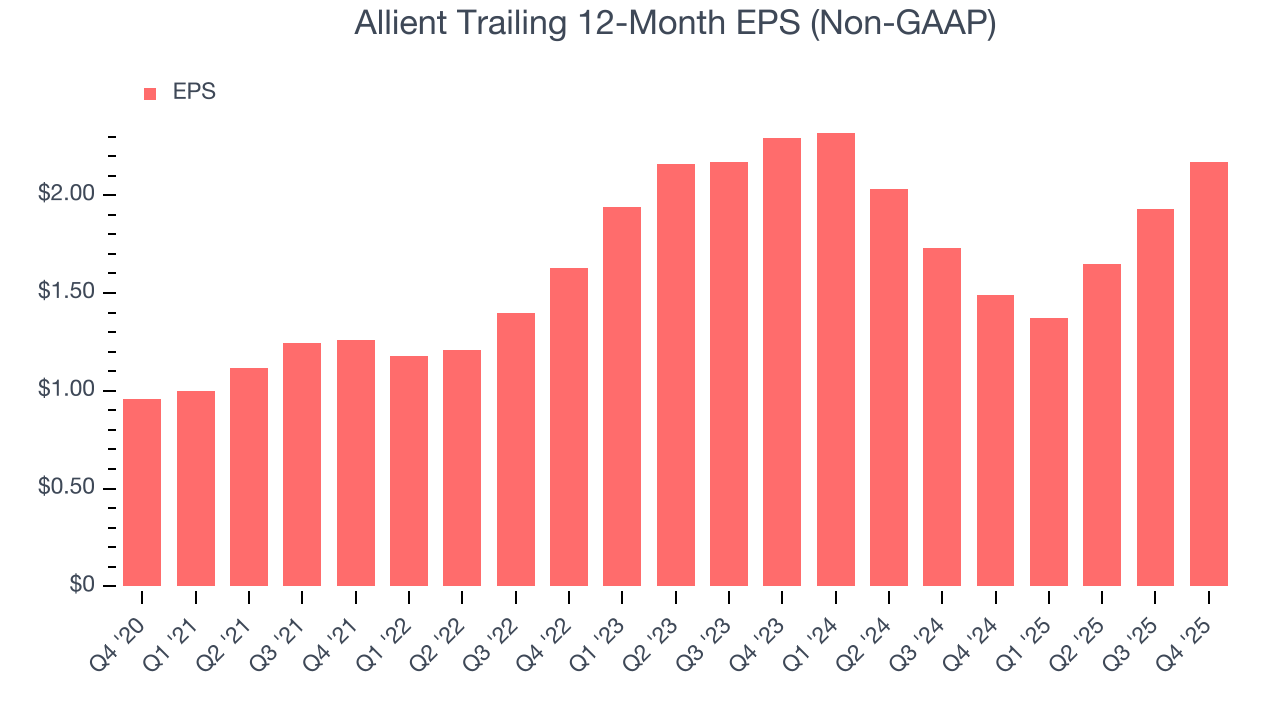
8. Earnings Per Share
Revenue trends explain a company’s historical growth, but the long-term change in earnings per share (EPS) points to the profitability of that growth – for example, a company could inflate its sales through excessive spending on advertising and promotions.
Allient’s EPS grew at 17.7% compounded annual growth rate over the last five years, higher than its 8.6% annualized revenue growth. This tells us the company became more profitable on a per-share basis as it expanded.
Diving into Allient’s quality of earnings can give us a better understanding of its performance. As we mentioned earlier, Allient’s operating margin expanded by 1.7 percentage points over the last five years. This was the most relevant factor (aside from the revenue impact) behind its higher earnings; interest expenses and taxes can also affect EPS but don’t tell us as much about a company’s fundamentals.
Like with revenue, we analyze EPS over a more recent period because it can provide insight into an emerging theme or development for the business.
For Allient, its two-year annual EPS declines of 2.7% mark a reversal from its (seemingly) healthy five-year trend. We hope Allient can return to earnings growth in the future.
In Q4, Allient reported adjusted EPS of $0.55, up from $0.31 in the same quarter last year. This print easily cleared analysts’ estimates, and shareholders should be content with the results. Over the next 12 months, Wall Street expects Allient’s full-year EPS of $2.17 to grow 17.1%.
9. Cash Is King
Although earnings are undoubtedly valuable for assessing company performance, we believe cash is king because you can’t use accounting profits to pay the bills.
Allient has shown weak cash profitability relative to peers over the last five years, giving the company fewer opportunities to return capital to shareholders. Its free cash flow margin averaged 4.5%, below what we’d expect for an industrials business.
Taking a step back, an encouraging sign is that Allient’s margin expanded by 6.1 percentage points during that time. The company’s improvement shows it’s heading in the right direction, and we can see it became a less capital-intensive business because its free cash flow profitability rose more than its operating profitability.
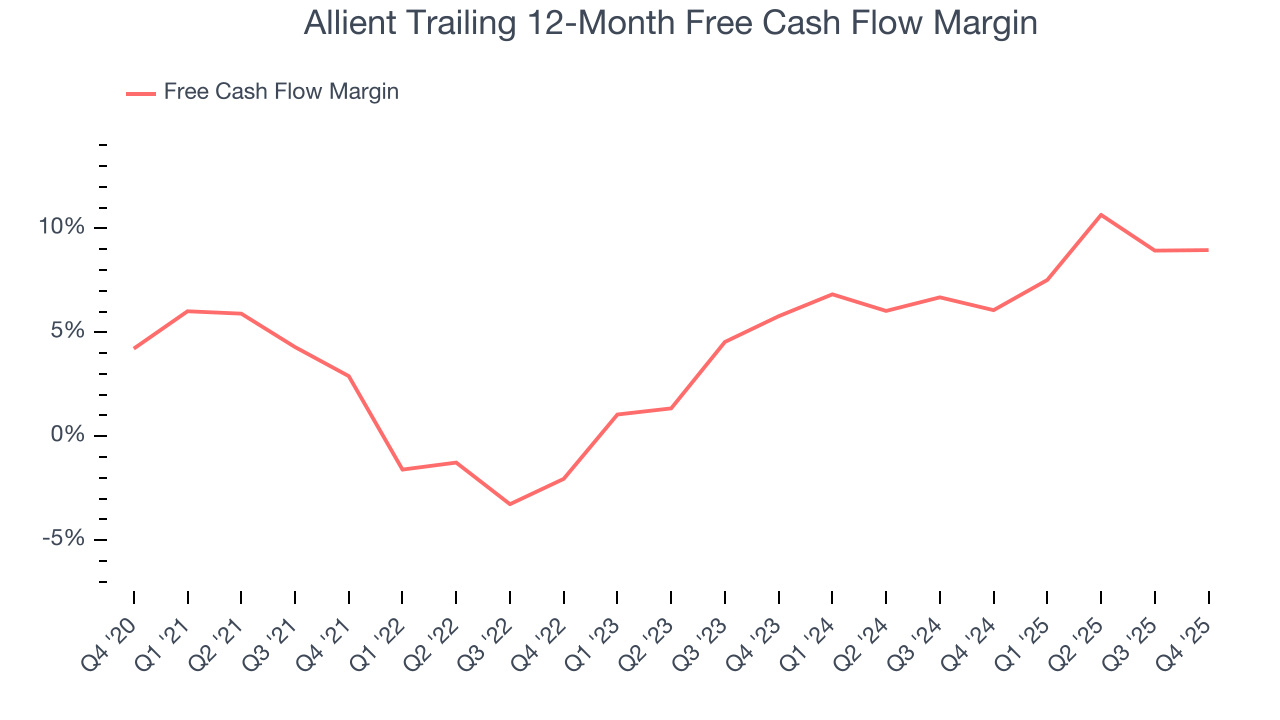
Allient’s free cash flow clocked in at $11.66 million in Q4, equivalent to a 8.1% margin. This cash profitability was in line with the comparable period last year and above its five-year average.
10. Return on Invested Capital (ROIC)
EPS and free cash flow tell us whether a company was profitable while growing its revenue. But was it capital-efficient? Enter ROIC, a metric showing how much operating profit a company generates relative to the money it has raised (debt and equity).
Allient historically did a mediocre job investing in profitable growth initiatives. Its five-year average ROIC was 8.3%, somewhat low compared to the best industrials companies that consistently pump out 20%+.
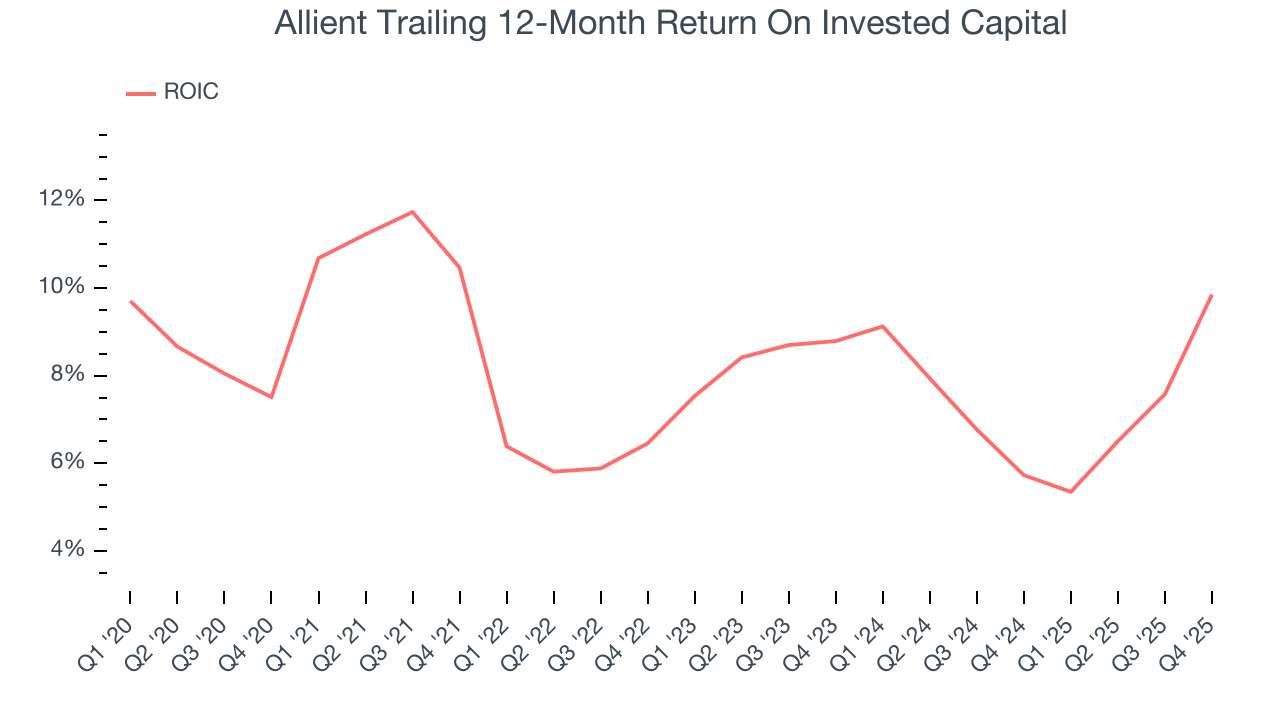
We like to invest in businesses with high returns, but the trend in a company’s ROIC is what often surprises the market and moves the stock price. Unfortunately, Allient’s ROIC has stayed the same over the last few years. If the company wants to become an investable business, it must improve its returns by generating more profitable growth.
11. Balance Sheet Assessment
Allient reported $40.71 million of cash and $196.8 million of debt on its balance sheet in the most recent quarter. As investors in high-quality companies, we primarily focus on two things: 1) that a company’s debt level isn’t too high and 2) that its interest payments are not excessively burdening the business.
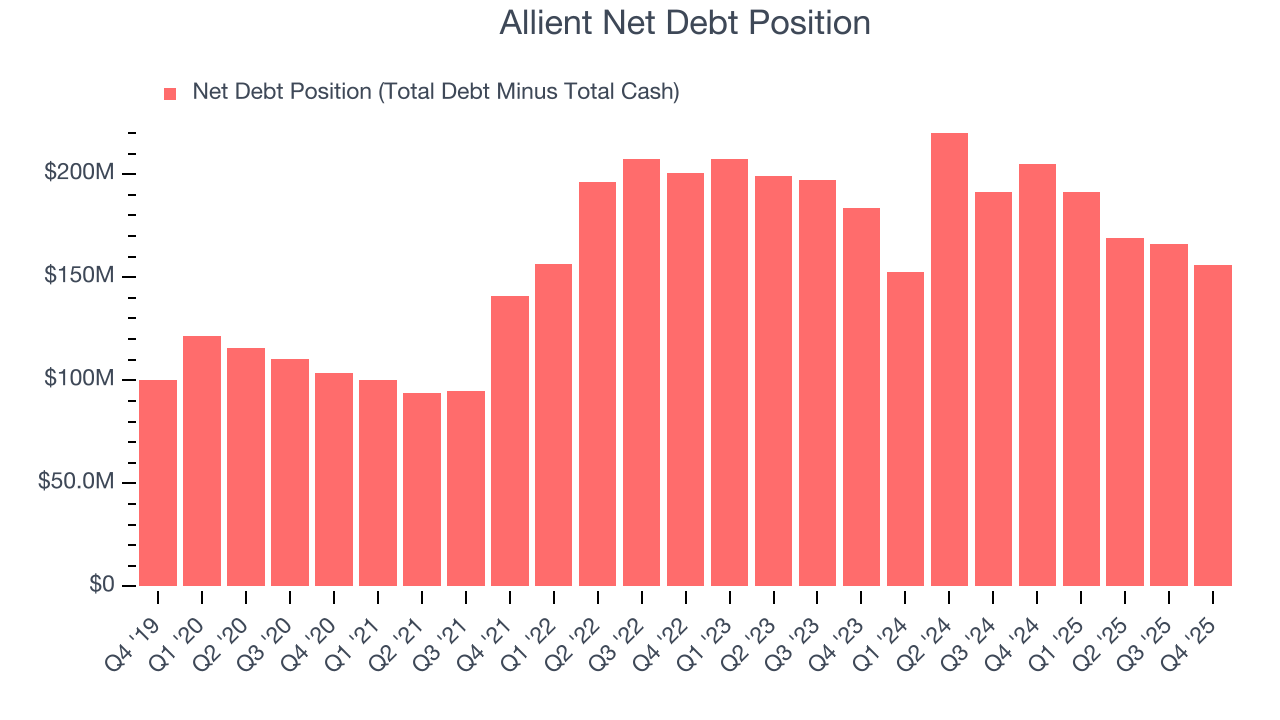
With $76.87 million of EBITDA over the last 12 months, we view Allient’s 2.0× net-debt-to-EBITDA ratio as safe. We also see its $8.00 million of annual interest expenses as appropriate. The company’s profits give it plenty of breathing room, allowing it to continue investing in growth initiatives.
12. Key Takeaways from Allient’s Q4 Results
We were impressed by how significantly Allient blew past analysts’ EBITDA expectations this quarter. We were also excited its revenue outperformed Wall Street’s estimates by a wide margin. Zooming out, we think this was a solid print. The stock remained flat at $62.19 immediately after reporting.
13. Is Now The Time To Buy Allient?
Updated: March 16, 2026 at 10:17 PM EDT
Before investing in or passing on Allient, we urge you to understand the company’s business quality (or lack thereof), valuation, and the latest quarterly results - in that order.
Allient isn’t a terrible business, but it doesn’t pass our quality test. Although its revenue growth was good over the last five years, it’s expected to deteriorate over the next 12 months and its mediocre ROIC lags the market and is a headwind for its stock price. And while the company’s rising cash profitability gives it more optionality, the downside is its low free cash flow margins give it little breathing room.
Allient’s P/E ratio based on the next 12 months is 23.8x. Investors with a higher risk tolerance might like the company, but we think the potential downside is too great. We're pretty confident there are more exciting stocks to buy at the moment.
Wall Street analysts have a consensus one-year price target of $66.60 on the company (compared to the current share price of $64.45).