
Array (ARRY)
We wouldn’t recommend Array. Its poor sales growth shows demand is soft and its negative returns on capital suggest it destroyed value.― StockStory Analyst Team
1. News


2. Summary
Why We Think Array Will Underperform
Going public in October 2020, Array (NASDAQ:ARRY) is a global manufacturer of ground-mounting tracking systems for utility and distributed generation solar energy projects.
- Customers postponed purchases of its products and services this cycle as its revenue declined by 9.7% annually over the last two years
- Earnings per share have contracted by 23.3% annually over the last two years, a headwind for returns as stock prices often echo long-term EPS performance
- Poor expense management has led to operating margin losses


Array falls short of our quality standards. There’s a wealth of better opportunities.
Why There Are Better Opportunities Than Array


Array is trading at $6.87 per share, or 9.9x forward P/E. This sure is a cheap multiple, but you get what you pay for.
We’d rather pay up for companies with elite fundamentals than get a bargain on weak ones. Cheap stocks can be value traps, and as their performance deteriorates, they will stay cheap or get even cheaper.
3. Array (ARRY) Research Report: Q4 CY2025 Update
Solar tracking systems manufacturer Array (NASDAQ:ARRY) beat Wall Street’s revenue expectations in Q4 CY2025, but sales fell by 17.9% year on year to $226 million. The company expects the full year’s revenue to be around $1.45 billion, close to analysts’ estimates. Its non-GAAP profit of $0.01 per share was in line with analysts’ consensus estimates.
Array (ARRY) Q4 CY2025 Highlights:
- Revenue: $226 million vs analyst estimates of $213 million (17.9% year-on-year decline, 6.1% beat)
- Adjusted EPS: $0.01 vs analyst estimates of $0 (in line)
- Adjusted EBITDA: $11.24 million vs analyst estimates of $15.81 million (5% margin, 28.9% miss)
- Adjusted EPS guidance for the upcoming financial year 2026 is $0.70 at the midpoint, missing analyst estimates by 20.8%
- EBITDA guidance for the upcoming financial year 2026 is $215 million at the midpoint, below analyst estimates of $256.4 million
- Operating Margin: -65.5%, down from -51.7% in the same quarter last year
- Free Cash Flow Margin: 16%, down from 20.3% in the same quarter last year
- Market Capitalization: $1.64 billion
Company Overview
Going public in October 2020, Array (NASDAQ:ARRY) is a global manufacturer of ground-mounting tracking systems for utility and distributed generation solar energy projects.
The company specializes in single-axis solar trackers, which move solar panels throughout the day to maintain optimal orientation to the sun, increasing energy production compared to fixed-tilt mounting systems. Array has established itself as a significant player in the solar energy infrastructure market, with a reported shipment of more than 73 gigawatts of trackers to customers worldwide as of December 31, 2023.
Its product portfolio includes three main tracker systems: DuraTrack, Array STI, and Array OmniTrack. The DuraTrack is Array's flagship product and features a patented single-bolt per module mounting system and a passive wind load mitigation system. The Array STI, added through the acquisition of Soluciones Técnicas Integrales Norland ("STI") in January 2022, is a dual-row tracker system designed for sites with irregular boundaries or fragmented project areas. The Array OmniTrack, introduced in September 2022, is designed to accommodate uneven terrain and requires less grading and civil work.
Array also offers SmarTrack software, which uses historical weather and energy production data along with machine learning algorithms to optimize solar array positioning in real time. The company provides additional services including field services and customer training programs to support installation and operation efficiency. It operates manufacturing facilities in Albuquerque, New Mexico, as well as in Spain and Brazil (632,000 square feet) acquired through the STI acquisition.
4. Renewable Energy
Renewable energy companies are buoyed by the secular trend of green energy that is upending traditional power generation. Those who innovate and evolve with this dynamic market can win share while those who continue to rely on legacy technologies can see diminishing demand, which includes headwinds from increasing regulation against “dirty” energy. Additionally, these companies are at the whim of economic cycles, as interest rates can impact the willingness to invest in renewable energy projects.
Competitors in the solar industry include First Solar (NASDAQ:FSLR), SunPower Corporation (NASDAQ:SPWR), and SolarEdge Technologies (NASDAQ:SEDG).
5. Revenue Growth
A company’s long-term sales performance is one signal of its overall quality. Any business can put up a good quarter or two, but the best consistently grow over the long haul. Thankfully, Array’s 8% annualized revenue growth over the last five years was decent. Its growth was slightly above the average industrials company and shows its offerings resonate with customers.
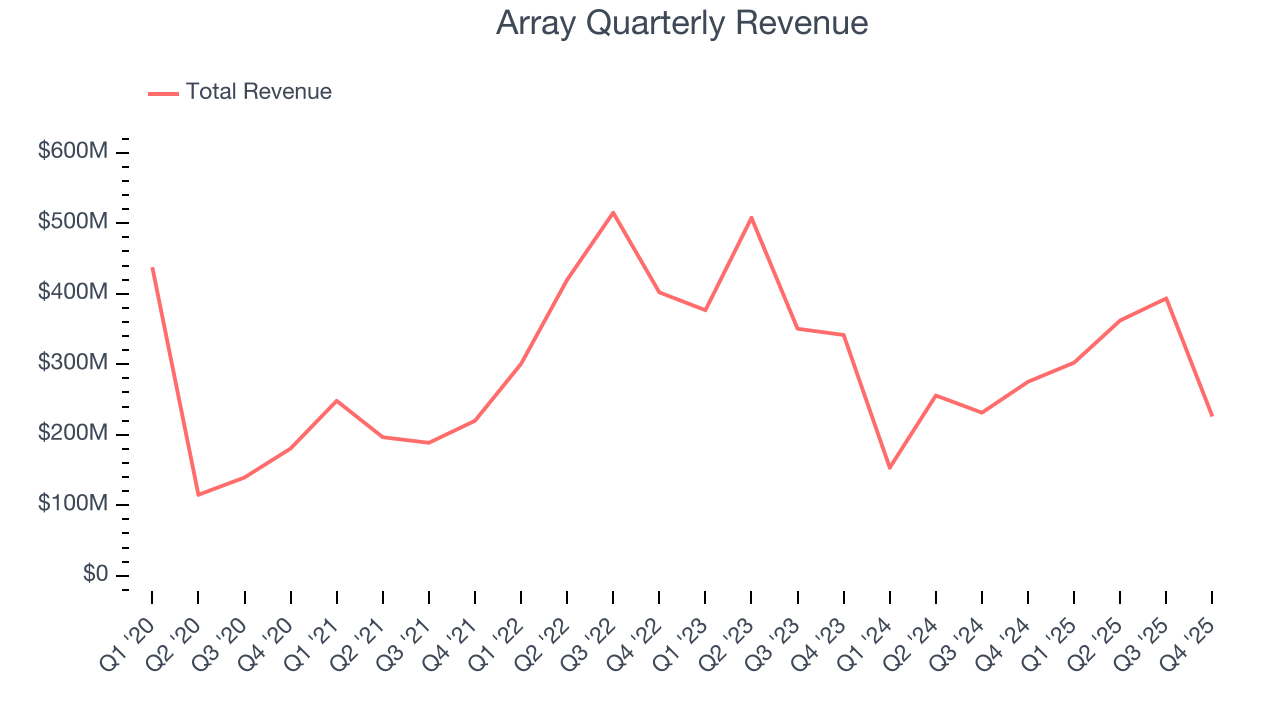
We at StockStory place the most emphasis on long-term growth, but within industrials, a half-decade historical view may miss cycles, industry trends, or a company capitalizing on catalysts such as a new contract win or a successful product line. Array’s recent performance marks a sharp pivot from its five-year trend as its revenue has shown annualized declines of 9.7% over the last two years. 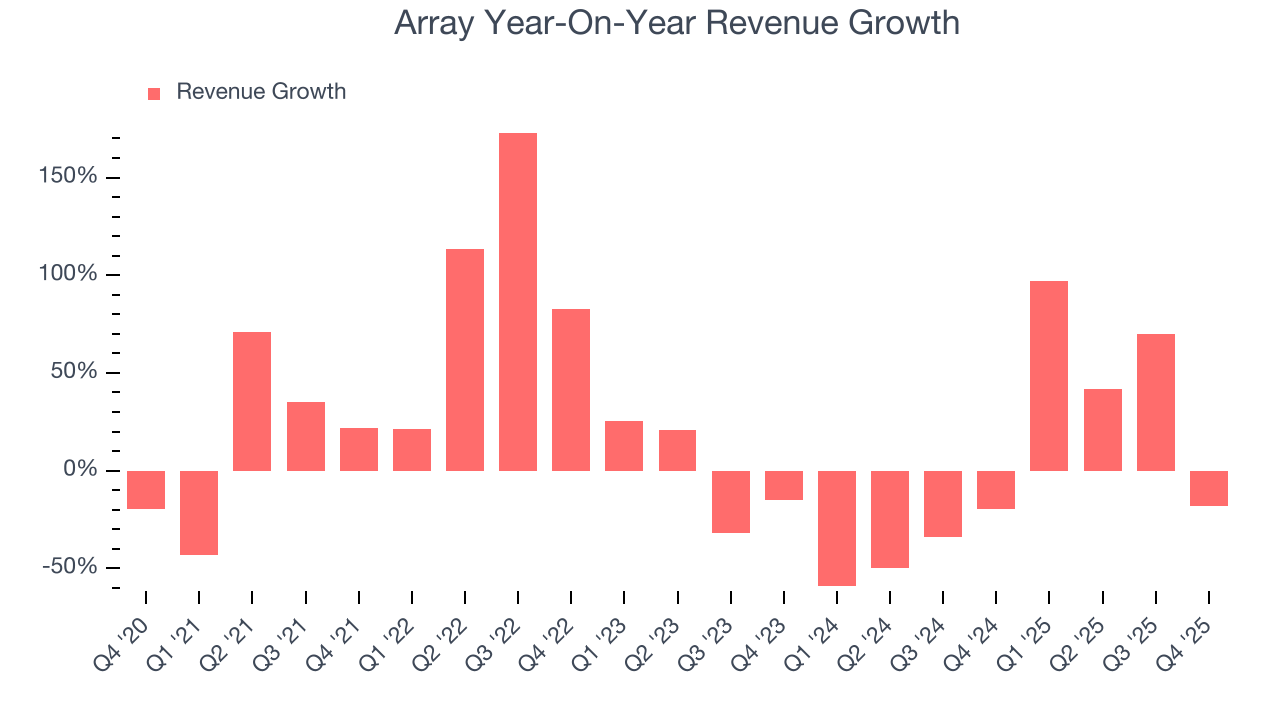
This quarter, Array’s revenue fell by 17.9% year on year to $226 million but beat Wall Street’s estimates by 6.1%.
Looking ahead, sell-side analysts expect revenue to grow 13.2% over the next 12 months, an improvement versus the last two years. This projection is noteworthy and indicates its newer products and services will spur better top-line performance.
6. Gross Margin & Pricing Power
For industrials businesses, cost of sales is usually comprised of the direct labor, raw materials, and supplies needed to offer a product or service. These costs can be impacted by inflation and supply chain dynamics in the short term and a company’s purchasing power and scale over the long term.
Array has bad unit economics for an industrials business, signaling it operates in a competitive market. As you can see below, it averaged a 20.9% gross margin over the last five years. That means Array paid its suppliers a lot of money ($79.09 for every $100 in revenue) to run its business. 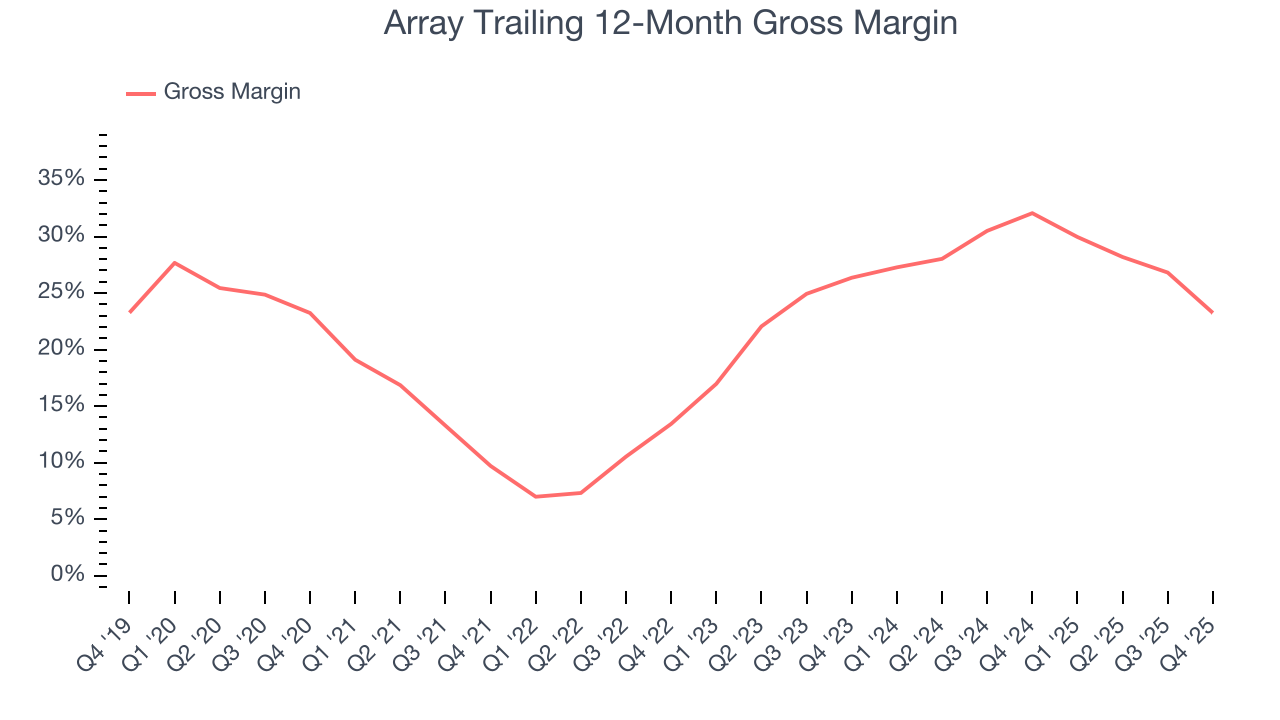
In Q4, Array produced a 8.6% gross profit margin, down 19.9 percentage points year on year. Array’s full-year margin has also been trending down over the past 12 months, decreasing by 8.8 percentage points. If this move continues, it could suggest deteriorating pricing power and higher input costs (such as raw materials and manufacturing expenses).
7. Operating Margin
Array’s operating margin has been trending up over the last 12 months, but it still averaged negative 1% over the last five years. This is due to its large expense base and inefficient cost structure.
Analyzing the trend in its profitability, Array’s operating margin might fluctuated slightly but has generally stayed the same over the last five years. This raises questions about the company’s expense base because its revenue growth should have given it leverage on its fixed costs, resulting in better economies of scale and profitability.
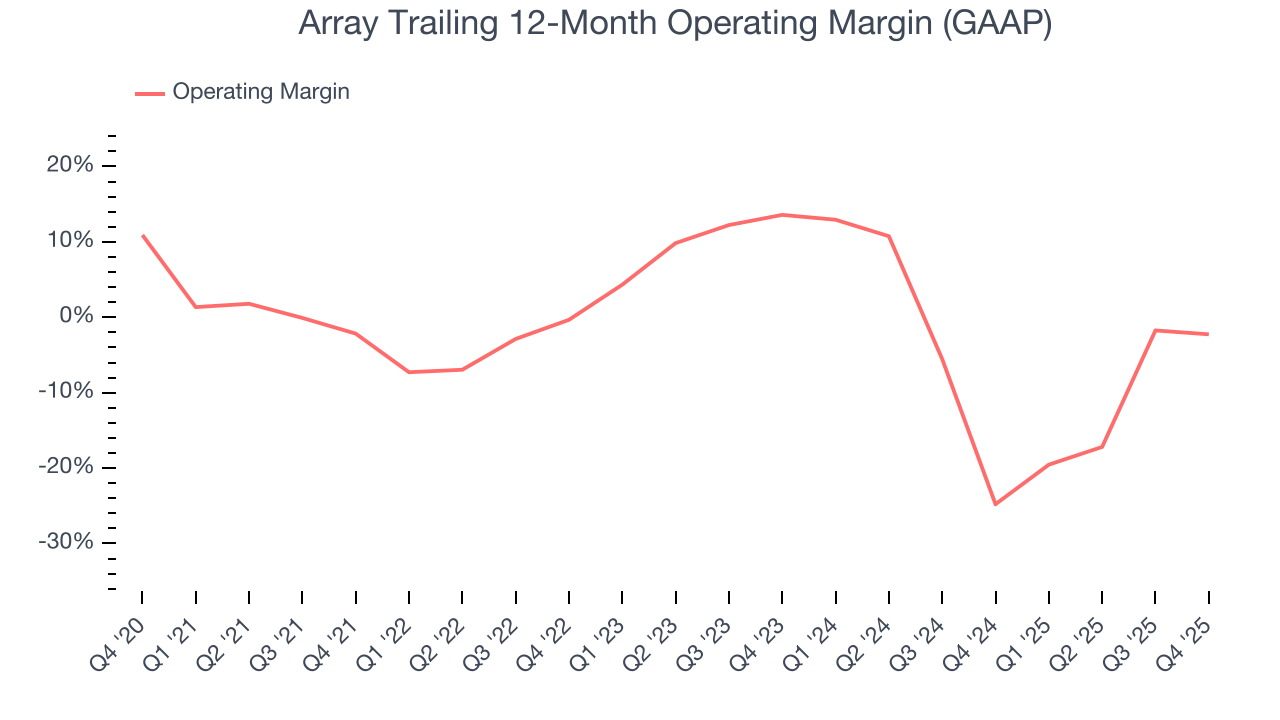
This quarter, Array generated a negative 65.5% operating margin.
8. Earnings Per Share
Revenue trends explain a company’s historical growth, but the long-term change in earnings per share (EPS) points to the profitability of that growth – for example, a company could inflate its sales through excessive spending on advertising and promotions.
Array’s full-year EPS grew at an astounding 51.8% compounded annual growth rate over the last four years, better than the broader industrials sector.
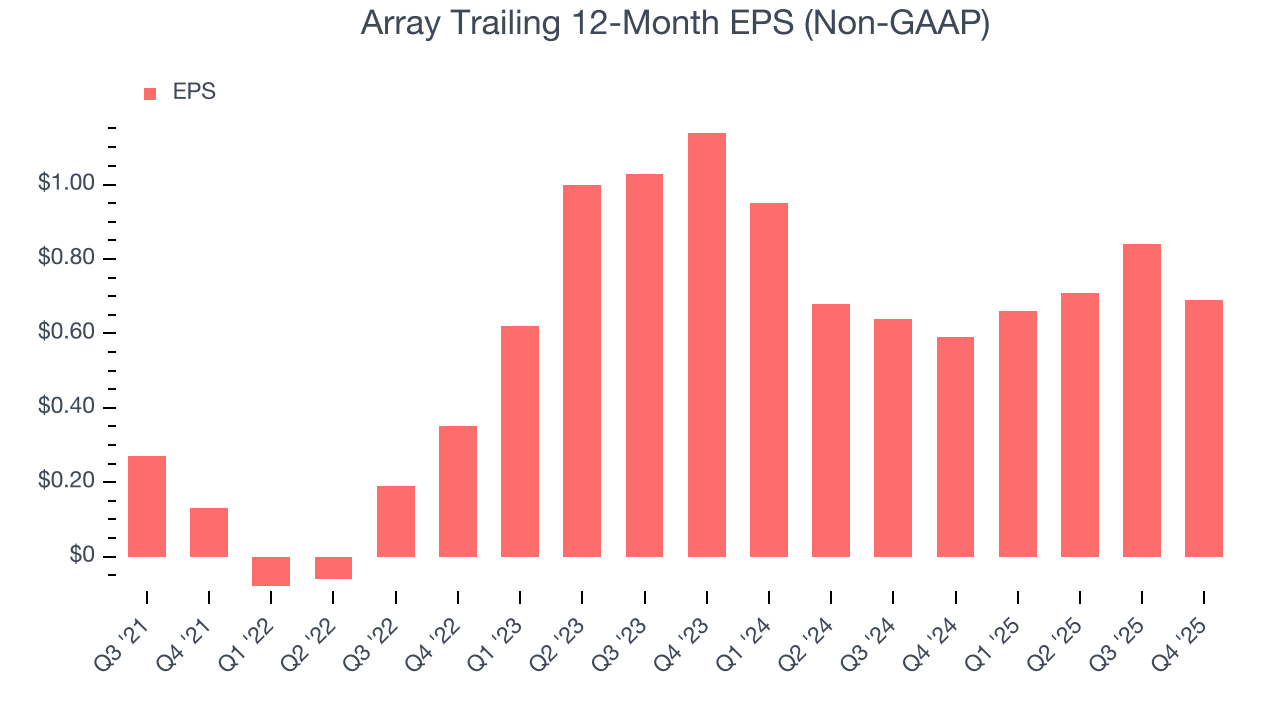
Like with revenue, we analyze EPS over a shorter period to see if we are missing a change in the business.
Sadly for Array, its EPS declined by more than its revenue over the last two years, dropping 22.2%. This tells us the company struggled to adjust to shrinking demand.
Diving into the nuances of Array’s earnings can give us a better understanding of its performance. Array’s operating margin has declined over the last two years. This was the most relevant factor (aside from the revenue impact) behind its lower earnings; interest expenses and taxes can also affect EPS but don’t tell us as much about a company’s fundamentals.
In Q4, Array reported adjusted EPS of $0.01, down from $0.16 in the same quarter last year. Despite falling year on year, this print easily cleared analysts’ estimates. Over the next 12 months, Wall Street expects Array’s full-year EPS of $0.69 to grow 27.5%.
9. Cash Is King
Although earnings are undoubtedly valuable for assessing company performance, we believe cash is king because you can’t use accounting profits to pay the bills.
Array has shown weak cash profitability over the last five years, giving the company limited opportunities to return capital to shareholders. Its free cash flow margin averaged 4.8%, subpar for an industrials business.
Taking a step back, an encouraging sign is that Array’s margin expanded by 37.4 percentage points during that time. The company’s improvement shows it’s heading in the right direction, and we can see it became a less capital-intensive business because its free cash flow profitability rose while its operating profitability was flat.
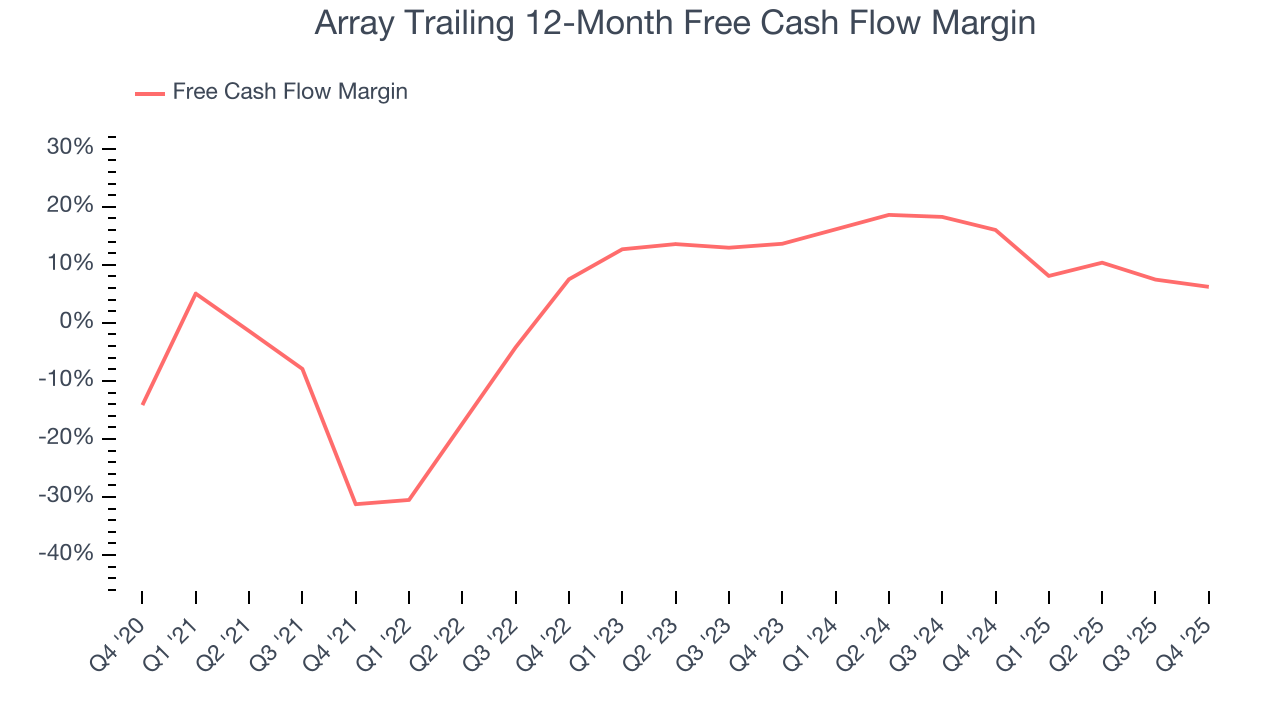
Array’s free cash flow clocked in at $36.16 million in Q4, equivalent to a 16% margin. The company’s cash profitability regressed as it was 4.3 percentage points lower than in the same quarter last year, but it’s still above its five-year average. We wouldn’t put too much weight on this quarter’s decline because capital expenditures can be seasonal and companies often stockpile inventory in anticipation of higher demand, causing short-term swings. Long-term trends carry greater meaning.
10. Return on Invested Capital (ROIC)
EPS and free cash flow tell us whether a company was profitable while growing its revenue. But was it capital-efficient? A company’s ROIC explains this by showing how much operating profit it makes compared to the money it has raised (debt and equity).
Array’s five-year average ROIC was negative 9.6%, meaning management lost money while trying to expand the business. Its returns were among the worst in the industrials sector.
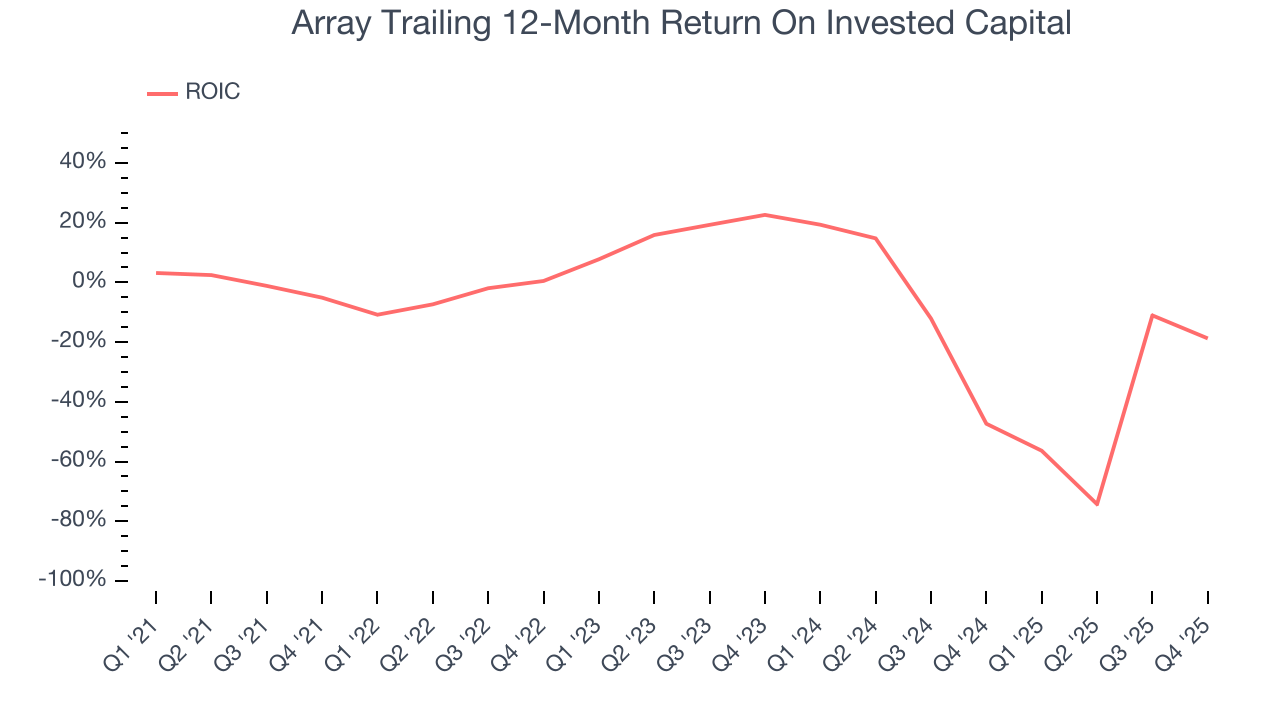
We like to invest in businesses with high returns, but the trend in a company’s ROIC is what often surprises the market and moves the stock price. Over the last few years, Array’s ROIC has unfortunately decreased significantly. Paired with its already low returns, these declines suggest its profitable growth opportunities are few and far between.
11. Balance Sheet Assessment
Array reported $246 million of cash and $669 million of debt on its balance sheet in the most recent quarter. As investors in high-quality companies, we primarily focus on two things: 1) that a company’s debt level isn’t too high and 2) that its interest payments are not excessively burdening the business.
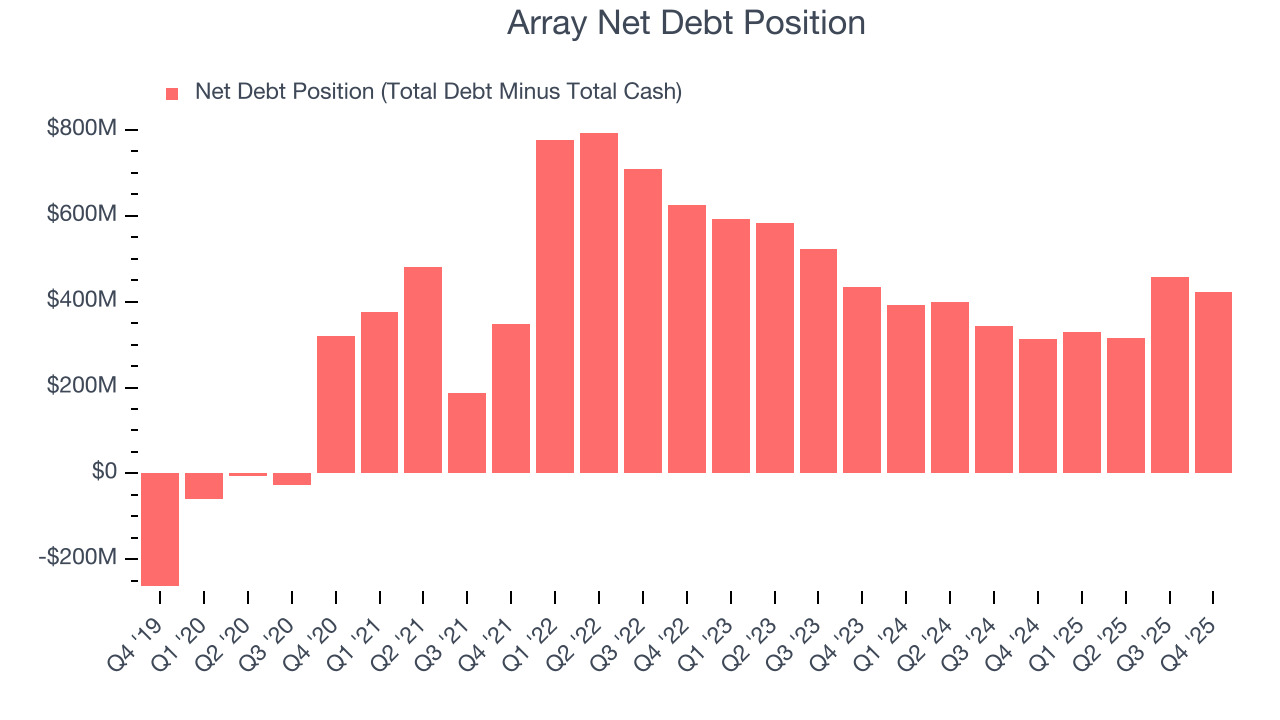
With $114.2 million of EBITDA over the last 12 months, we view Array’s 3.7× net-debt-to-EBITDA ratio as safe. We also see its $8.03 million of annual interest expenses as appropriate. The company’s profits give it plenty of breathing room, allowing it to continue investing in growth initiatives.
12. Key Takeaways from Array’s Q4 Results
It was encouraging to see Array meet analysts’ EPS expectations this quarter. We were also excited its revenue outperformed Wall Street’s estimates by a wide margin. On the other hand, its full-year EBITDA guidance missed and its EBITDA fell short of Wall Street’s estimates. Overall, this was a softer quarter. The stock traded down 23.3% to $8.46 immediately after reporting.
13. Is Now The Time To Buy Array?
Updated: March 18, 2026 at 11:32 PM EDT
Before investing in or passing on Array, we urge you to understand the company’s business quality (or lack thereof), valuation, and the latest quarterly results - in that order.
We see the value of companies helping their customers, but in the case of Array, we’re out. Although its revenue growth was decent over the last five years and is expected to accelerate over the next 12 months, its diminishing returns show management's prior bets haven't worked out. And while the company’s rising cash profitability gives it more optionality, the downside is its relatively low ROIC suggests management has struggled to find compelling investment opportunities.
Array’s P/E ratio based on the next 12 months is 9.9x. While this valuation is optically cheap, the potential downside is huge given its shaky fundamentals. There are better investments elsewhere.
Wall Street analysts have a consensus one-year price target of $10.07 on the company (compared to the current share price of $6.87).
Although the price target is bullish, readers should exercise caution because analysts tend to be overly optimistic. The firms they work for, often big banks, have relationships with companies that extend into fundraising, M&A advisory, and other rewarding business lines. As a result, they typically hesitate to say bad things for fear they will lose out. We at StockStory do not suffer from such conflicts of interest, so we’ll always tell it like it is.