
Amtech (ASYS)
Amtech keeps us up at night. Its poor sales growth shows demand is soft and its negative returns on capital suggest it destroyed value.― StockStory Analyst Team
1. News


2. Summary
Why We Think Amtech Will Underperform
Focusing on the silicon carbide and power semiconductor sectors, Amtech Systems (NASDAQ:ASYS) produces the machinery and related chemicals needed for manufacturing semiconductors.
- Annual sales declines of 20.4% for the past two years show its products and services struggled to connect with the market during this cycle
- Push for growth has led to negative returns on capital, signaling value destruction, and its falling returns suggest its earlier profit pools are drying up
- Low free cash flow margin gives it little breathing room, constraining its ability to self-fund growth or return capital to shareholders


Amtech is in the doghouse. There are better opportunities in the market.
Why There Are Better Opportunities Than Amtech


Amtech is trading at $12.97 per share, or 2.5x trailing 12-month price-to-sales. The market typically values companies like Amtech based on their anticipated profits for the next 12 months, but there aren’t enough published estimates to arrive at a reliable number. You should avoid this stock for now - better opportunities lie elsewhere.
We’d rather invest in companies with elite fundamentals than questionable ones with open questions and big downside risks. The durable earnings power of high-quality businesses helps us sleep well at night.
3. Amtech (ASYS) Research Report: Q4 CY2025 Update
Semiconductor production equipment provider Amtech Systems (NASDAQ:ASYS) met Wall Street’s revenue expectations in Q4 CY2025, but sales fell by 22.2% year on year to $18.97 million. The company expects next quarter’s revenue to be around $20 million, coming in 2.6% above analysts’ estimates. Its non-GAAP profit of $0.03 per share was 57.1% below analysts’ consensus estimates.
Amtech (ASYS) Q4 CY2025 Highlights:
- Revenue: $18.97 million vs analyst estimates of $19 million (22.2% year-on-year decline, in line)
- Adjusted EPS: $0.03 vs analyst expectations of $0.07 (57.1% miss)
- Adjusted EBITDA: $1.44 million vs analyst estimates of $2.5 million (7.6% margin, 42.2% miss)
- Revenue Guidance for Q1 CY2026 is $20 million at the midpoint, above analyst estimates of $19.5 million
- Operating Margin: 4.1%, up from 1.8% in the same quarter last year
- Free Cash Flow Margin: 20.2%, up from 11.2% in the same quarter last year
- Inventory Days Outstanding: 165, up from 155 in the previous quarter
- Market Capitalization: $226.7 million
Company Overview
Focusing on the silicon carbide and power semiconductor sectors, Amtech Systems (NASDAQ:ASYS) produces the machinery and related chemicals needed for manufacturing semiconductors.
Amtech Systems was founded in 1981 by Jong S. Whang, who previously had experience in both semiconductor processing and manufacturing. The company went public in 2017.
Semiconductor manufacturing begins with a silicon wafer upon which chips are constructed through the application and manipulation of thin layers of film that act as conductors, semiconductors, or insulators. It is a complex process requiring precision tools, specific temperatures at various stages, and ideal environments. Deviations in materials, measurements, or temperatures could result in defects that cost money, time, and other resources.
Amtech's product portfolio primarily focuses on thermal systems and wafer polishing equipment. The company’s horizontal furnaces address the vital fabrication stages of diffusion, oxidation, and annealing. Diffusion is an early stage that uses heat to remove impurities from wafers, oxidation employs high temperatures to turn silicon on the wafer into silicon dioxide to produce insulation properties, and annealing involves heating wafers to change their electrical properties. Amtech's polishing products abrade wafers in a high-precision manner to ensure the flatness, parallelism, and surface finish needed for chip construction.
Companies offering competing semiconductor production equipment include Centrotherm, CVD Equipment (NASDAQ:CVV), Vitronics Soltec, and Rehm Thermal Systems.
4. Revenue Growth
Examining a company’s long-term performance can provide clues about its quality. Any business can have short-term success, but a top-tier one grows for years. Unfortunately, Amtech’s 3.3% annualized revenue growth over the last five years was mediocre. This was below our standard for the semiconductor sector and is a poor baseline for our analysis. Semiconductors are a cyclical industry, and long-term investors should be prepared for periods of high growth followed by periods of revenue contractions.
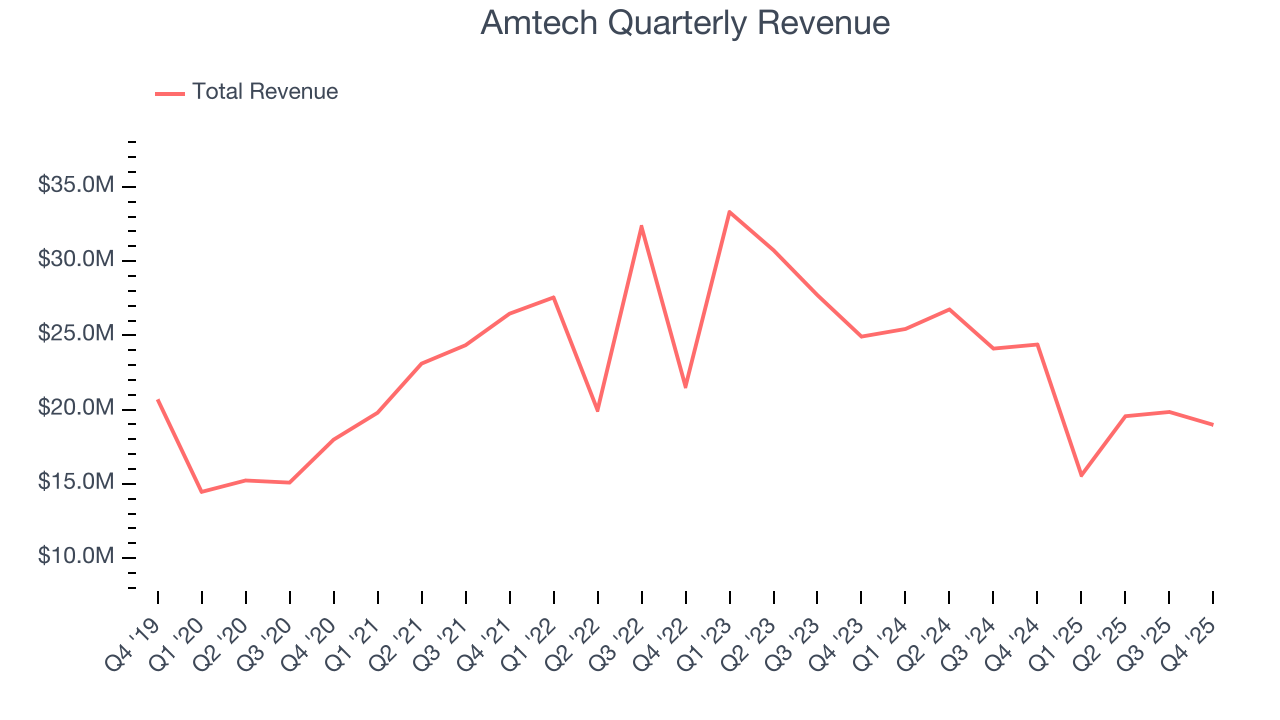
Long-term growth is the most important, but short-term results matter for semiconductors because the rapid pace of technological innovation (Moore's Law) could make yesterday's hit product obsolete today. Amtech’s performance shows it grew in the past but relinquished its gains over the last two years, as its revenue fell by 20.4% annually. 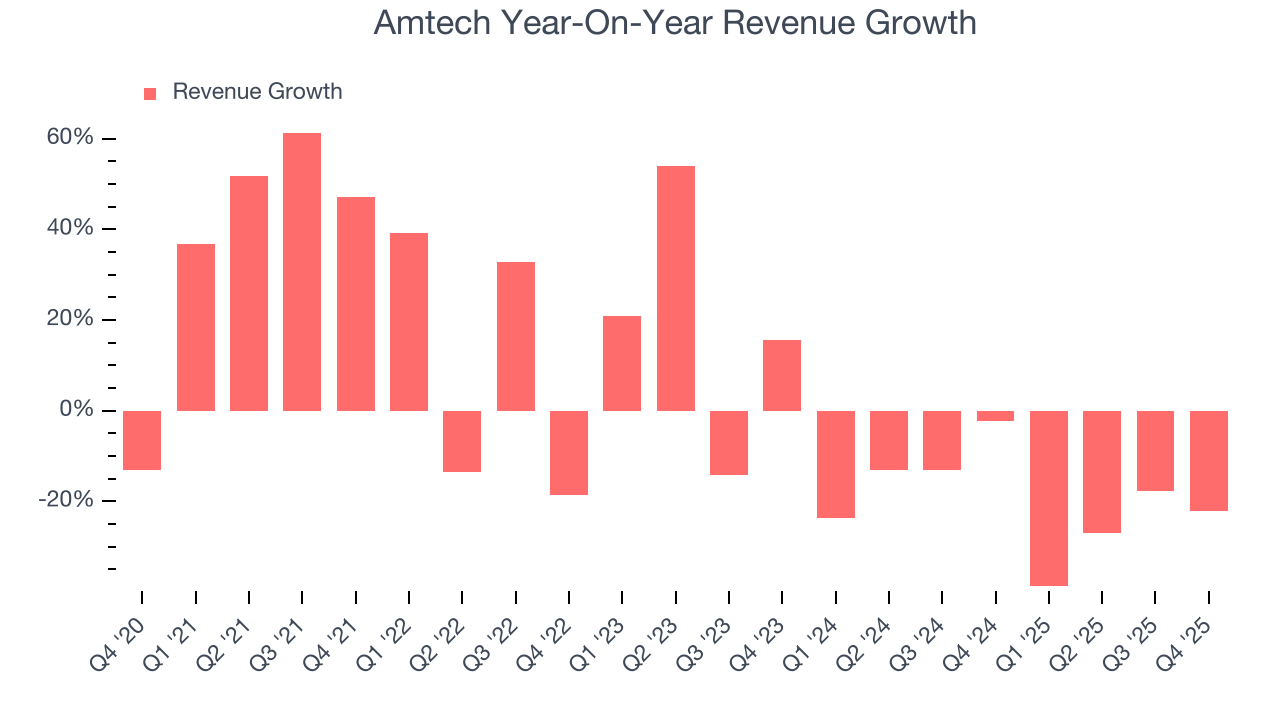
This quarter, Amtech reported a rather uninspiring 22.2% year-on-year revenue decline to $18.97 million of revenue, in line with Wall Street’s estimates. Despite meeting estimates, the drop in sales could mean that the current downcycle is deepening. Company management is currently guiding for a 28.4% year-on-year increase in sales next quarter.
Looking further ahead, sell-side analysts expect revenue to grow 11% over the next 12 months. Although this projection suggests its newer products and services will catalyze better top-line performance, it is still below average for the sector.
5. Product Demand & Outstanding Inventory
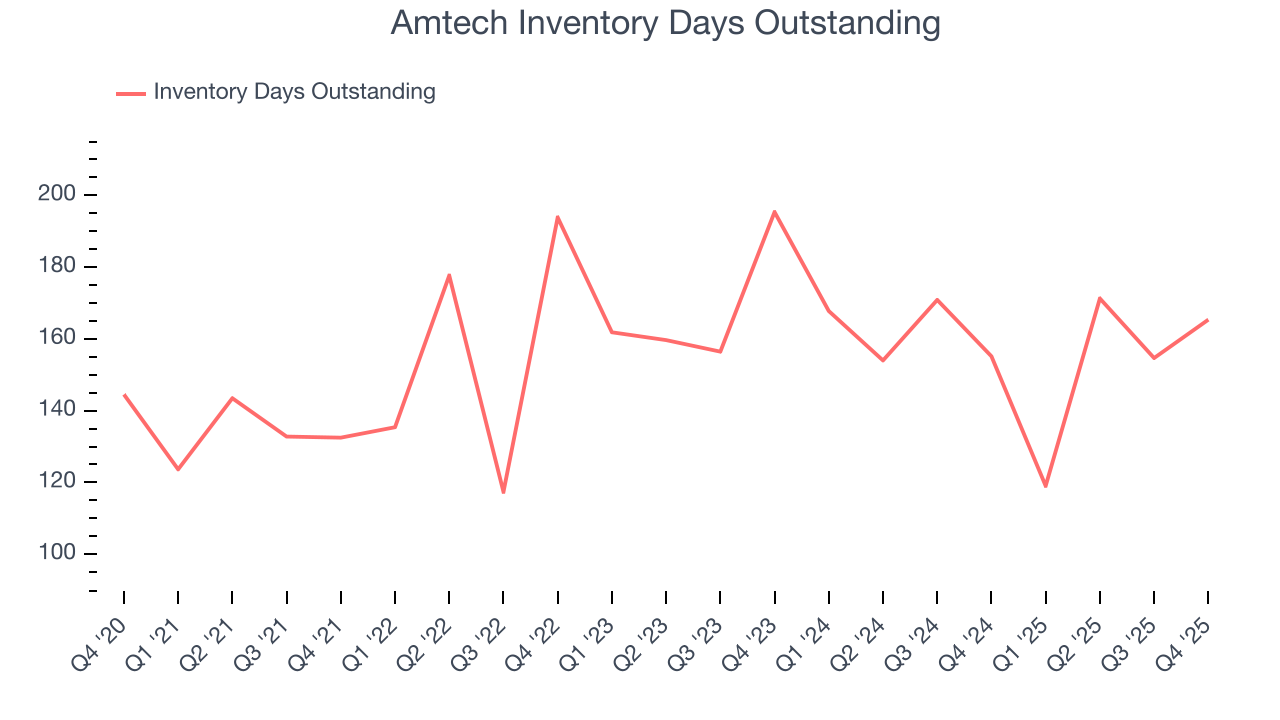
Days Inventory Outstanding (DIO) is an important metric for chipmakers, as it reflects a business’ capital intensity and the cyclical nature of semiconductor supply and demand. In a tight supply environment, inventories tend to be stable, allowing chipmakers to exert pricing power. Steadily increasing DIO can be a warning sign that demand is weak, and if inventories continue to rise, the company may have to downsize production.
This quarter, Amtech’s DIO came in at 165, which is 11 days above its five-year average, suggesting that the company’s inventory has grown to higher levels than we’ve seen in the past.
6. Gross Margin & Pricing Power
In the semiconductor industry, a company’s gross profit margin is a critical metric to track because it sheds light on its pricing power, complexity of products, and ability to procure raw materials, equipment, and labor.
Amtech’s gross margin is one of the worst in the semiconductor industry, signaling it operates in a competitive market and lacks pricing power. As you can see below, it averaged a 36.4% gross margin over the last two years. Said differently, Amtech had to pay a chunky $63.64 to its suppliers for every $100 in revenue. 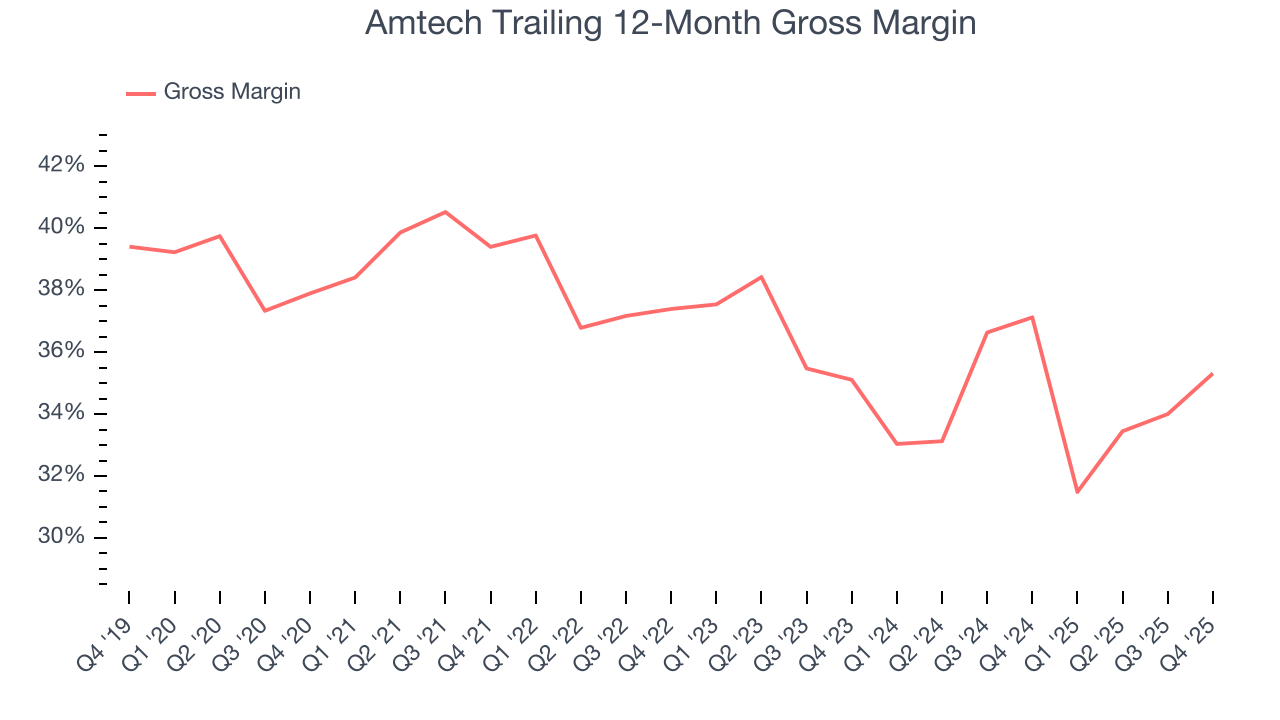
Amtech’s gross profit margin came in at 44.8% this quarter, up 6.4 percentage points year on year. Zooming out, however, Amtech’s full-year margin has been trending down over the past 12 months, decreasing by 1.8 percentage points. If this move continues, it could suggest a more competitive environment with some pressure to lower prices and higher input costs (such as raw materials and manufacturing expenses).
7. Operating Margin
Although Amtech was profitable this quarter from an operational perspective, it’s generally struggled over a longer time period. Its expensive cost structure has contributed to an average operating margin of negative 2.1% over the last two years. Unprofitable semiconductor companies require extra attention because they could get caught swimming naked when the tide goes out. It’s hard to trust that the business can endure a full cycle.
Looking at the trend in its profitability, Amtech’s operating margin decreased by 10.1 percentage points over the last five years. This raises questions about the company’s expense base because its revenue growth should have given it leverage on its fixed costs, resulting in better economies of scale and profitability. Amtech’s performance was poor no matter how you look at it - it shows that costs were rising and it couldn’t pass them onto its customers.
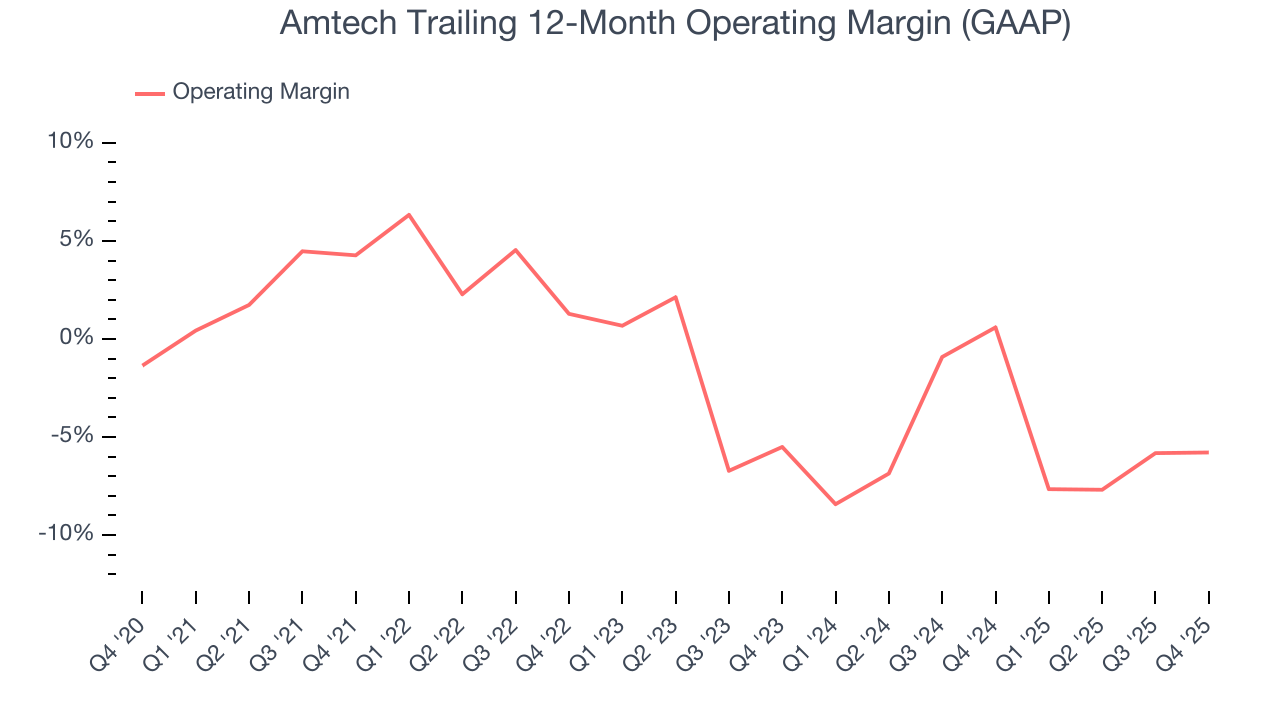
This quarter, Amtech generated an operating margin profit margin of 4.1%, up 2.3 percentage points year on year. Since its gross margin expanded more than its operating margin, we can infer that leverage on its cost of sales was the primary driver behind the recently higher efficiency.
8. Earnings Per Share
Revenue trends explain a company’s historical growth, but the long-term change in earnings per share (EPS) points to the profitability of that growth – for example, a company could inflate its sales through excessive spending on advertising and promotions.
Amtech’s full-year EPS flipped from negative to positive over the last five years. This is encouraging and shows it’s at a critical moment in its life.
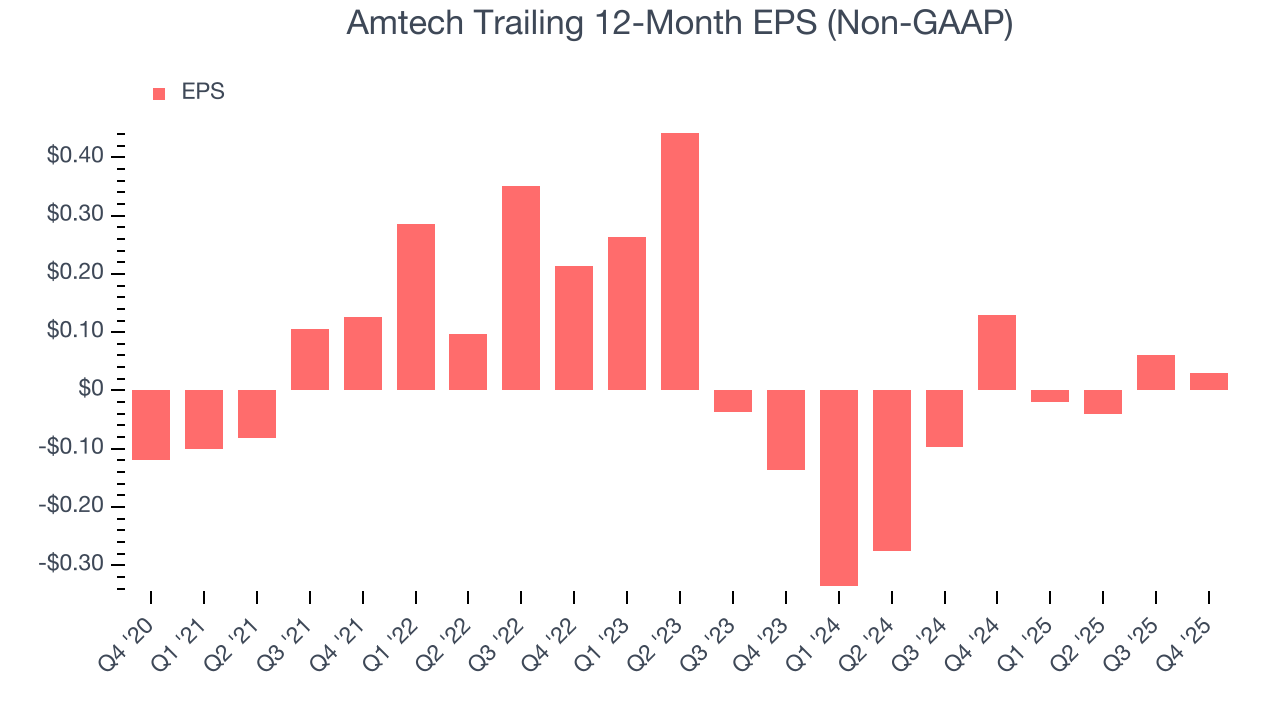
In Q4, Amtech reported adjusted EPS of $0.03, down from $0.06 in the same quarter last year. This print missed analysts’ estimates, but we care more about long-term adjusted EPS growth than short-term movements. We also like to analyze expected EPS growth based on Wall Street analysts’ consensus projections, but there is insufficient data.
9. Cash Is King
If you’ve followed StockStory for a while, you know we emphasize free cash flow. Why, you ask? We believe that in the end, cash is king, and you can’t use accounting profits to pay the bills.
Amtech has shown poor cash profitability over the last two years, giving the company limited opportunities to return capital to shareholders. Its free cash flow margin averaged 6.6%, lousy for a semiconductor business.
Taking a step back, an encouraging sign is that Amtech’s margin expanded by 17.7 percentage points over the last five years. The company’s improvement shows it’s heading in the right direction, and we can see it became a less capital-intensive business because its free cash flow profitability rose while its operating profitability fell.
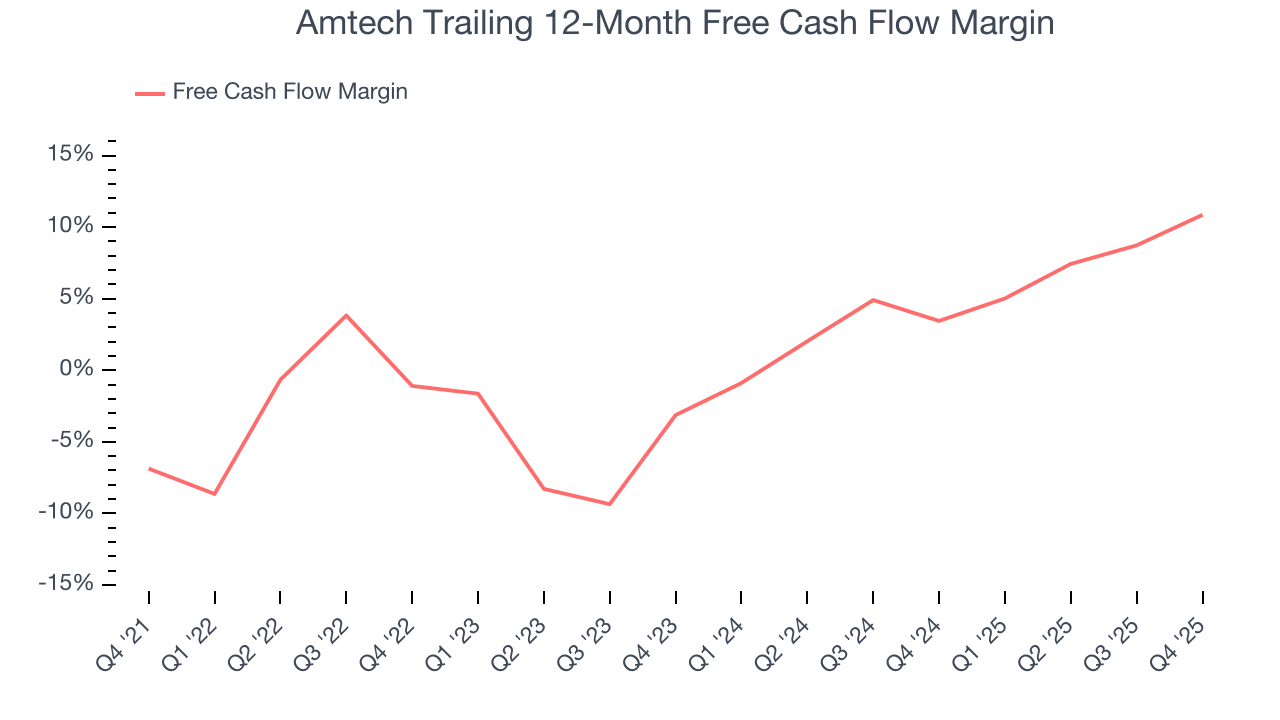
Amtech’s free cash flow clocked in at $3.83 million in Q4, equivalent to a 20.2% margin. This result was good as its margin was 9 percentage points higher than in the same quarter last year, building on its favorable historical trend.
10. Return on Invested Capital (ROIC)
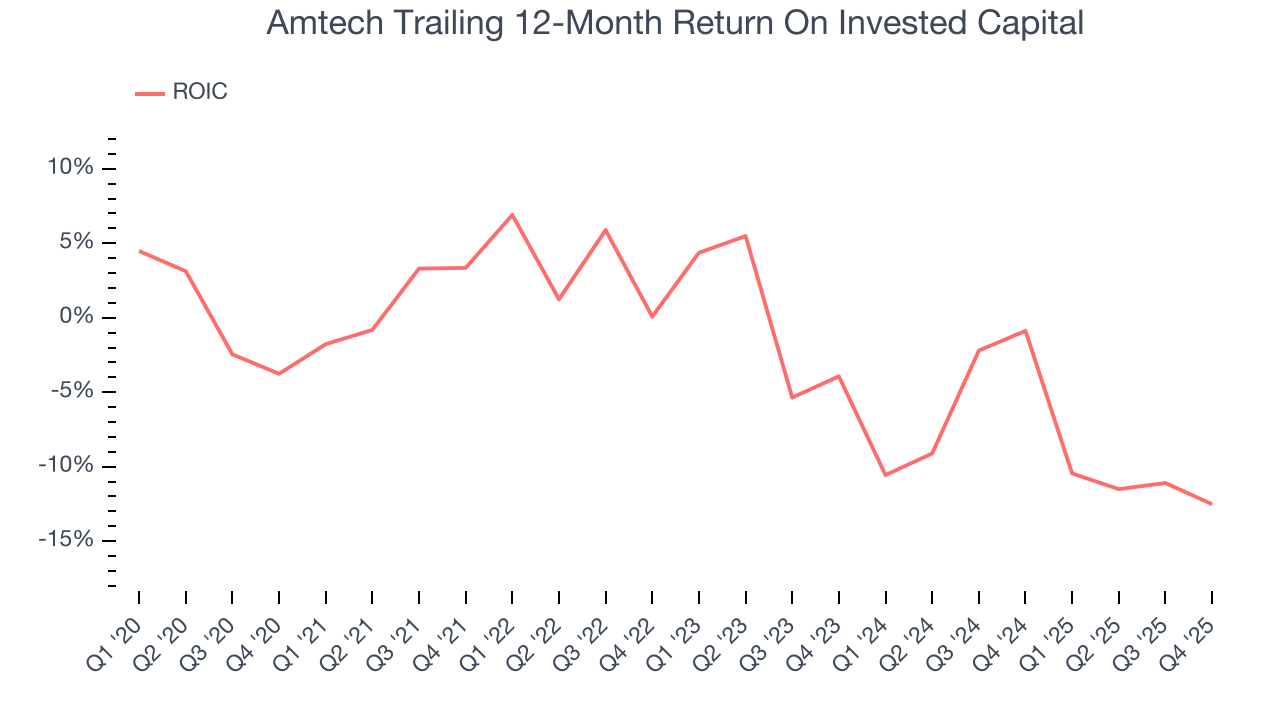
EPS and free cash flow tell us whether a company was profitable while growing its revenue. But was it capital-efficient? Enter ROIC, a metric showing how much operating profit a company generates relative to the money it has raised (debt and equity).
Amtech’s five-year average ROIC was negative 2.8%, meaning management lost money while trying to expand the business. Its returns were among the worst in the semiconductor sector.
11. Balance Sheet Assessment
Businesses that maintain a cash surplus face reduced bankruptcy risk.
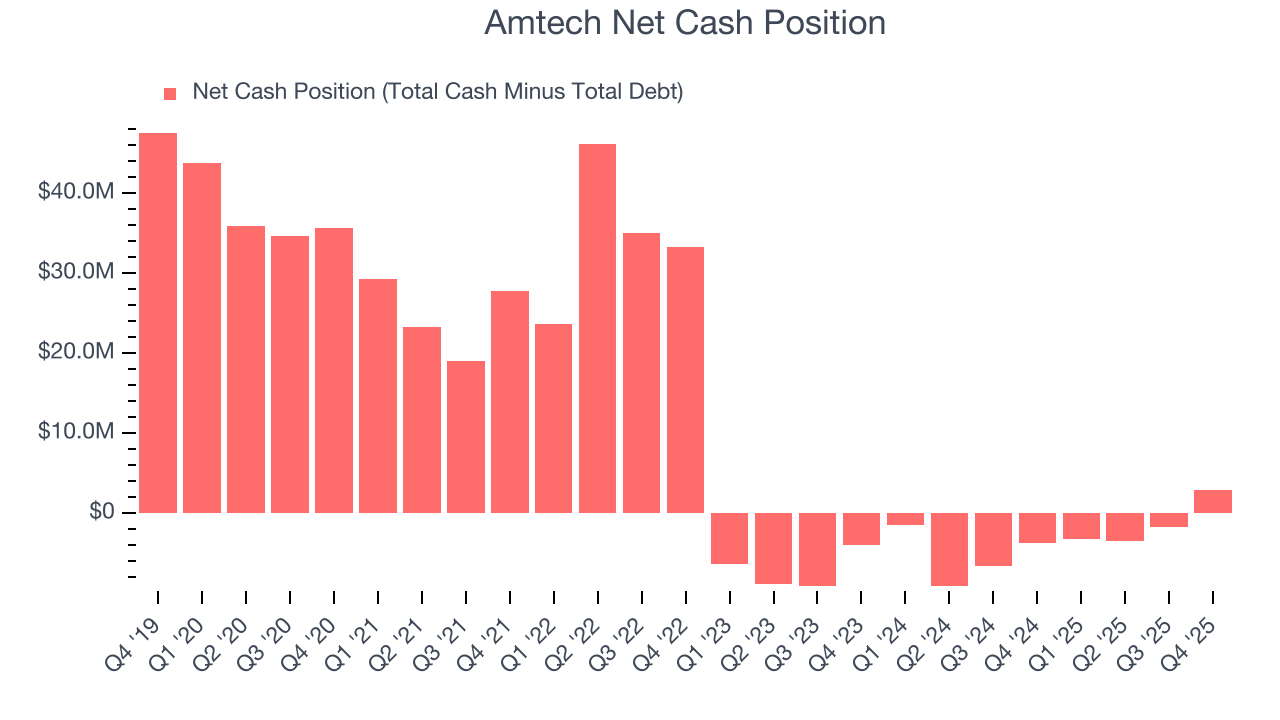
Amtech is a well-capitalized company with $22.08 million of cash and $19.1 million of debt on its balance sheet. This $2.98 million net cash position gives it the freedom to borrow money, return capital to shareholders, or invest in growth initiatives. Leverage is not an issue here.
12. Key Takeaways from Amtech’s Q4 Results
It was encouraging to see Amtech’s revenue guidance for next quarter beat analysts’ expectations. On the other hand, its EPS missed and its inventory levels increased. Overall, this quarter could have been better. The stock traded down 11.2% to $14.18 immediately after reporting.
13. Is Now The Time To Buy Amtech?
Updated: March 15, 2026 at 10:27 PM EDT
Before investing in or passing on Amtech, we urge you to understand the company’s business quality (or lack thereof), valuation, and the latest quarterly results - in that order.
We see the value of companies furthering technological innovation, but in the case of Amtech, we’re out. To begin with, its revenue growth was mediocre over the last five years. While its rising cash profitability gives it more optionality, the downside is its relatively low ROIC suggests management has struggled to find compelling investment opportunities. On top of that, its low free cash flow margins give it little breathing room.
Amtech’s price-to-sales ratio based on the trailing 12 months is 2.5x. The market typically values companies like Amtech based on their anticipated profits for the next 12 months, but there aren’t enough published estimates to arrive at a reliable number. You should avoid this stock for now - better opportunities lie elsewhere.
Wall Street analysts have a consensus one-year price target of $16 on the company (compared to the current share price of $12.97).
Although the price target is bullish, readers should exercise caution because analysts tend to be overly optimistic. The firms they work for, often big banks, have relationships with companies that extend into fundraising, M&A advisory, and other rewarding business lines. As a result, they typically hesitate to say bad things for fear they will lose out. We at StockStory do not suffer from such conflicts of interest, so we’ll always tell it like it is.