
CarGurus (CARG)
CarGurus catches our eye. Despite its slow growth, its highly profitable model gives it a margin of safety during times of stress.― StockStory Analyst Team
1. News


2. Summary
Why CarGurus Is Interesting
Bringing transparency to a sometimes opaque process, CarGurus (NASDAQ:CARG) is a digital marketplace where auto dealers can connect with potential customers and where car buyers can browse, purchase, and obtain financing.
- Platform is difficult to replicate at scale and leads to a best-in-class gross margin of 86%
- Disciplined cost controls and effective management have materialized in a strong EBITDA margin, and its rise over the last few years shows it refined its expense structure
- A blemish is its annual revenue declines of 18.2% over the last three years indicate problems with its market positioning


CarGurus almost passes our quality test. If you like the story, the price seems reasonable.
Why Is Now The Time To Buy CarGurus?


CarGurus is trading at $30.86 per share, or 8.9x forward EV/EBITDA. Scanning companies across the consumer internet space, we think that CarGurus’s valuation is appropriate for the business quality.
It could be a good time to invest if you see something the market doesn’t.
3. CarGurus (CARG) Research Report: Q4 CY2025 Update
Online auto marketplace CarGurus (NASDAQ:CARG) reported revenue ahead of Wall Street’s expectations in Q4 CY2025, with sales up 5.5% year on year to $241.1 million. Guidance for next quarter’s revenue was better than expected at $243 million at the midpoint, 1.7% above analysts’ estimates. Its GAAP profit of $0.51 per share was 3.2% below analysts’ consensus estimates.
CarGurus (CARG) Q4 CY2025 Highlights:
- Revenue: $241.1 million vs analyst estimates of $239.2 million (5.5% year-on-year growth, 0.8% beat)
- EPS (GAAP): $0.51 vs analyst expectations of $0.53 (3.2% miss)
- Adjusted EBITDA: $88.47 billion vs analyst estimates of $87.28 million (36,694% margin, significant beat)
- Revenue Guidance for Q1 CY2026 is $243 million at the midpoint, above analyst estimates of $238.9 million
- EBITDA guidance for Q1 CY2026 is $76 million at the midpoint, below analyst estimates of $78.33 million
- Operating Margin: 28.7%, up from 23.3% in the same quarter last year
- Free Cash Flow Margin: 31.7%, up from 26.8% in the previous quarter
- Paying Dealers: 34,409, up 2,399 year on year
- Market Capitalization: $2.70 billion
Company Overview
Bringing transparency to a sometimes opaque process, CarGurus (NASDAQ:CARG) is a digital marketplace where auto dealers can connect with potential customers and where car buyers can browse, purchase, and obtain financing.
CarGurus was founded in 2006 by Langley Steinert, a co-founder of TripAdvisor, who saw an opportunity to create a better experience for car buyers–who often feel uninformed–and sellers–who sometimes struggle to reach potential buyers. CarGurus provides an end-to-end platform where car buyers and sellers can conduct business in a transparent and digital way all the way from sourcing for dealers to consumer browsing to buying/selling to financing.
The company's customers include individual car buyers and sellers (retail), as well as dealerships and other automotive businesses (wholesale). CarGurus generates revenue through advertising and subscription services for dealerships. These dealer services such as inventory management and lead generation help dealers gain more visibility into their business and connect with potential buyers
The majority of car dealerships in the United States list their inventory on the CarGurus platform, which means extensive inventory and selection. Additionally, features such as the CarGurus Instant Market Value tool, which calculates the fair market value of a car based on various factors, make it easier for buyers to make informed purchasing decisions
4. Online Marketplace
Marketplaces have existed for centuries. Where once it was a main street in a small town or a mall in the suburbs, sellers benefitted from proximity to one another because they could draw customers by offering convenience and selection. Today, a myriad of online marketplaces fulfill that same role, aggregating large customer bases, which attracts commission-paying sellers, generating flywheel scale effects that feed back into further customer acquisition.
Competitors in the online auto market include Carvana (NYSE:CVNA), Cars.com (NYSE:CARS), and Vroom (NASDAQ:VRM).
5. Revenue Growth
Examining a company’s long-term performance can provide clues about its quality. Any business can put up a good quarter or two, but many enduring ones grow for years. CarGurus’s demand was weak over the last three years as its sales fell at a 17.2% annual rate. This wasn’t a great result, but there are still things to like about CarGurus.
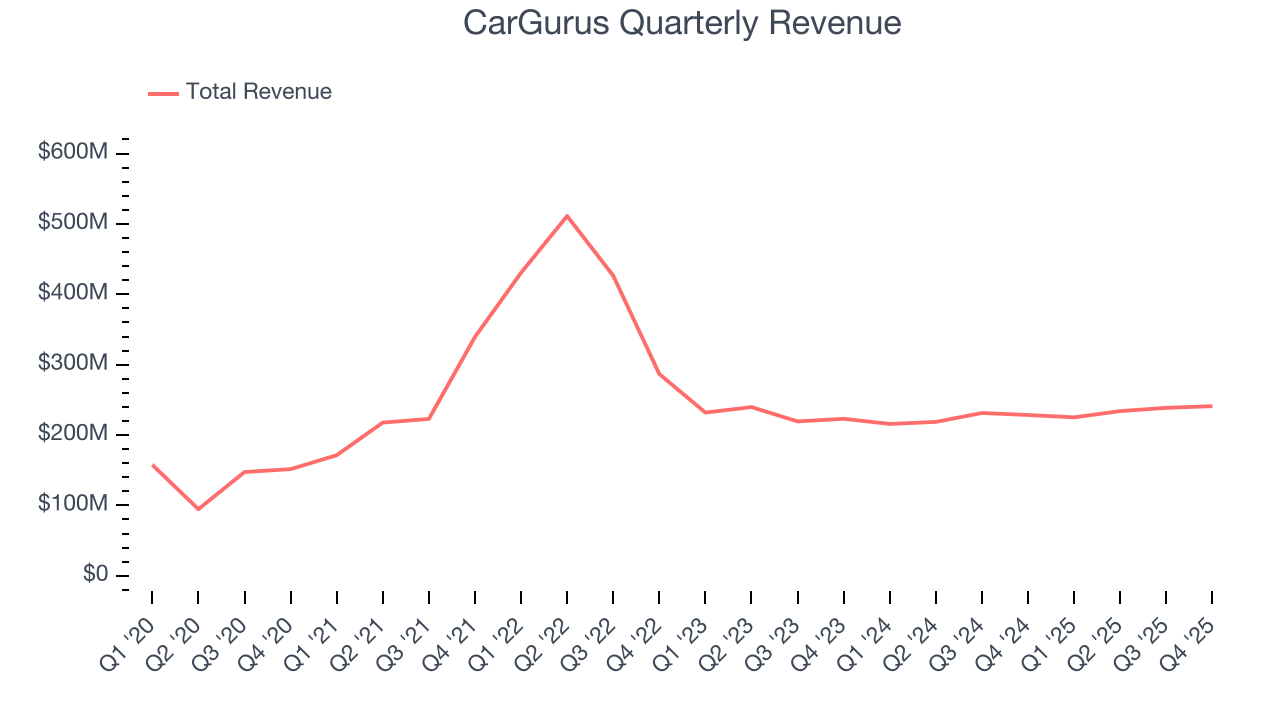
This quarter, CarGurus reported year-on-year revenue growth of 5.5%, and its $241.1 million of revenue exceeded Wall Street’s estimates by 0.8%. Company management is currently guiding for a 7.9% year-on-year increase in sales next quarter.
Looking further ahead, sell-side analysts expect revenue to grow 6% over the next 12 months. While this projection suggests its newer products and services will catalyze better top-line performance, it is still below the sector average.
6. Paying Dealers
User Growth
As an online marketplace, CarGurus generates revenue growth by increasing both the number of users on its platform and the average order size in dollars.
Over the last two years, CarGurus’s paying dealers, a key performance metric for the company, increased by 3.6% annually to 34,409 in the latest quarter. This growth rate lags behind the hottest consumer internet applications. If CarGurus wants to accelerate growth, it likely needs to engage users more effectively with its existing offerings or innovate with new products. 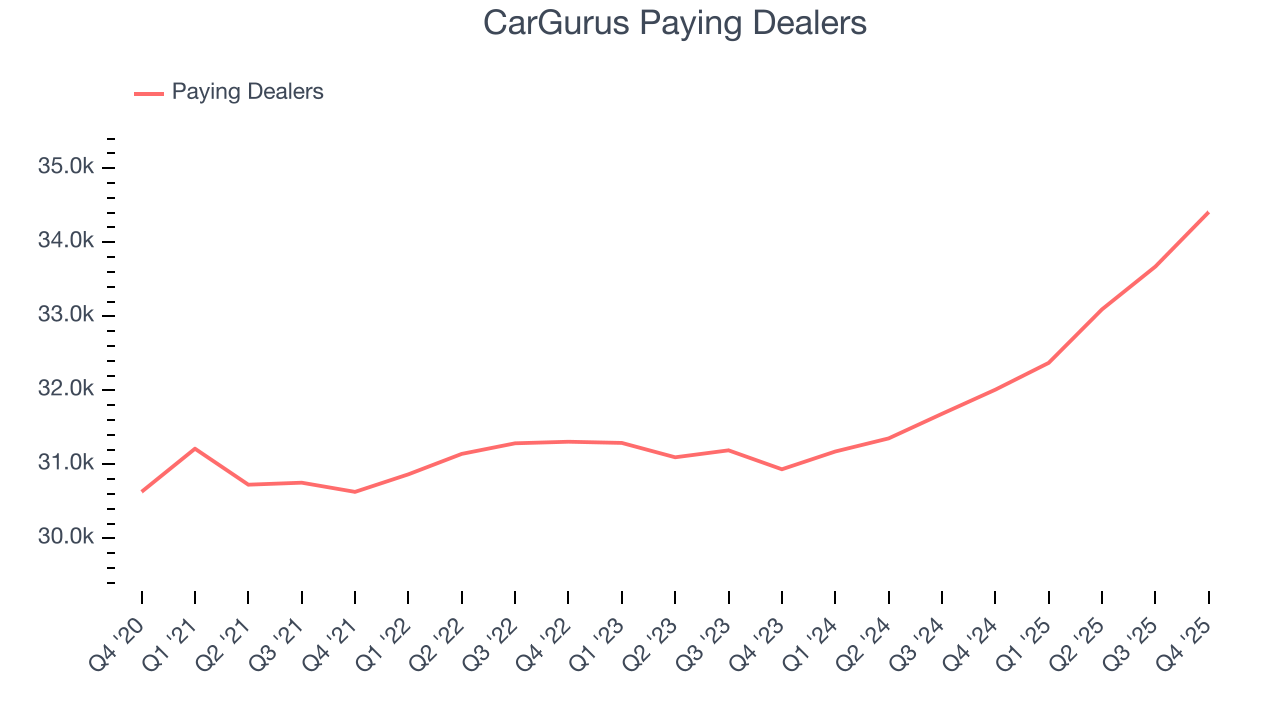
In Q4, CarGurus added 2,399 paying dealers, leading to 7.5% year-on-year growth. The quarterly print was higher than its two-year result, suggesting its new initiatives are accelerating user growth.
Revenue Per User
Average revenue per user (ARPU) is a critical metric to track because it measures how much the company earns in transaction fees from each user. ARPU also gives us unique insights into a user’s average order size and CarGurus’s take rate, or "cut", on each order.
CarGurus’s ARPU fell over the last two years, averaging 2.2% annual declines. This isn’t great when combined with its weaker paying dealers performance. If CarGurus tries boosting ARPU by taking a more aggressive approach to monetization, it’s unclear whether user growth would be sustainable. 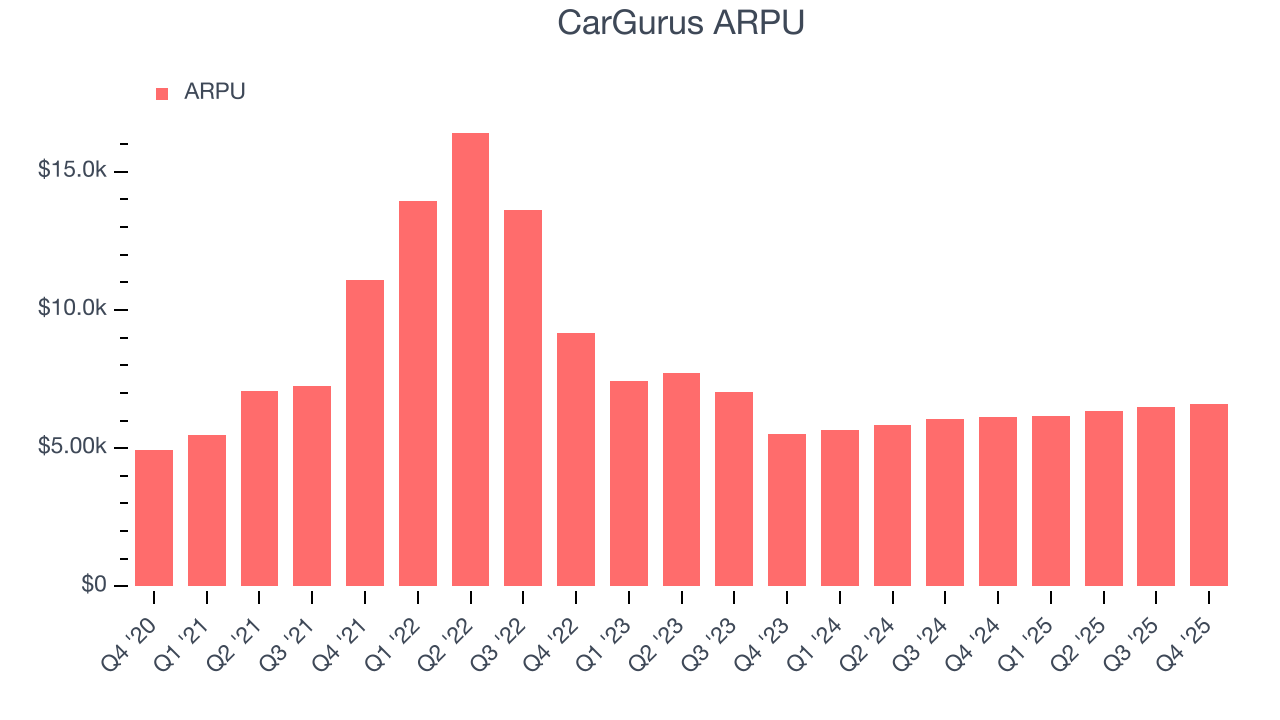
This quarter, CarGurus’s ARPU clocked in at $6,616. It grew by 7.7% year on year, mirroring the performance of its paying dealers.
7. Gross Margin & Pricing Power
For online marketplaces like CarGurus, gross profit tells us how much money the company gets to keep after covering the base cost of its products and services, which typically include payment processing, hosting, and bandwidth fees in addition to the costs necessary to onboard buyers and sellers, such as identity verification.
CarGurus’s gross margin is one of the highest in the consumer internet sector, an output of its asset-lite business model and strong pricing power. It also enables the company to fund large investments in product and marketing during periods of rapid growth to achieve higher profits in the future. As you can see below, it averaged an elite 86.8% gross margin over the last two years. Said differently, roughly $86.84 was left to spend on selling, marketing, and R&D for every $100 in revenue. 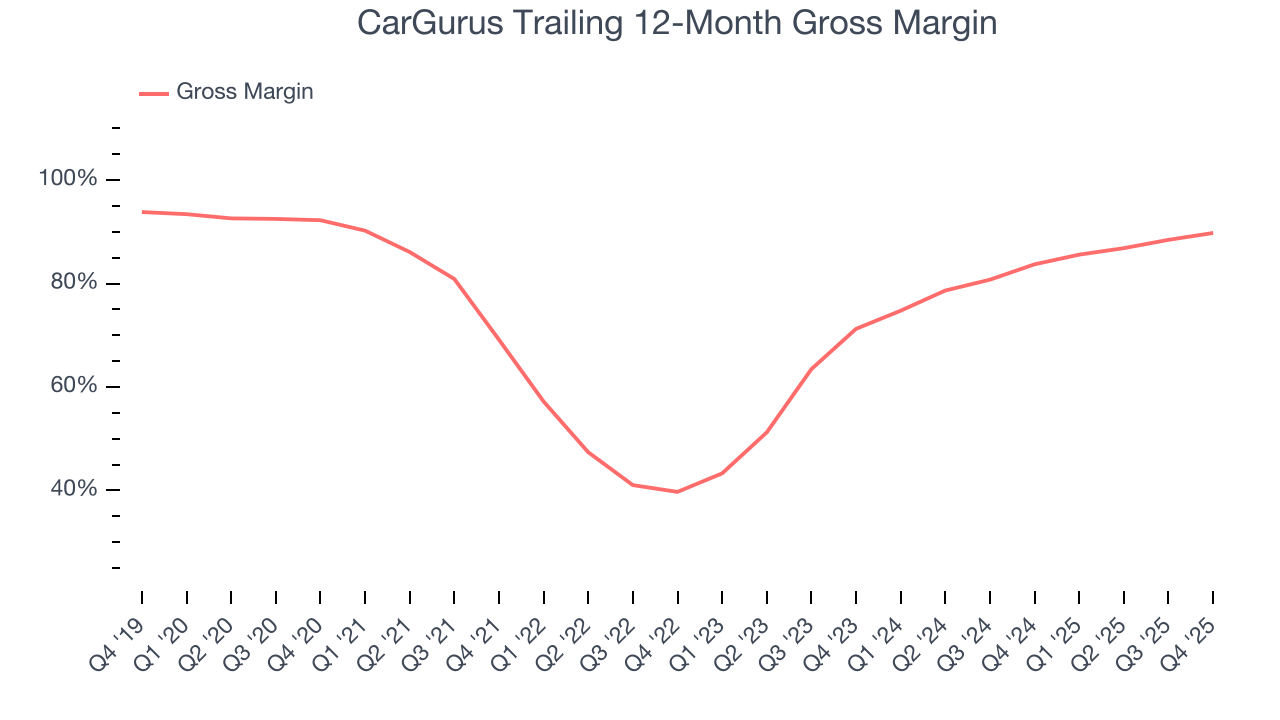
This quarter, CarGurus’s gross profit margin was 92.3% , marking a 5.3 percentage point increase from 87.1% in the same quarter last year. CarGurus’s full-year margin has also been trending up over the past 12 months, increasing by 6.1 percentage points. If this move continues, it could suggest a less competitive environment where the company has better pricing power and leverage from its growing sales on the fixed portion of its cost of goods sold (such as servers).
8. User Acquisition Efficiency
Consumer internet businesses like CarGurus grow from a combination of product virality, paid advertisement, and incentives (unlike enterprise software products, which are often sold by dedicated sales teams).
CarGurus does a decent job acquiring new users, spending 41.3% of its gross profit on sales and marketing expenses over the last year. This decent efficiency indicates relatively solid competitive positioning, giving CarGurus the freedom to invest its resources into new growth initiatives.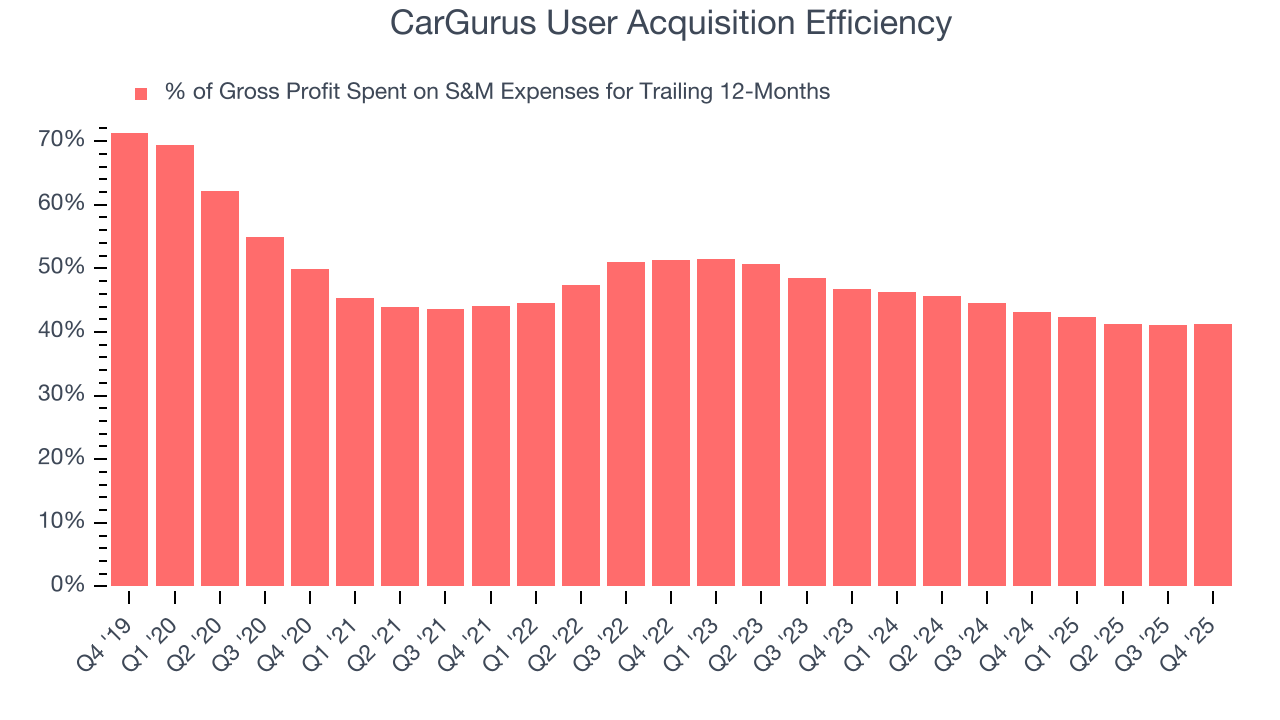
9. EBITDA
CarGurus has been a well-oiled machine over the last two years. It demonstrated elite profitability for a consumer internet business, boasting an average EBITDA margin of 4,851%. This result isn’t surprising as its high gross margin gives it a favorable starting point.
Analyzing the trend in its profitability, CarGurus’s EBITDA margin rose significantly over the last few years, showing its efficiency has meaningfully improved.
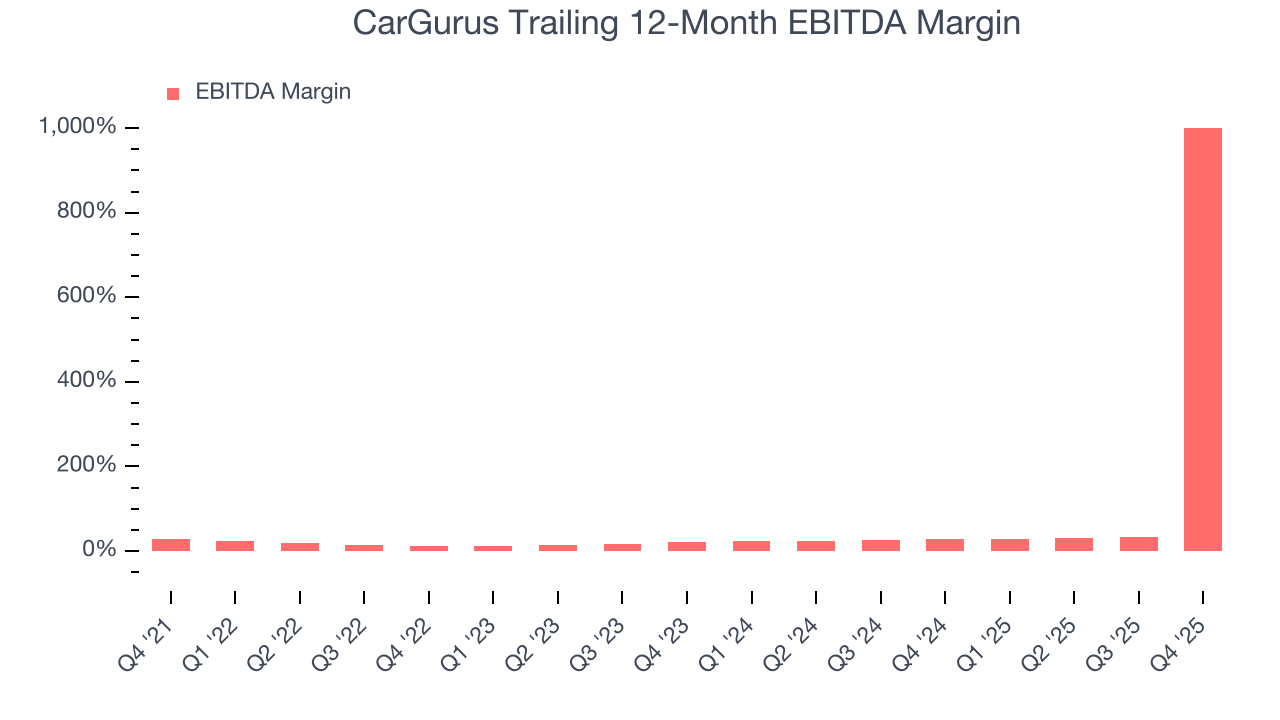
This quarter, CarGurus generated an EBITDA margin profit margin of 36,694%, up 36,661 percentage points year on year. The increase was solid, and because its EBITDA margin rose more than its gross margin, we can infer it was more efficient with expenses such as marketing, R&D, and administrative overhead.
10. Earnings Per Share
We track the long-term change in earnings per share (EPS) for the same reason as long-term revenue growth. Compared to revenue, however, EPS highlights whether a company’s growth is profitable.
CarGurus’s full-year EPS flipped from negative to positive over the last three years. This is a good sign and shows it’s at an inflection point.
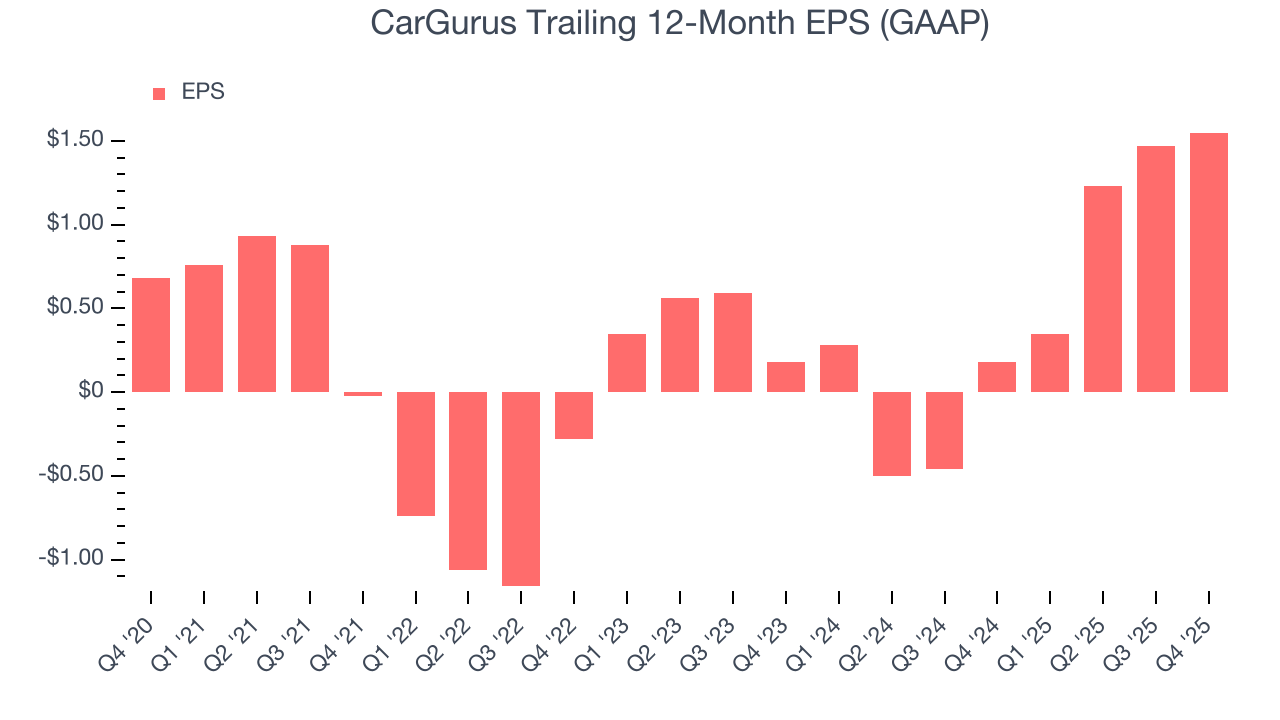
In Q4, CarGurus reported EPS of $0.51, up from $0.43 in the same quarter last year. Despite growing year on year, this print missed analysts’ estimates, but we care more about long-term EPS growth than short-term movements. Over the next 12 months, Wall Street expects CarGurus’s full-year EPS of $1.55 to grow 32.4%.
11. Cash Is King
Free cash flow isn't a prominently featured metric in company financials and earnings releases, but we think it's telling because it accounts for all operating and capital expenses, making it tough to manipulate. Cash is king.
CarGurus has shown terrific cash profitability, driven by its lucrative business model that enables it to reinvest, return capital to investors, and stay ahead of the competition while maintaining an ample cushion. The company’s free cash flow margin was among the best in the consumer internet sector, averaging 23.3% over the last two years.
Taking a step back, we can see that CarGurus’s margin expanded by 13.9 percentage points over the last few years. This is encouraging because it gives the company more optionality.
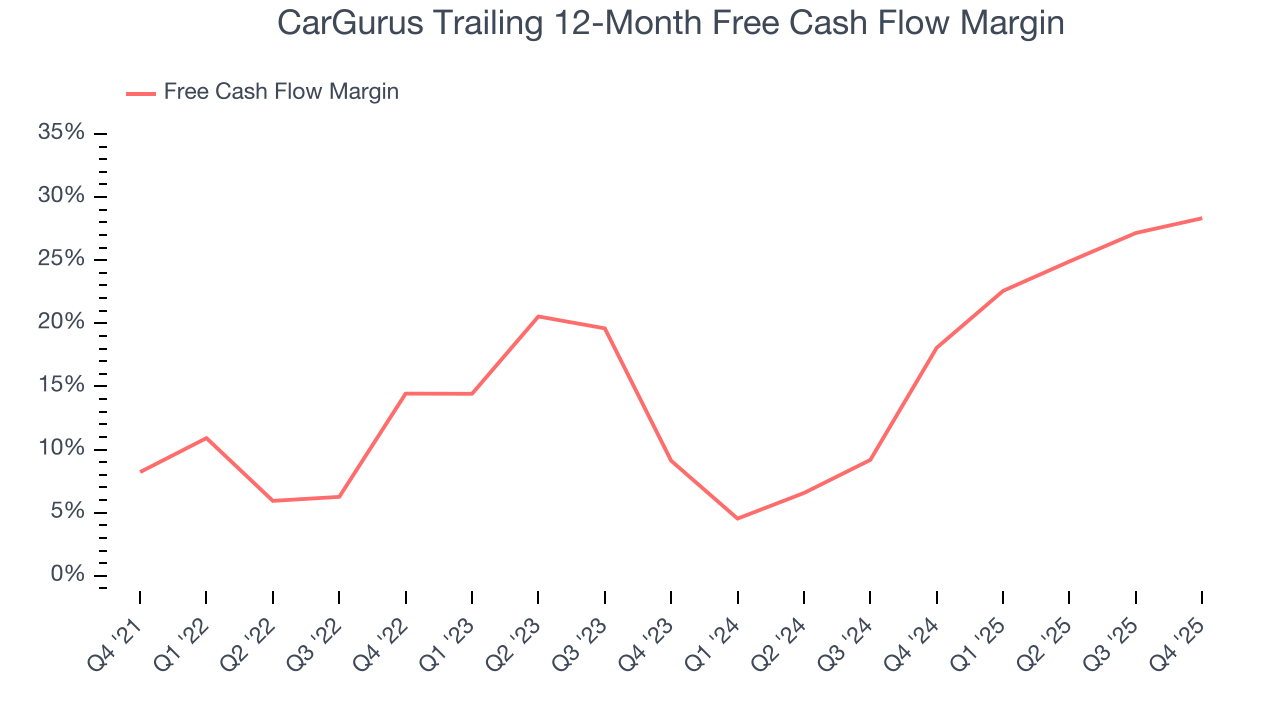
CarGurus’s free cash flow clocked in at $76.43 million in Q4, equivalent to a 31.7% margin. This result was good as its margin was 4.6 percentage points higher than in the same quarter last year, building on its favorable historical trend.
12. Balance Sheet Assessment
CarGurus reported $190.5 million of cash and $190.8 million of debt on its balance sheet in the most recent quarter. As investors in high-quality companies, we primarily focus on two things: 1) that a company’s debt level isn’t too high and 2) that its interest payments are not excessively burdening the business.
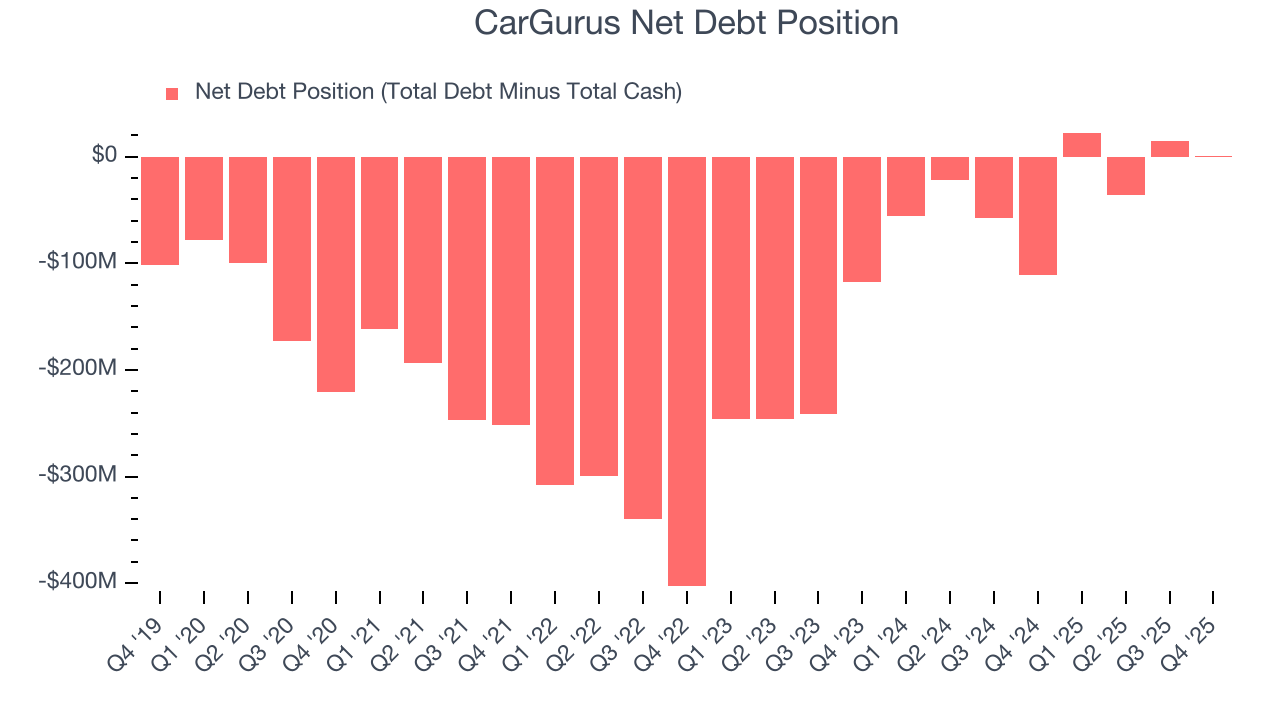
With $88.69 billion of EBITDA over the last 12 months, we view CarGurus’s 0.0× net-debt-to-EBITDA ratio as safe. We also see its $9.15 million of annual interest expenses as appropriate. The company’s profits give it plenty of breathing room, allowing it to continue investing in growth initiatives.
13. Key Takeaways from CarGurus’s Q4 Results
We were impressed by how significantly CarGurus blew past analysts’ EBITDA expectations this quarter. We were also glad its revenue guidance for next quarter exceeded Wall Street’s estimates. On the other hand, its EBITDA guidance for next quarter missed. Overall, this print had some key positives. Investors were likely hoping for more, and shares traded down 1.9% to $27.90 immediately after reporting.
14. Is Now The Time To Buy CarGurus?
Updated: March 14, 2026 at 10:37 PM EDT
The latest quarterly earnings matters, sure, but we actually think longer-term fundamentals and valuation matter more. Investors should consider all these pieces before deciding whether or not to invest in CarGurus.
CarGurus possesses a number of positive attributes. Although its revenue has declined over the last three years, its growth over the next 12 months is expected to be higher. And while CarGurus’s ARPU has declined over the last two years, its admirable gross margins are a wonderful starting point for the overall profitability of the business. On top of that, its impressive EBITDA margins show it has a highly efficient business model.
CarGurus’s EV/EBITDA ratio based on the next 12 months is 8.9x. When scanning the consumer internet space, CarGurus trades at a fair valuation. If you trust the business and its direction, this is an ideal time to buy.
Wall Street analysts have a consensus one-year price target of $35.79 on the company (compared to the current share price of $30.86), implying they see 16% upside in buying CarGurus in the short term.