Cracker Barrel (CBRL)
Cracker Barrel is up against the odds. Its sales have underperformed and its low returns on capital show it has few growth opportunities.― StockStory Analyst Team
1. News


2. Summary
Why We Think Cracker Barrel Will Underperform
Known for its country-themed food and merchandise, Cracker Barrel (NASDAQ:CBRL) is a beloved American restaurant and retail chain that celebrates the warmth and charm of Southern hospitality.
- Lackluster 1.2% annual revenue growth over the last six years indicates the company is losing ground to competitors
- Forecasted revenue decline of 1.5% for the upcoming 12 months implies demand will fall off a cliff
- Limited cash reserves may force the company to seek unfavorable financing terms that could dilute shareholders


Cracker Barrel lacks the business quality we seek. We’ve identified better opportunities elsewhere.
Why There Are Better Opportunities Than Cracker Barrel


Cracker Barrel’s stock price of $27.90 implies a valuation ratio of 12.4x forward EV-to-EBITDA. This multiple is lower than most restaurant companies, but for good reason.
Cheap stocks can look like great bargains at first glance, but you often get what you pay for. These mediocre businesses often have less earnings power, meaning there is more reliance on a re-rating to generate good returns - an unlikely scenario for low-quality companies.
3. Cracker Barrel (CBRL) Research Report: Q4 CY2025 Update
Restaurant company Cracker Barrel (NASDAQ:CBRL) reported Q4 CY2025 results beating Wall Street’s revenue expectations, but sales fell by 7.9% year on year to $874.8 million. The company expects the full year’s revenue to be around $3.26 billion, close to analysts’ estimates. Its non-GAAP profit of $0.25 per share was significantly above analysts’ consensus estimates.
Cracker Barrel (CBRL) Q4 CY2025 Highlights:
- Revenue: $874.8 million vs analyst estimates of $864.2 million (7.9% year-on-year decline, 1.2% beat)
- Adjusted EPS: $0.25 vs analyst estimates of -$0.30 (significant beat)
- Adjusted EBITDA: $38.16 million vs analyst estimates of $26.54 million (4.4% margin, 43.8% beat)
- The company slightly lifted its revenue guidance for the full year to $3.26 billion at the midpoint from $3.25 billion
- EBITDA guidance for the full year is $92.5 million at the midpoint, above analyst estimates of $91.52 million
- Operating Margin: 0.1%, down from 3.1% in the same quarter last year
- Free Cash Flow Margin: 2.8%, down from 6.3% in the same quarter last year
- Locations: 710 at quarter end, down from 726 in the same quarter last year
- Same-Store Sales fell 7.1% year on year (4.7% in the same quarter last year)
- Market Capitalization: $685.7 million
Company Overview
Known for its country-themed food and merchandise, Cracker Barrel (NASDAQ:CBRL) is a beloved American restaurant and retail chain that celebrates the warmth and charm of Southern hospitality.
The company was founded in 1969 when founder Dan Evins envisioned creating a welcoming stop along the highway to provide travelers with a taste of home-cooked Southern meals and a place to rest and relax. This idea led to the first Cracker Barrel Old Country Store in Lebanon, Tennessee.
Today, Cracker Barrel is a nationwide brand and has become a cherished destination for travelers and locals alike. Its extensive menu features classic favorites such as chicken and dumplings, meatloaf, and country-fried steak, served with delectable sides including macaroni and cheese, green beans, and cornbread.
The Cracker Barrel experience, however, is about more than just delicious food; it's a journey back in time. Each restaurant evokes the nostalgic charm of an old country store, complete with wooden rocking chairs on the front porch, vintage memorabilia, and unique decorations that tell a story of American heritage.
To further immerse themselves, guests can also explore the fan-favorite Cracker Barrel gift shop after their meals, offering anything from country-inspired clothing and home décor to old-school toys and classic candies. Just like its meals, Cracker Barrel's retail offerings are carefully curated to reflect the best of country living.
4. Sit-Down Dining
Sit-down restaurants offer a complete dining experience with table service. These establishments span various cuisines and are renowned for their warm hospitality and welcoming ambiance, making them perfect for family gatherings, special occasions, or simply unwinding. Their extensive menus range from appetizers to indulgent desserts and wines and cocktails. This space is extremely fragmented and competition includes everything from publicly-traded companies owning multiple chains to single-location mom-and-pop restaurants.
Full-service restaurant competitors include Bloomin’ Brands (NASDAQ:BLMN), Darden Restaurants (NYSE:DRI), Dine Brands (NYSE:DIN), and Texas Roadhouse (NASDAQ:TXRH).
5. Revenue Growth
A company’s long-term sales performance is one signal of its overall quality. Any business can have short-term success, but a top-tier one grows for years.
With $3.36 billion in revenue over the past 12 months, Cracker Barrel is one of the larger restaurant chains in the industry and benefits from a well-known brand that influences consumer purchasing decisions. However, its scale is a double-edged sword because there is only so much real estate to build restaurants, placing a ceiling on its growth. To accelerate system-wide sales, Cracker Barrel likely needs to optimize its pricing or lean into new chains and international expansion.
As you can see below, Cracker Barrel’s sales grew at a weak 1.2% compounded annual growth rate over the last six years as it didn’t open many new restaurants.
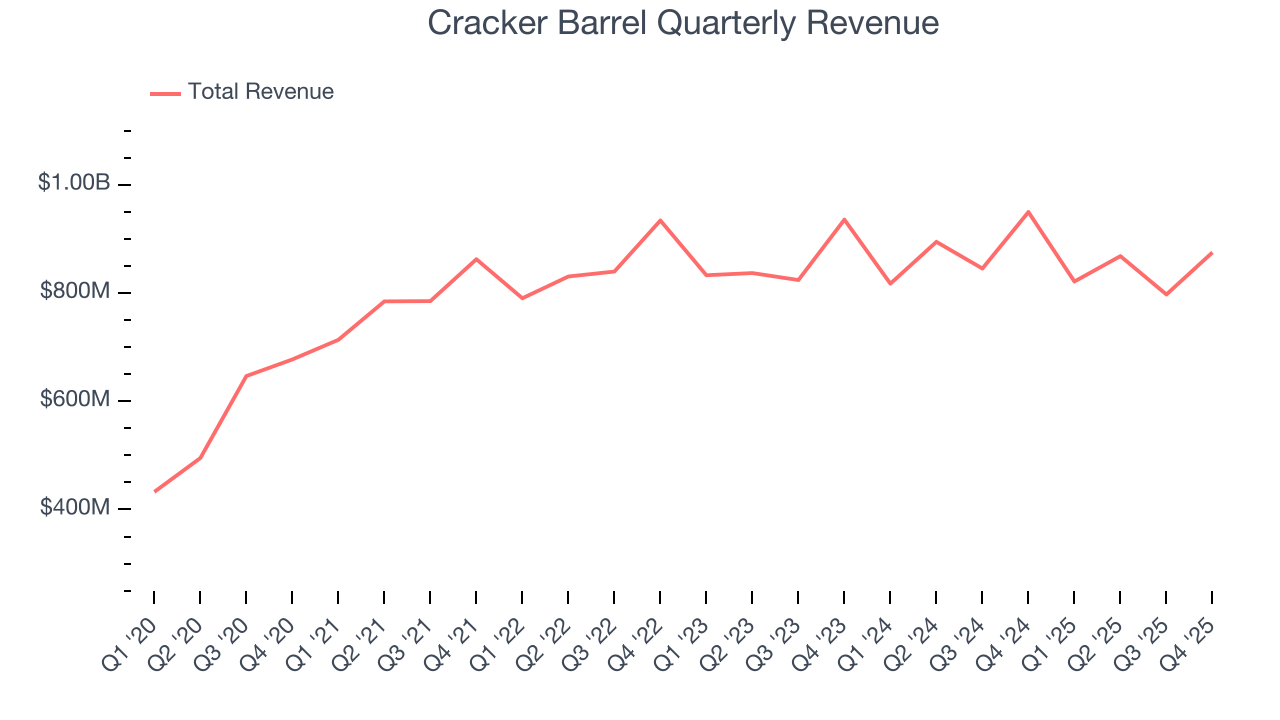
This quarter, Cracker Barrel’s revenue fell by 7.9% year on year to $874.8 million but beat Wall Street’s estimates by 1.2%.
Looking ahead, sell-side analysts expect revenue to decline by 1.8% over the next 12 months, a deceleration versus the last six years. This projection is underwhelming and suggests its menu offerings will face some demand challenges.
6. Restaurant Performance
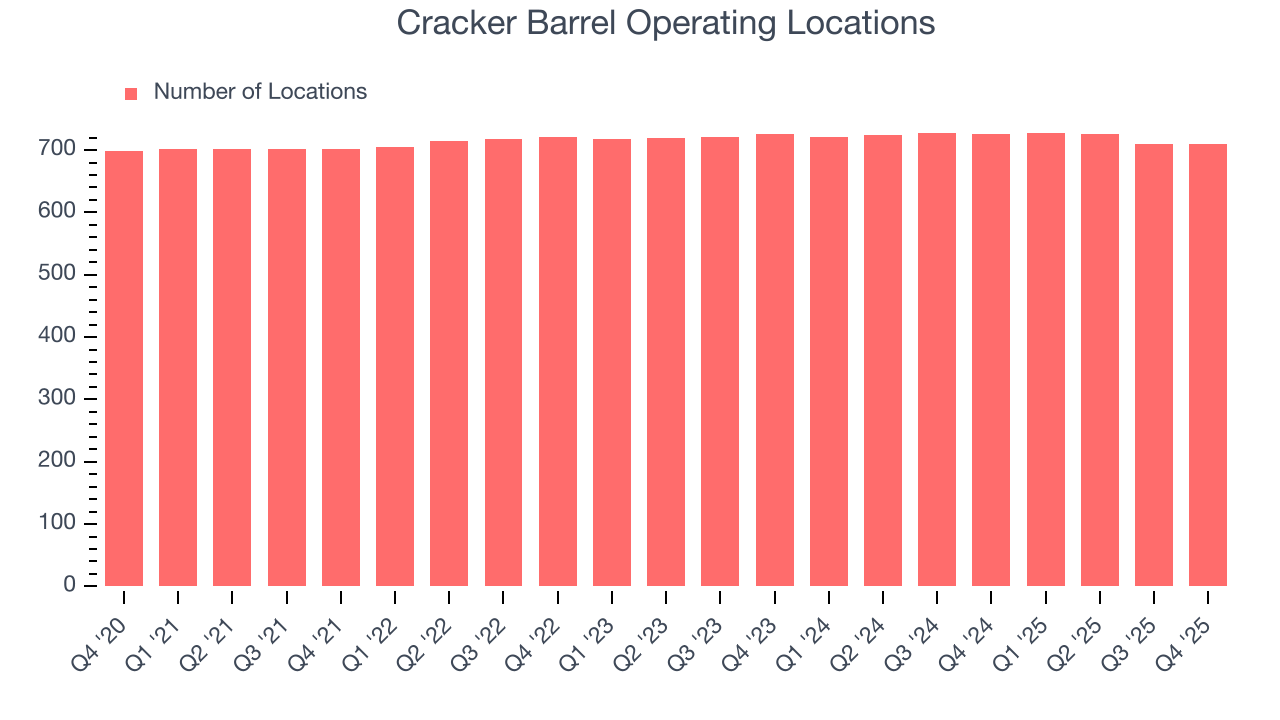
Number of Restaurants
A restaurant chain’s total number of dining locations often determines how much revenue it can generate.
Cracker Barrel operated 710 locations in the latest quarter, and over the last two years, has kept its restaurant count flat while other restaurant businesses have opted for growth.
When a chain doesn’t open many new restaurants, it usually means there’s stable demand for its meals and it’s focused on improving operational efficiency to increase profitability.
Same-Store Sales
A company's restaurant base only paints one part of the picture. When demand is high, it makes sense to open more. But when demand is low, it’s prudent to close some locations and use the money in other ways. Same-store sales provides a deeper understanding of this issue because it measures organic growth at restaurants open for at least a year.
Cracker Barrel’s demand within its existing dining locations has barely increased over the last two years as its same-store sales were flat. This performance isn’t ideal, and we’d be skeptical if Cracker Barrel starts opening new restaurants to artificially boost revenue growth.
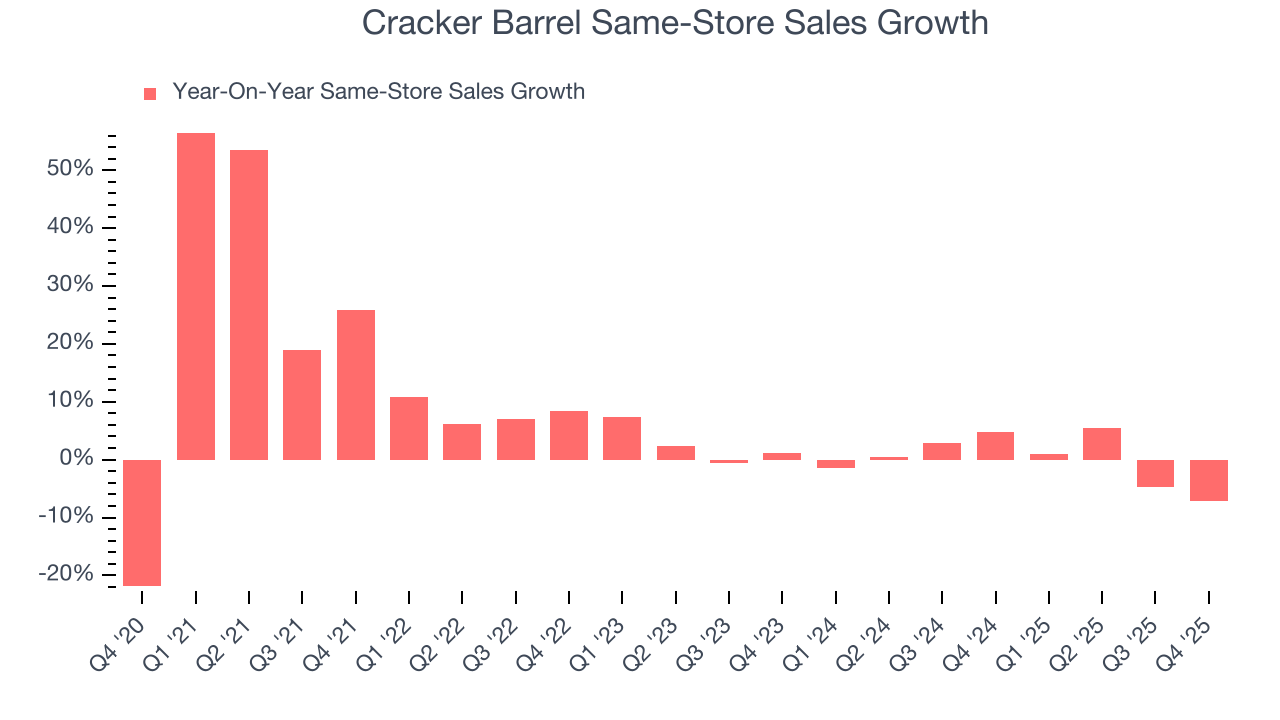
In the latest quarter, Cracker Barrel’s same-store sales fell by 7.1% year on year. This decline was a reversal from its historical levels.
7. Gross Margin & Pricing Power
We prefer higher gross margins because they not only make it easier to generate more operating profits but also indicate pricing power and differentiation, whether it be the dining experience or quality and taste of food.
Cracker Barrel has good unit economics for a restaurant company, giving it the opportunity to invest in areas such as marketing and talent to stay competitive. As you can see below, it averaged an impressive 32.2% gross margin over the last two years. Said differently, Cracker Barrel paid its suppliers $67.78 for every $100 in revenue. 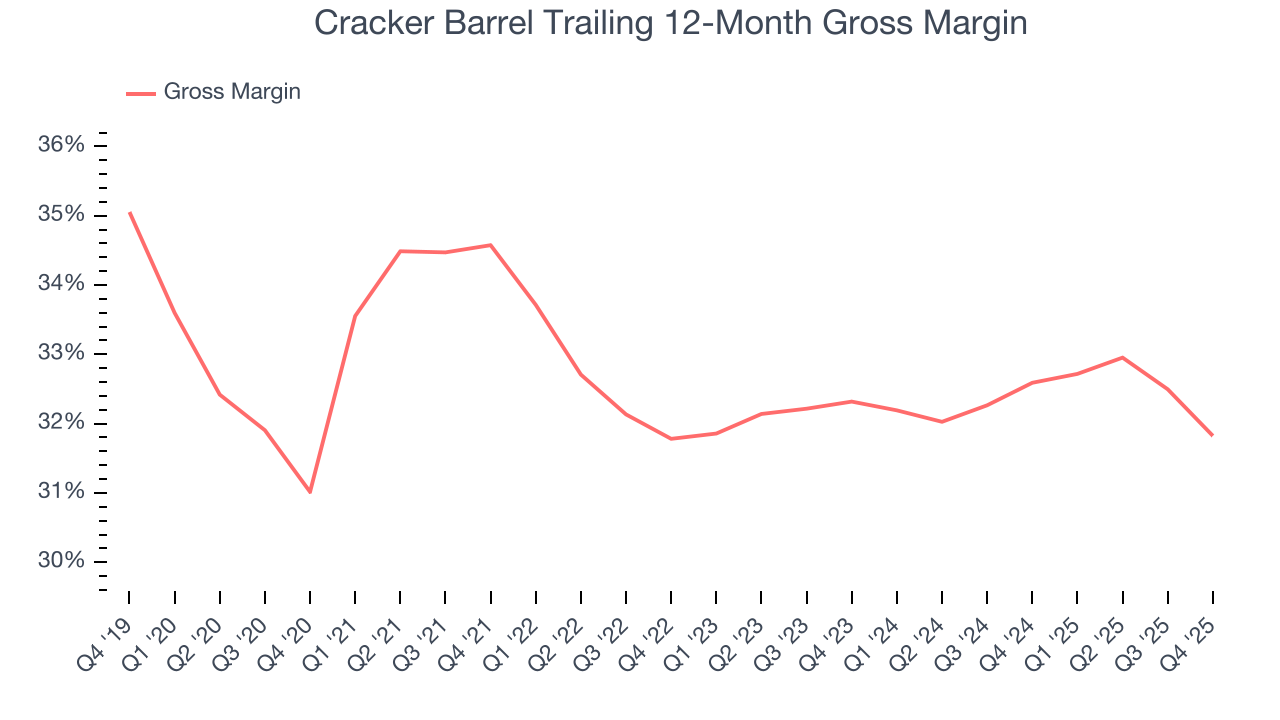
Cracker Barrel produced a 30.5% gross profit margin in Q4, marking a 2.5 percentage point decrease from 33% in the same quarter last year. On a wider time horizon, the company’s full-year margin has remained steady over the past four quarters, suggesting its input costs (such as ingredients and transportation expenses) have been stable and it isn’t under pressure to lower prices.
8. Operating Margin
Operating margin is a key measure of profitability. Think of it as net income - the bottom line - excluding the impact of taxes and interest on debt, which are less connected to business fundamentals.
Cracker Barrel was roughly breakeven when averaging the last two years of quarterly operating profits, inadequate for a restaurant business. This result is surprising given its high gross margin as a starting point.
Looking at the trend in its profitability, Cracker Barrel’s operating margin decreased by 1.5 percentage points over the last year. This raises questions about the company’s expense base because its revenue growth should have given it leverage on its fixed costs, resulting in better economies of scale and profitability. Cracker Barrel’s performance was poor no matter how you look at it - it shows that costs were rising and it couldn’t pass them onto its customers.
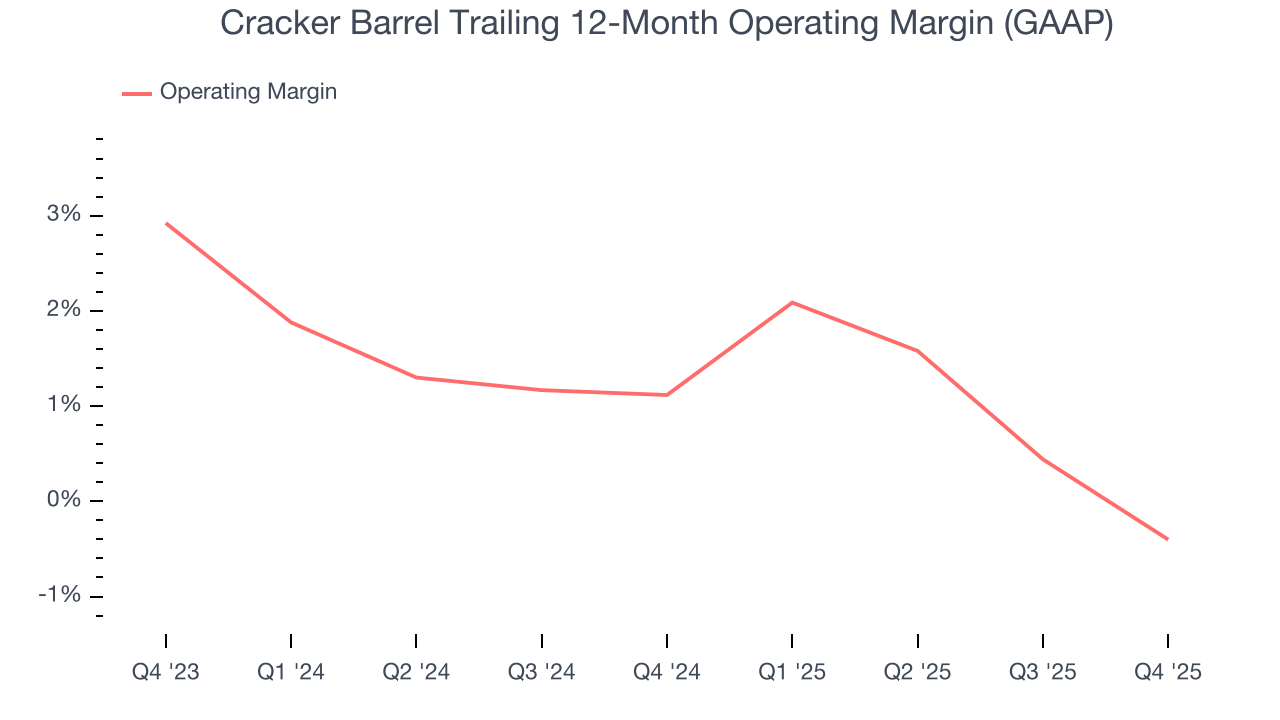
This quarter, Cracker Barrel’s breakeven margin was 0.1%, down 3 percentage points year on year. Since Cracker Barrel’s operating margin decreased more than its gross margin, we can assume it was less efficient because expenses such as marketing, and administrative overhead increased.
9. Earnings Per Share
We track the long-term change in earnings per share (EPS) for the same reason as long-term revenue growth. Compared to revenue, however, EPS highlights whether a company’s growth is profitable.
Sadly for Cracker Barrel, its EPS declined by 33.1% annually over the last six years while its revenue grew by 1.2%. This tells us the company became less profitable on a per-share basis as it expanded due to non-fundamental factors such as interest expenses and taxes.
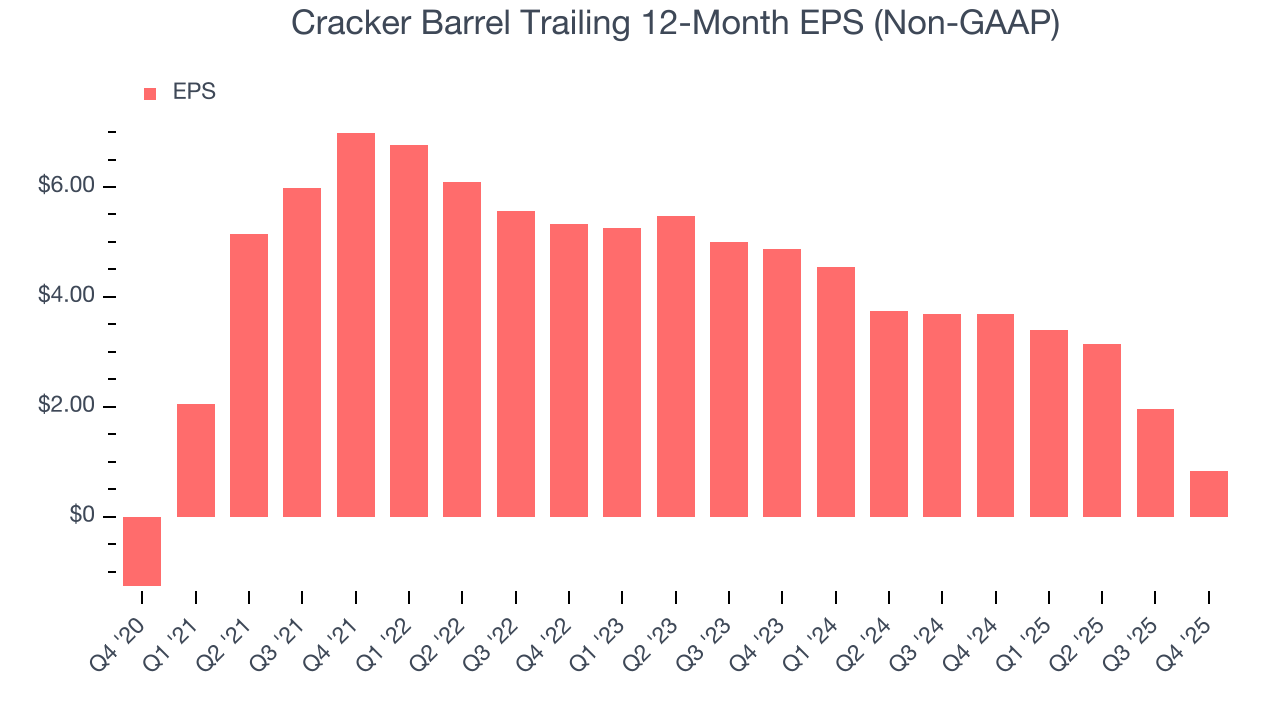
In Q4, Cracker Barrel reported adjusted EPS of $0.25, down from $1.38 in the same quarter last year. Despite falling year on year, this print easily cleared analysts’ estimates. Over the next 12 months, Wall Street expects Cracker Barrel to perform poorly. Analysts forecast its full-year EPS of $0.83 will invert to negative negative $0.57.
10. Cash Is King
Although earnings are undoubtedly valuable for assessing company performance, we believe cash is king because you can’t use accounting profits to pay the bills.
Cracker Barrel broke even from a free cash flow perspective over the last two years, giving the company limited opportunities to return capital to shareholders.
Taking a step back, we can see that Cracker Barrel’s margin dropped by 1.9 percentage points over the last year. Almost any movement in the wrong direction is undesirable because of its already low cash conversion. If the trend continues, it could signal it’s in the middle of an investment cycle.
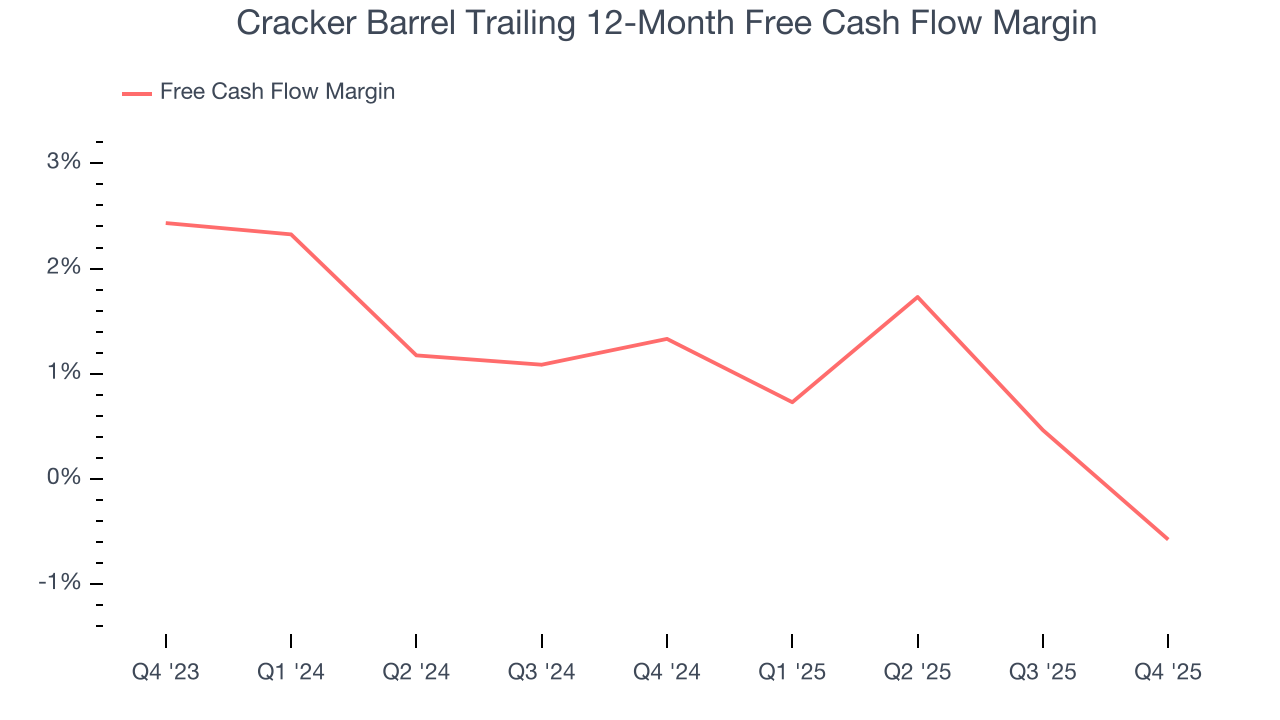
Cracker Barrel’s free cash flow clocked in at $24.68 million in Q4, equivalent to a 2.8% margin. The company’s cash profitability regressed as it was 3.5 percentage points lower than in the same quarter last year, but it’s still above its two-year average. We wouldn’t read too much into this quarter’s decline because investment needs can be seasonal, causing short-term swings. Long-term trends carry greater meaning.
11. Return on Invested Capital (ROIC)
EPS and free cash flow tell us whether a company was profitable while growing its revenue. But was it capital-efficient? Enter ROIC, a metric showing how much operating profit a company generates relative to the money it has raised (debt and equity).
Cracker Barrel historically did a mediocre job investing in profitable growth initiatives. Its five-year average ROIC was 5.4%, somewhat low compared to the best restaurant companies that consistently pump out 15%+.
12. Balance Sheet Risk
As long-term investors, the risk we care about most is the permanent loss of capital, which can happen when a company goes bankrupt or raises money from a disadvantaged position. This is separate from short-term stock price volatility, something we are much less bothered by.
Cracker Barrel burned through $19.37 million of cash over the last year, and its $1.15 billion of debt exceeds the $8.57 million of cash on its balance sheet. This is a deal breaker for us because indebted loss-making companies spell trouble.
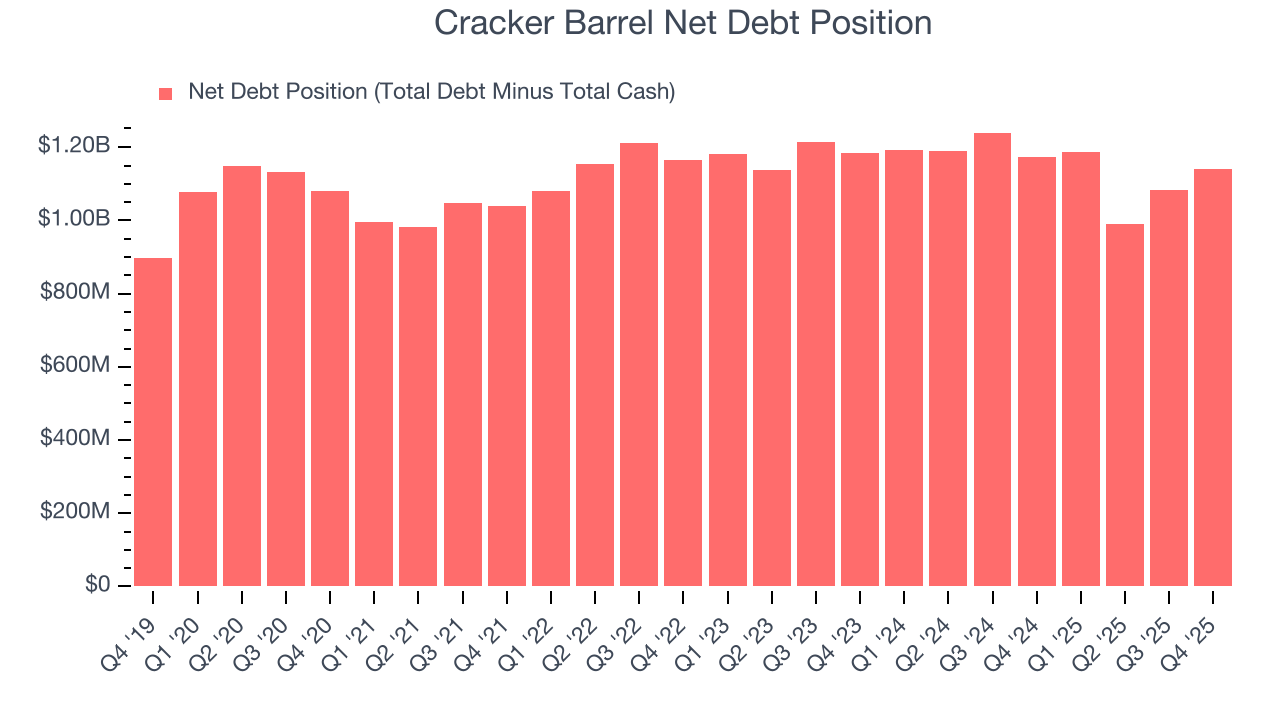
Unless the Cracker Barrel’s fundamentals change quickly, it might find itself in a position where it must raise capital from investors to continue operating. Whether that would be favorable is unclear because dilution is a headwind for shareholder returns.
We remain cautious of Cracker Barrel until it generates consistent free cash flow or any of its announced financing plans materialize on its balance sheet.
13. Key Takeaways from Cracker Barrel’s Q4 Results
It was good to see Cracker Barrel beat analysts’ EPS expectations this quarter. We were also excited its EBITDA outperformed Wall Street’s estimates by a wide margin. Zooming out, we think this was a good print with some key areas of upside. The stock traded up 9.4% to $33.49 immediately after reporting.
14. Is Now The Time To Buy Cracker Barrel?
Updated: March 15, 2026 at 10:35 PM EDT
We think that the latest earnings result is only one piece of the bigger puzzle. If you’re deciding whether to own Cracker Barrel, you should also grasp the company’s longer-term business quality and valuation.
We cheer for all companies serving everyday consumers, but in the case of Cracker Barrel, we’ll be cheering from the sidelines. To kick things off, its revenue growth was weak over the last six years, and analysts expect its demand to deteriorate over the next 12 months. While its favorable reputation gives it meaningful influence over consumers’ dining decisions, the downside is its declining EPS over the last six years makes it a less attractive asset to the public markets. On top of that, its projected EPS for the next year is lacking.
Cracker Barrel’s EV-to-EBITDA ratio based on the next 12 months is 12.4x. At this valuation, there’s a lot of good news priced in - we think there are better opportunities elsewhere.
Wall Street analysts have a consensus one-year price target of $33.50 on the company (compared to the current share price of $27.90).
Although the price target is bullish, readers should exercise caution because analysts tend to be overly optimistic. The firms they work for, often big banks, have relationships with companies that extend into fundraising, M&A advisory, and other rewarding business lines. As a result, they typically hesitate to say bad things for fear they will lose out. We at StockStory do not suffer from such conflicts of interest, so we’ll always tell it like it is.