
Dine Brands (DIN)
We wouldn’t recommend Dine Brands. Its plummeting sales and returns on capital show its profits are shrinking as demand fizzles out.― StockStory Analyst Team
1. News


2. Summary
Why We Think Dine Brands Will Underperform
Operating a franchise model, Dine Brands (NYSE:DIN) is a casual restaurant chain that owns the Applebee’s and IHOP banners.
- Sales stagnated over the last six years and signal the need for new growth strategies
- Sales over the last six years were less profitable as its earnings per share fell by 7.3% annually while its revenue was flat
- 7× net-debt-to-EBITDA ratio makes lenders less willing to extend additional capital, potentially necessitating dilutive equity offerings


Dine Brands’s quality isn’t up to par. There are more profitable opportunities elsewhere.
Why There Are Better Opportunities Than Dine Brands


At $28.23 per share, Dine Brands trades at 5.9x forward P/E. This is a cheap valuation multiple, but for good reason. You get what you pay for.
Our advice is to pay up for elite businesses whose advantages are tailwinds to earnings growth. Don’t get sucked into lower-quality businesses just because they seem like bargains. These mediocre businesses often never achieve a higher multiple as hoped, a phenomenon known as a “value trap”.
3. Dine Brands (DIN) Research Report: Q4 CY2025 Update
Casual restaurant chain Dine Brands (NYSE:DIN) missed Wall Street’s revenue expectations in Q4 CY2025, but sales rose 6.3% year on year to $217.6 million. Its non-GAAP profit of $1.46 per share was 38.2% above analysts’ consensus estimates.
Dine Brands (DIN) Q4 CY2025 Highlights:
- Revenue: $217.6 million vs analyst estimates of $226.2 million (6.3% year-on-year growth, 3.8% miss)
- Adjusted EPS: $1.46 vs analyst estimates of $1.06 (38.2% beat)
- Adjusted EBITDA: $59.8 million vs analyst estimates of $54.3 million (27.5% margin, 10.1% beat)
- EBITDA guidance for the upcoming financial year 2026 is $225 million at the midpoint, below analyst estimates of $227.1 million
- Operating Margin: 18.7%, up from 16.1% in the same quarter last year
- Free Cash Flow was -$8.55 million, down from $26.7 million in the same quarter last year
- Locations: 3,403 at quarter end, down from 3,438 in the same quarter last year
- Market Capitalization: $441.9 million
Company Overview
Operating a franchise model, Dine Brands (NYSE:DIN) is a casual restaurant chain that owns the Applebee’s and IHOP banners.
The company was founded in 1958 with the launch of IHOP, which stands for International House of Pancakes. IHOP is known for breakfast fare such as eggs, pancakes, and waffles, all washed down with some coffee or juice. The locations resemble classic American diners, complete with cozy booths and counter seating.
Applebee’s was founded in 1980 and acquired by Dine Brands in 2007. Applebee's is known for its lively bar and grill atmosphere and offers a diverse range of hearty American dishes such as burgers, pasta, and steaks. Beer and alcohol are served, which often attracts sports fans to the bar for game days.
More recently in 2022, Dine Brands acquired its third banner, Fuzzy's Taco Shop. At the time of its acquisition, Fuzzy's was based in Fort Worth Texas and had 138 restaurants across 18 states.
Dine Brands serves the middle-income family and overall casual diner. At Applebee’s, IHOP, and Fuzzy's, you’ll find parents who want to eat out where there is a kids menu and where other guests will not mind a little bit of noise from the little ones. You’ll also find groups of friends catching up over drinks or burgers. In short, Dine Brands offers good food at prices that won’t break the bank in a place that is lively and not too stuffy or fancy.
4. Sit-Down Dining
Sit-down restaurants offer a complete dining experience with table service. These establishments span various cuisines and are renowned for their warm hospitality and welcoming ambiance, making them perfect for family gatherings, special occasions, or simply unwinding. Their extensive menus range from appetizers to indulgent desserts and wines and cocktails. This space is extremely fragmented and competition includes everything from publicly-traded companies owning multiple chains to single-location mom-and-pop restaurants.
Multi-brand full-service restaurant competitors include Darden (NYSE:DRI), Brinker International (NYSE:EAT), Bloomin’ Brands (NASDAQ:BLMN), and The Cheesecake Factory (NASDAQ:CAKE).
5. Revenue Growth
A company’s long-term sales performance can indicate its overall quality. Any business can have short-term success, but a top-tier one grows for years.
With $879.3 million in revenue over the past 12 months, Dine Brands is a small restaurant chain, which sometimes brings disadvantages compared to larger competitors benefiting from better brand awareness and economies of scale.
As you can see below, Dine Brands struggled to increase demand as its $879.3 million of sales for the trailing 12 months was close to its revenue six years ago. This was mainly because it didn’t open many new restaurants and observed lower sales at existing, established dining locations.
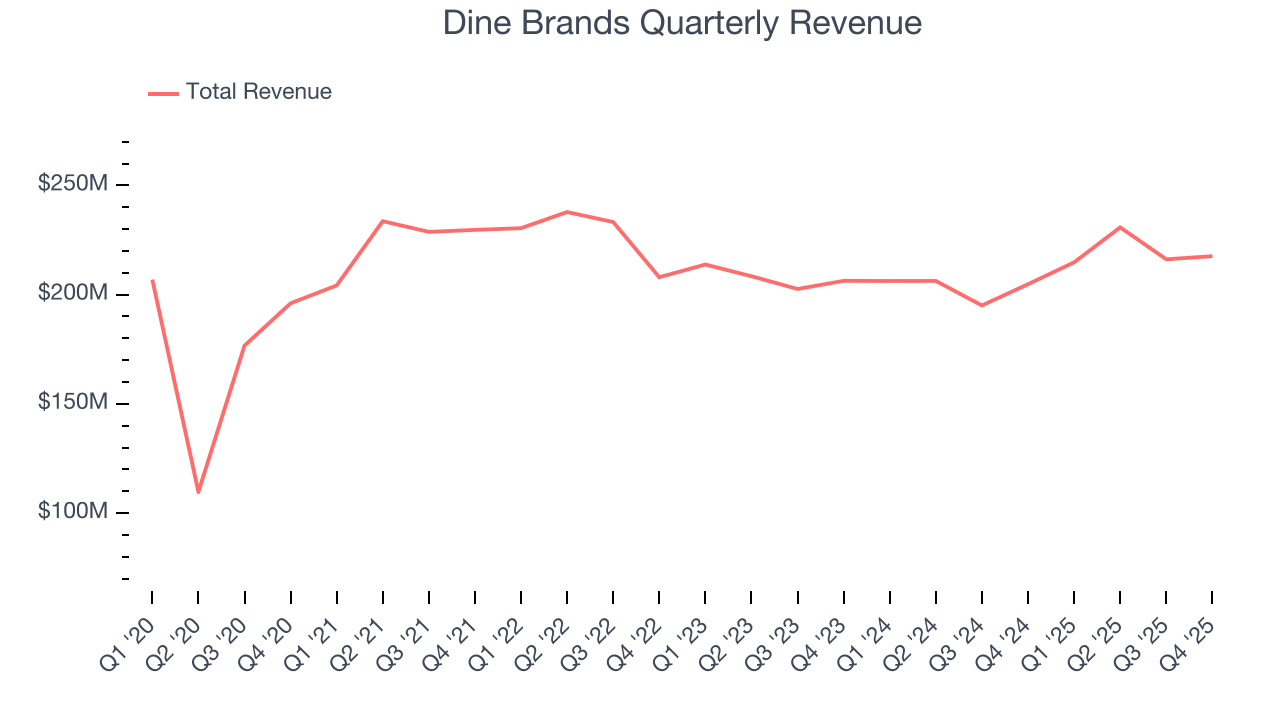
This quarter, Dine Brands’s revenue grew by 6.3% year on year to $217.6 million, missing Wall Street’s estimates.
Looking ahead, sell-side analysts expect revenue to grow 3.2% over the next 12 months. Although this projection suggests its newer menu offerings will spur better top-line performance, it is still below the sector average.
6. Restaurant Performance
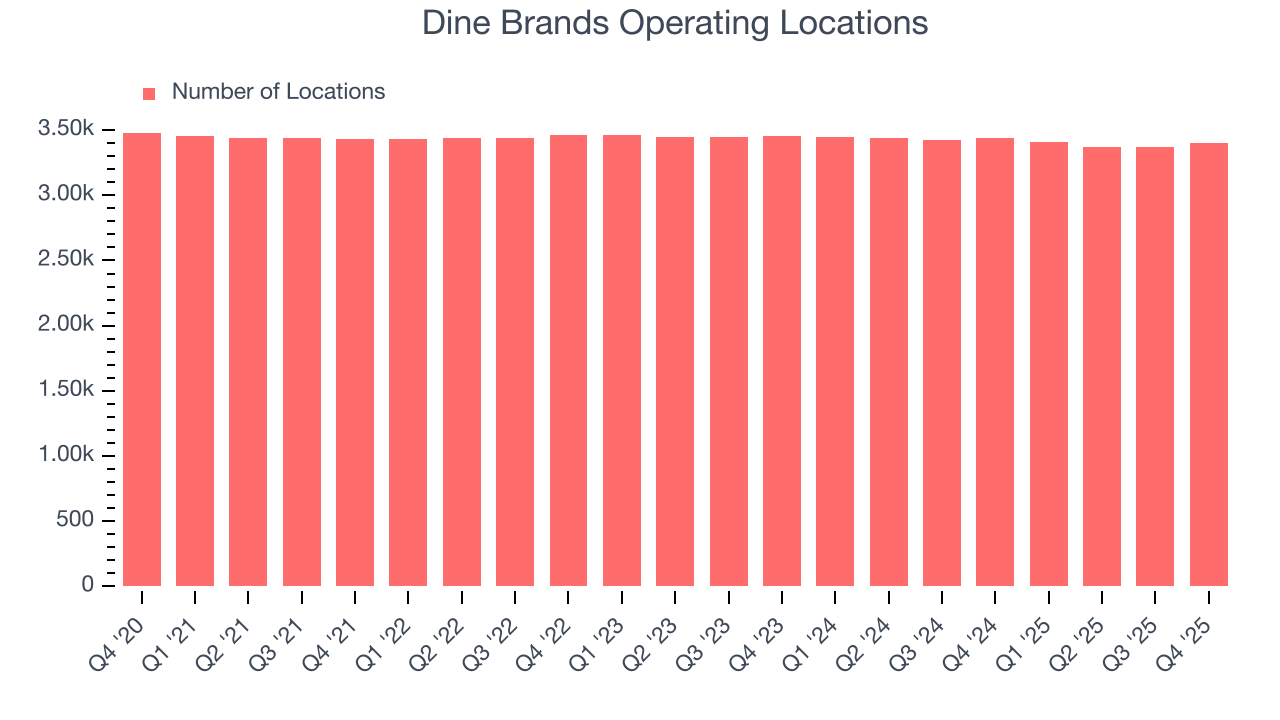
Number of Restaurants
Dine Brands operated 3,403 locations in the latest quarter, and over the last two years, has kept its restaurant count flat while other restaurant businesses have opted for growth.
When a chain doesn’t open many new restaurants, it usually means there’s stable demand for its meals and it’s focused on improving operational efficiency to increase profitability.
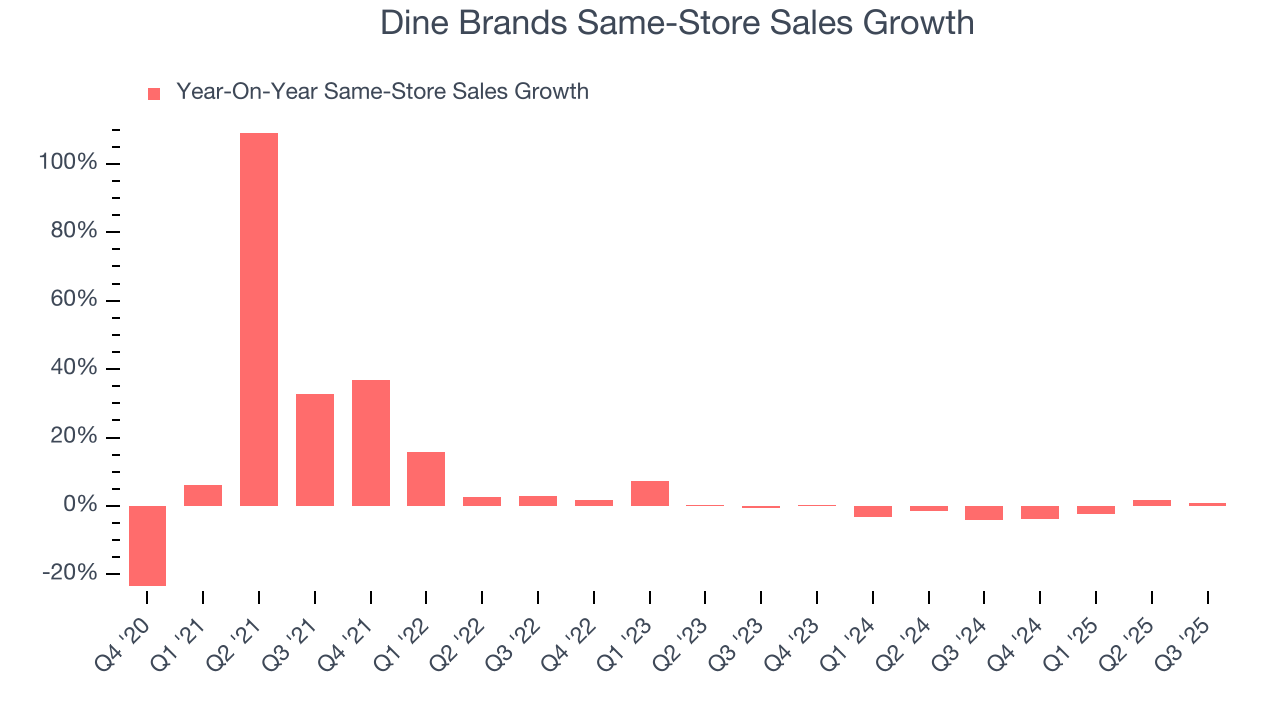
Same-Store Sales
A company's restaurant base only paints one part of the picture. When demand is high, it makes sense to open more. But when demand is low, it’s prudent to close some locations and use the money in other ways. Same-store sales is an industry measure of whether revenue is growing at those existing restaurants and is driven by customer visits (often called traffic) and the average spending per customer (ticket).
Dine Brands’s demand has been shrinking over the last two years as its same-store sales have averaged 1.8% annual declines. This performance isn’t ideal, and we’d be concerned if Dine Brands starts opening new restaurants to artificially boost revenue growth.
Note that Dine Brands reports its same-store sales intermittently, so some data points are missing in the chart below.
7. Gross Margin & Pricing Power
Dine Brands has great unit economics for a restaurant company, giving it ample room to invest in areas such as marketing and talent to grow its brand. As you can see below, it averaged an excellent 43.7% gross margin over the last two years. That means Dine Brands only paid its suppliers $56.32 for every $100 in revenue. 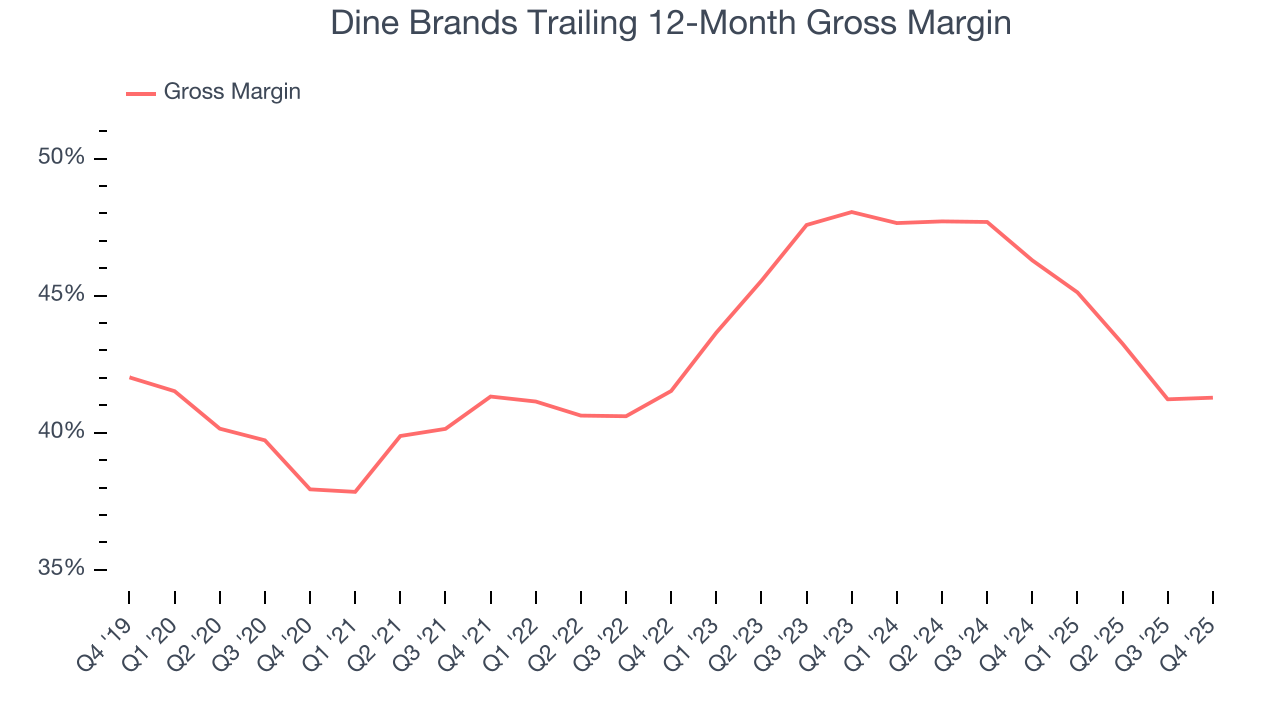
Dine Brands’s gross profit margin came in at 42.4% this quarter, in line with the same quarter last year. Zooming out, Dine Brands’s full-year margin has been trending down over the past 12 months, decreasing by 5 percentage points. If this move continues, it could suggest deteriorating pricing power and higher input costs (such as ingredients and transportation expenses).
8. Operating Margin
Dine Brands has been an efficient company over the last two years. It was one of the more profitable businesses in the restaurant sector, boasting an average operating margin of 19.7%. This result isn’t surprising as its high gross margin gives it a favorable starting point.
Analyzing the trend in its profitability, Dine Brands’s operating margin decreased by 4.3 percentage points over the last year. Even though its historical margin was healthy, shareholders will want to see Dine Brands become more profitable in the future.
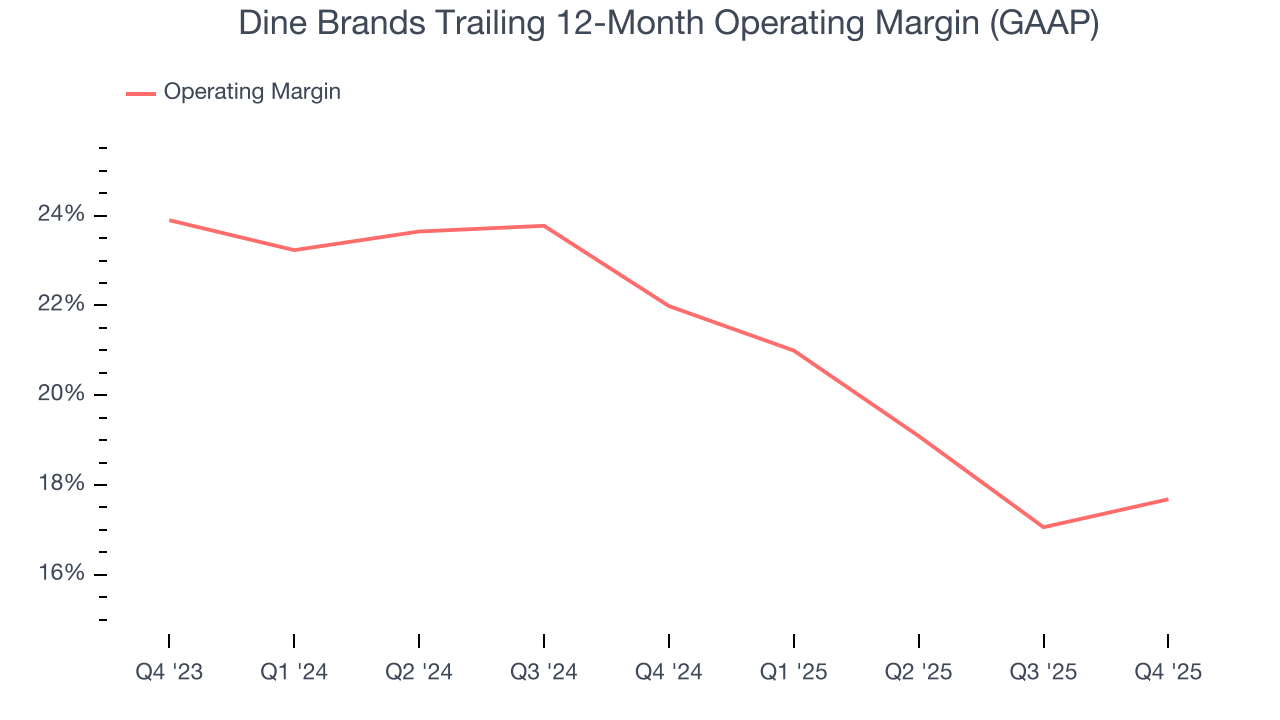
This quarter, Dine Brands generated an operating margin profit margin of 18.7%, up 2.6 percentage points year on year. The increase was encouraging, and because its operating margin rose more than its gross margin, we can infer it was more efficient with expenses such as marketing, and administrative overhead.
9. Earnings Per Share
Revenue trends explain a company’s historical growth, but the long-term change in earnings per share (EPS) points to the profitability of that growth – for example, a company could inflate its sales through excessive spending on advertising and promotions.
Sadly for Dine Brands, its EPS declined by 7.3% annually over the last six years while its revenue was flat. This tells us the company struggled because its fixed cost base made it difficult to adjust to choppy demand.
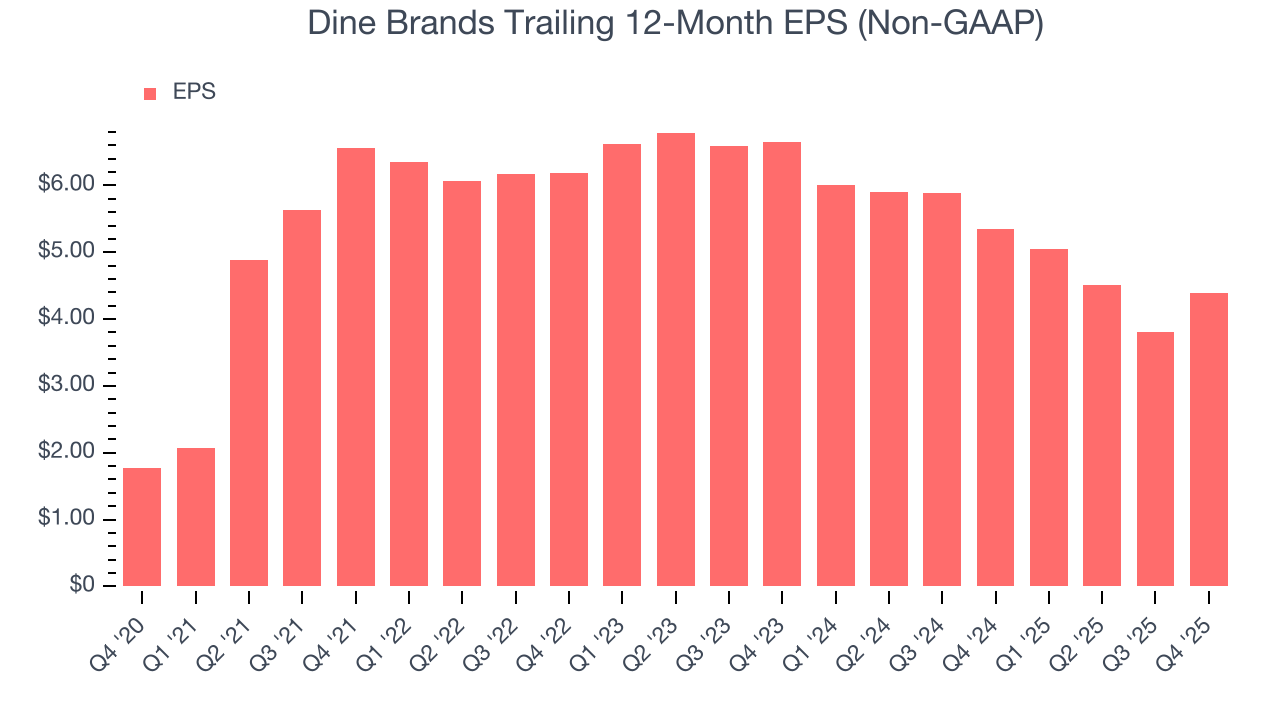
In Q4, Dine Brands reported adjusted EPS of $1.46, up from $0.87 in the same quarter last year. This print easily cleared analysts’ estimates, and shareholders should be content with the results. Over the next 12 months, Wall Street expects Dine Brands’s full-year EPS of $4.39 to grow 10%.
10. Cash Is King
Free cash flow isn't a prominently featured metric in company financials and earnings releases, but we think it's telling because it accounts for all operating and capital expenses, making it tough to manipulate. Cash is king.
Dine Brands has shown robust cash profitability, driven by its attractive business model that enables it to reinvest or return capital to investors. The company’s free cash flow margin averaged 8.7% over the last two years, quite impressive for a restaurant business.
Taking a step back, we can see that Dine Brands’s margin dropped by 5.5 percentage points over the last year. This decrease warrants extra caution because Dine Brands failed to grow its same-store sales. Its cash profitability could decay further if it tries to reignite growth by opening new restaurants.
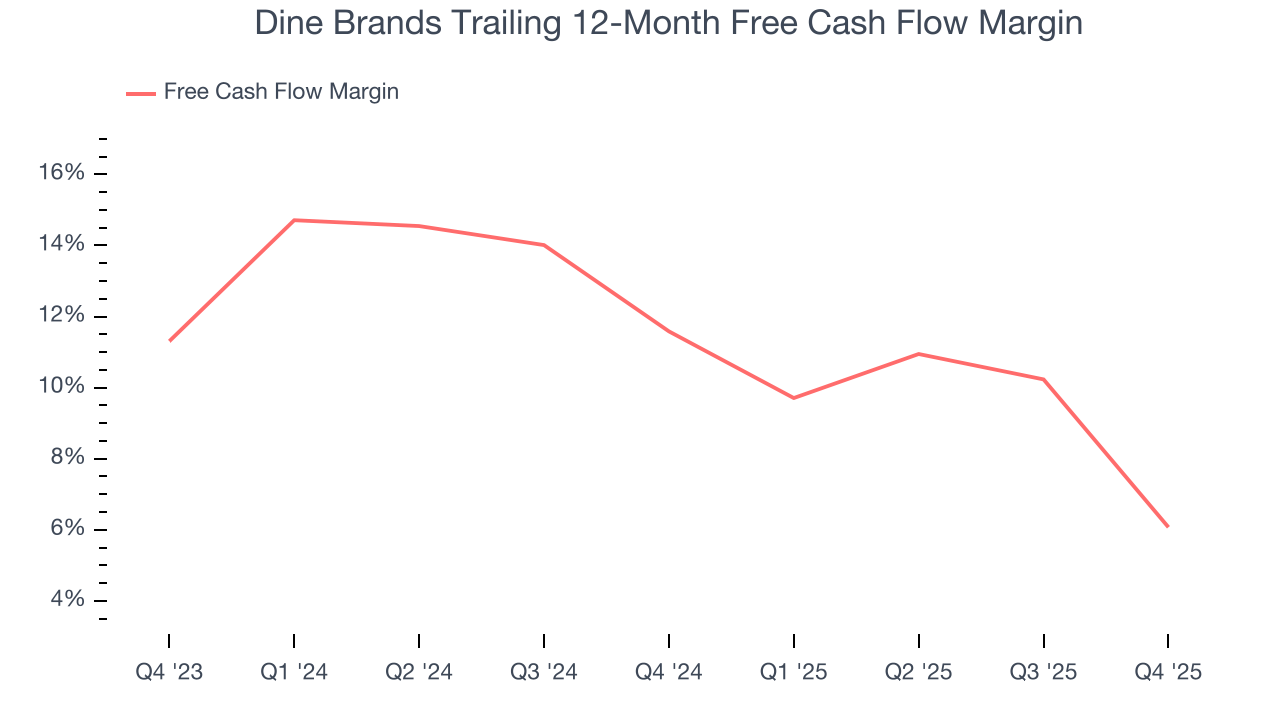
Dine Brands burned through $8.55 million of cash in Q4, equivalent to a negative 3.9% margin. The company’s cash flow turned negative after being positive in the same quarter last year, suggesting its historical struggles have dragged on.
11. Return on Invested Capital (ROIC)
EPS and free cash flow tell us whether a company was profitable while growing its revenue. But was it capital-efficient? A company’s ROIC explains this by showing how much operating profit it makes compared to the money it has raised (debt and equity).
Although Dine Brands hasn’t been the highest-quality company lately because of its poor revenue and EPS performance, it found a few growth initiatives in the past that worked out wonderfully. Its five-year average ROIC was 18.5%, splendid for a restaurant business.
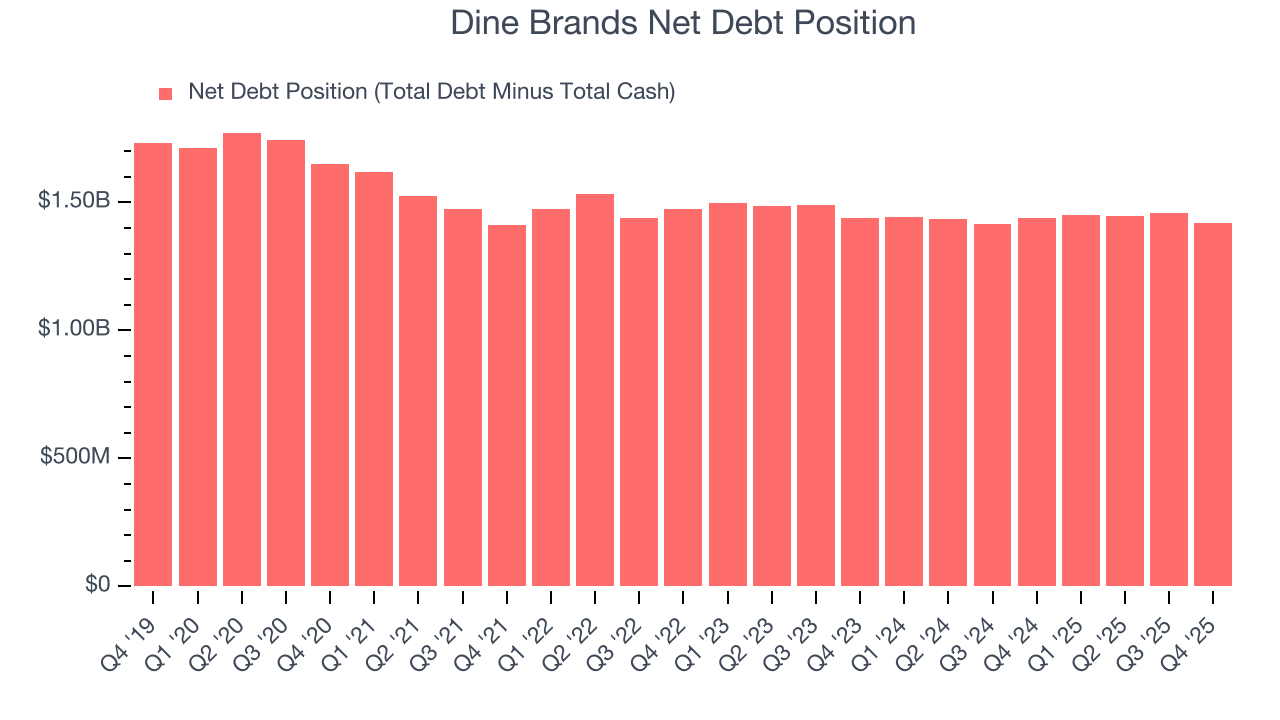
12. Balance Sheet Risk
Debt is a tool that can boost company returns but presents risks if used irresponsibly. As long-term investors, we aim to avoid companies taking excessive advantage of this instrument because it could lead to insolvency.
Dine Brands’s $1.6 billion of debt exceeds the $179.7 million of cash on its balance sheet. Furthermore, its 6× net-debt-to-EBITDA ratio (based on its EBITDA of $219.7 million over the last 12 months) shows the company is overleveraged.
At this level of debt, incremental borrowing becomes increasingly expensive and credit agencies could downgrade the company’s rating if profitability falls. Dine Brands could also be backed into a corner if the market turns unexpectedly – a situation we seek to avoid as investors in high-quality companies.
We hope Dine Brands can improve its balance sheet and remain cautious until it increases its profitability or pays down its debt.
13. Key Takeaways from Dine Brands’s Q4 Results
We were impressed by how significantly Dine Brands blew past analysts’ EBITDA expectations this quarter. We were also glad its EPS outperformed Wall Street’s estimates. On the other hand, its revenue missed and its full-year EBITDA guidance fell slightly short of Wall Street’s estimates. Overall, this print was mixed. Investors were likely hoping for more, and shares traded down 1% to $30.28 immediately following the results.
14. Is Now The Time To Buy Dine Brands?
Updated: March 14, 2026 at 10:53 PM EDT
Before making an investment decision, investors should account for Dine Brands’s business fundamentals and valuation in addition to what happened in the latest quarter.
We cheer for all companies serving everyday consumers, but in the case of Dine Brands, we’ll be cheering from the sidelines. First off, its revenue has declined over the last six years. While its stellar ROIC suggests it has been a well-run company historically, the downside is its shrinking same-store sales tell us it will need to change its strategy to succeed. On top of that, its declining EPS over the last six years makes it a less attractive asset to the public markets.
Dine Brands’s P/E ratio based on the next 12 months is 5.9x. While this valuation is optically cheap, the potential downside is huge given its shaky fundamentals. There are superior stocks to buy right now.
Wall Street analysts have a consensus one-year price target of $31.40 on the company (compared to the current share price of $28.23).