
Red Robin (RRGB)
Red Robin faces an uphill battle. Its falling revenue and negative returns on capital suggest it’s destroying value as demand fizzles out.― StockStory Analyst Team
1. News

2. Summary
Why We Think Red Robin Will Underperform
Known for its bottomless steak fries, Red Robin (NASDAQ:RRGB) is a chain of casual restaurants specializing in burgers and general American fare.
- Menu offerings have few die-hard fans as sales have declined by 1.4% annually over the last six years
- Forecasted revenue decline of 4.8% for the upcoming 12 months implies demand will fall even further
- High net-debt-to-EBITDA ratio of 7× could force the company to raise capital at unfavorable terms if market conditions deteriorate


Red Robin’s quality is inadequate. You should search for better opportunities.
Why There Are Better Opportunities Than Red Robin


Red Robin is trading at $3.42 per share, or 7.7x forward EV-to-EBITDA. This multiple is lower than most restaurant companies, but for good reason.
It’s better to pay up for high-quality businesses with higher long-term earnings potential rather than to buy lower-quality stocks because they appear cheap. These challenged businesses often don’t re-rate, a phenomenon known as a “value trap”.
3. Red Robin (RRGB) Research Report: Q4 CY2025 Update
Burger restaurant chain Red Robin (NASDAQ:RRGB) reported Q4 CY2025 results exceeding the market’s revenue expectations, but sales fell by 5.7% year on year to $269 million. Its non-GAAP loss of $0.41 per share was 30.2% above analysts’ consensus estimates.
Red Robin (RRGB) Q4 CY2025 Highlights:
- Revenue: $269 million vs analyst estimates of $264.3 million (5.7% year-on-year decline, 1.8% beat)
- Adjusted EPS: -$0.41 vs analyst estimates of -$0.59 (30.2% beat)
- Adjusted EBITDA: $11.79 billion vs analyst estimates of $8.78 million (43.81% margin, significant beat)
- EBITDA guidance for the upcoming financial year 2026 is $71.5 million at the midpoint, above analyst estimates of $69.04 million
- Operating Margin: -1.5%, in line with the same quarter last year
- Same-Store Sales fell 3.1% year on year (3.4% in the same quarter last year)
- Market Capitalization: $66.83 million
Company Overview
Known for its bottomless steak fries, Red Robin (NASDAQ:RRGB) is a chain of casual restaurants specializing in burgers and general American fare.
Initially started as a tavern called Sam’s, Red Robin Gourmet Burgers was founded in 1969 in Seattle, Washington. Today, the chain boasts a vast, customizable burger menu that includes everything from classic cheeseburgers to the daring Banzai burger featuring a Teriyaki-glazed patty topped with sweet grilled pineapple. For those who don’t love burgers, Red Robin also offers chicken entrees, salads, and kids’ meals such as corn dogs.
The core Red Robin customer is the everyday American family looking to celebrate a birthday, a little league victory, or a job promotion. With its reasonable prices for a sit-down restaurant, it can also serve as the destination for a family’s Thursday night dinner as well.
When you walk into a Red Robin, you'll typically find a spacious, lively setup. On average, these establishments cover anywhere from 4,000 to 5,500 square feet. Red Robin locations have ample seating, often using a mix of booths, tables, and a bar area, allowing for both intimate dinners and larger gatherings. To complete the look, there are typically bright colors (especially Red Robin’s signature red, warm woods, and playful memorabilia.
4. Sit-Down Dining
Sit-down restaurants offer a complete dining experience with table service. These establishments span various cuisines and are renowned for their warm hospitality and welcoming ambiance, making them perfect for family gatherings, special occasions, or simply unwinding. Their extensive menus range from appetizers to indulgent desserts and wines and cocktails. This space is extremely fragmented and competition includes everything from publicly-traded companies owning multiple chains to single-location mom-and-pop restaurants.
Competitors offering burgers and American fare in a sit-down restaurant format include Chili’s owner Brinker International (NYSE:EAT), Applebee’s owner Dine Brands (NYSE:DIN), Texas Roadhouse (NASDAQ:TXRH), and The Cheesecake Factory (NASDAQ:CAKE).
5. Revenue Growth
A company’s long-term sales performance can indicate its overall quality. Any business can have short-term success, but a top-tier one grows for years.
With $1.21 billion in revenue over the past 12 months, Red Robin is a mid-sized restaurant chain, which sometimes brings disadvantages compared to larger competitors benefiting from better brand awareness and economies of scale.
As you can see below, Red Robin’s demand was weak over the last six years. Its sales fell by 1.4% annually, a tough starting point for our analysis.
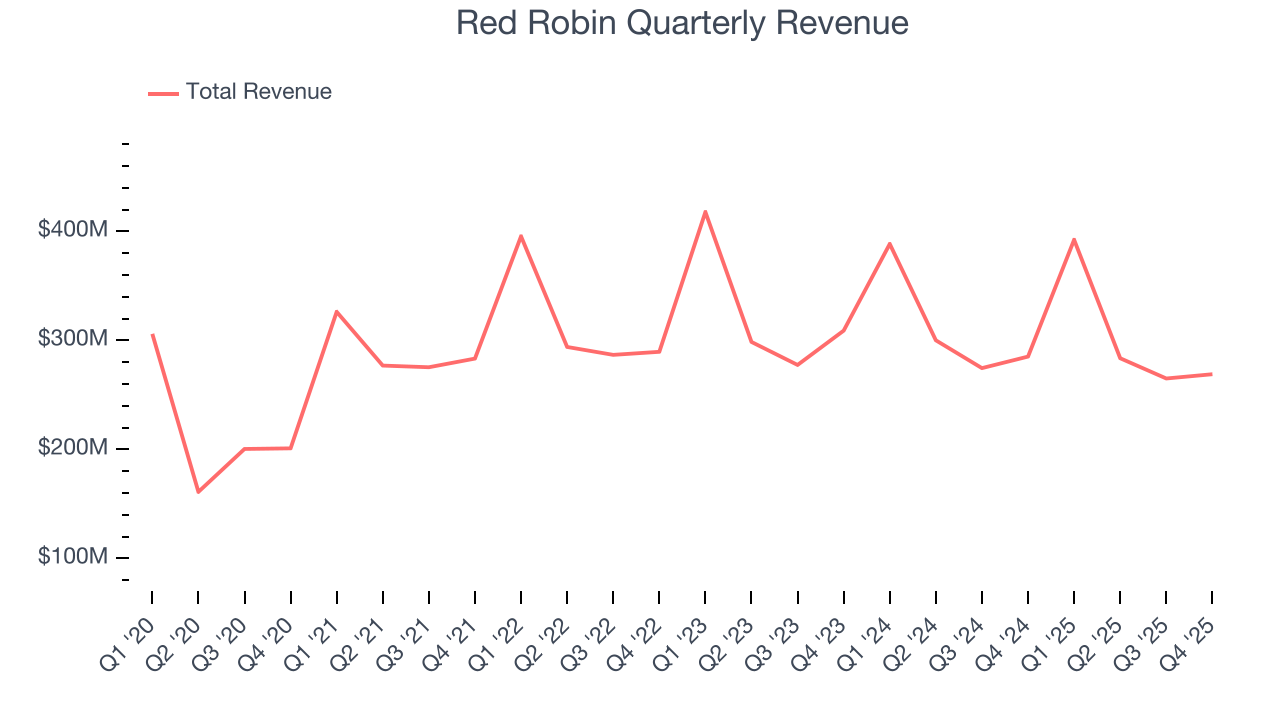
This quarter, Red Robin’s revenue fell by 5.7% year on year to $269 million but beat Wall Street’s estimates by 1.8%.
Looking ahead, sell-side analysts expect revenue to decline by 4.5% over the next 12 months, a deceleration versus the last six years. This projection is underwhelming and indicates its menu offerings will face some demand challenges.
6. Same-Store Sales
Same-store sales is an industry measure of whether revenue is growing at existing restaurants, and it is driven by customer visits (often called traffic) and the average spending per customer (ticket).
Red Robin’s demand within its existing dining locations has barely increased over the last two years as its same-store sales were flat.
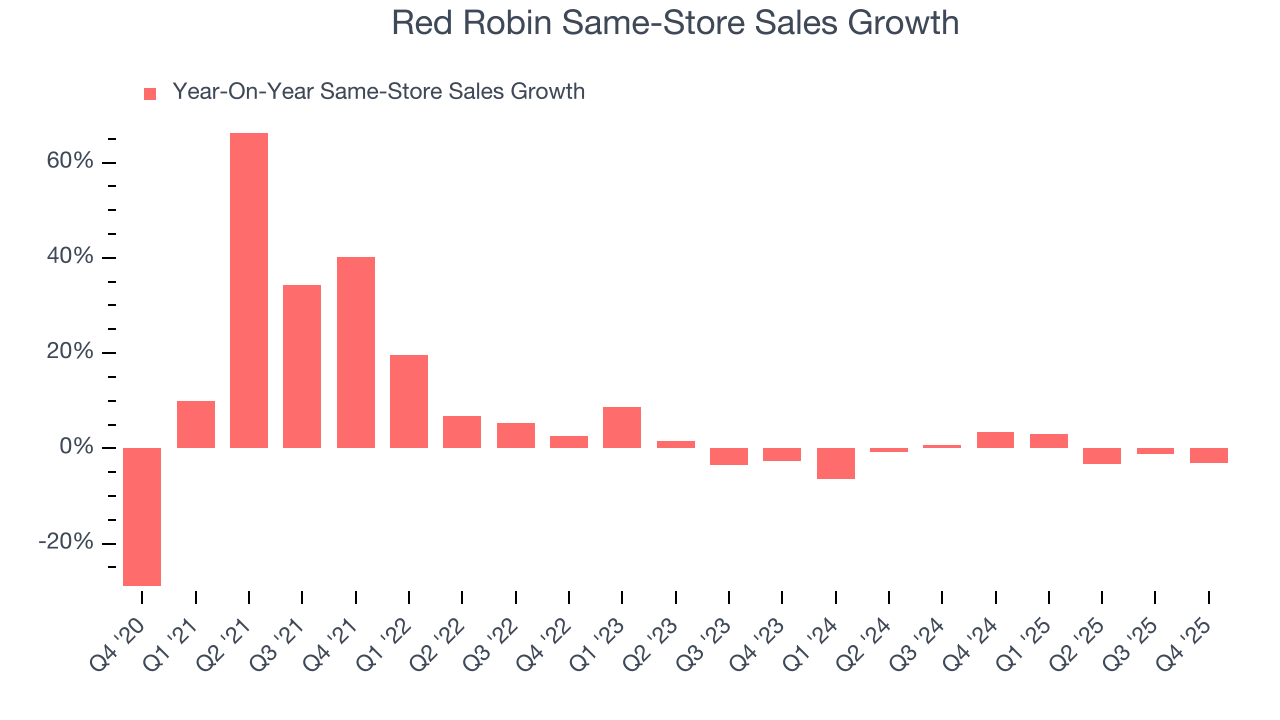
In the latest quarter, Red Robin’s same-store sales fell by 3.1% year on year. This decrease represents a further deceleration from its historical levels. We hope the business can get back on track.
7. Gross Margin & Pricing Power
Red Robin has bad unit economics for a restaurant company, signaling it operates in a competitive market and has little room for error if demand unexpectedly falls. As you can see below, it averaged a 13.4% gross margin over the last two years. Said differently, Red Robin had to pay a chunky $86.62 to its suppliers for every $100 in revenue. 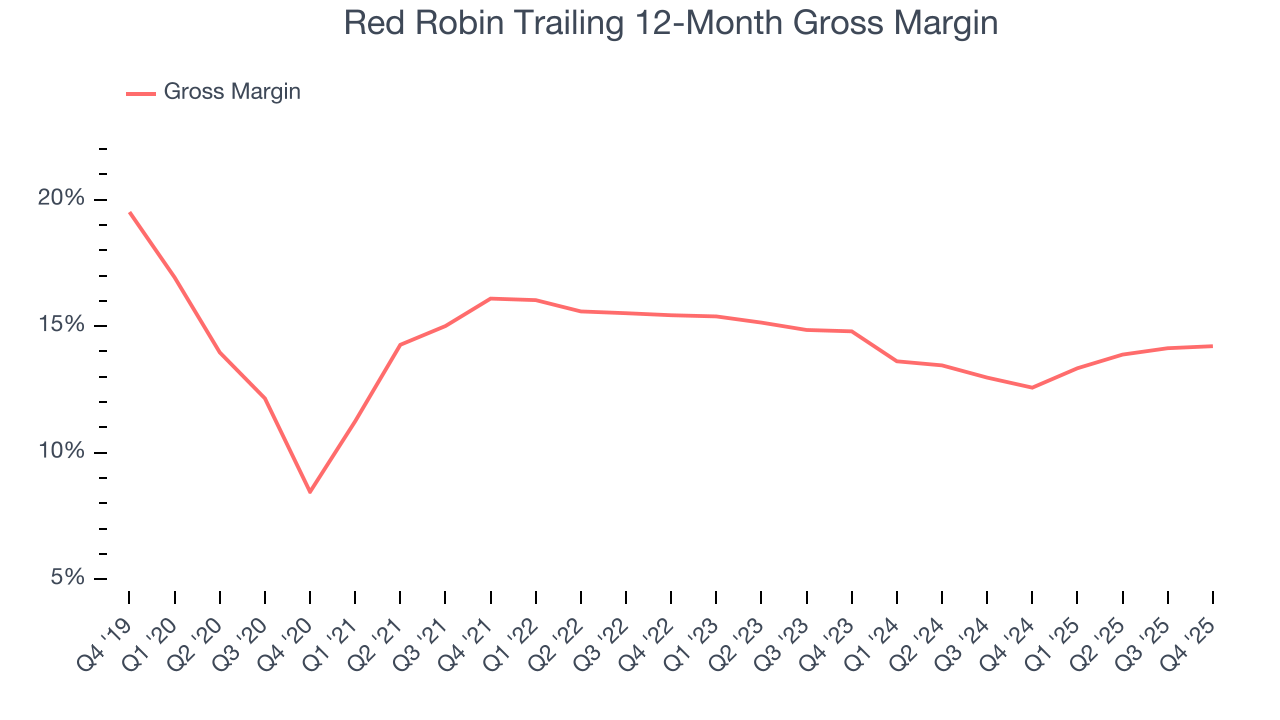
Red Robin produced a 13.2% gross profit margin in Q4, in line with the same quarter last year. On a wider time horizon, Red Robin’s full-year margin has been trending up over the past 12 months, increasing by 1.6 percentage points. If this move continues, it could suggest better unit economics due to some combination of stable to improving pricing power and input costs (such as ingredients and transportation expenses).
8. Operating Margin
Red Robin was roughly breakeven when averaging the last two years of quarterly operating profits, one of the worst outcomes in the restaurant sector. This result isn’t too surprising given its low gross margin as a starting point.
On the plus side, Red Robin’s operating margin rose by 2.5 percentage points over the last year.
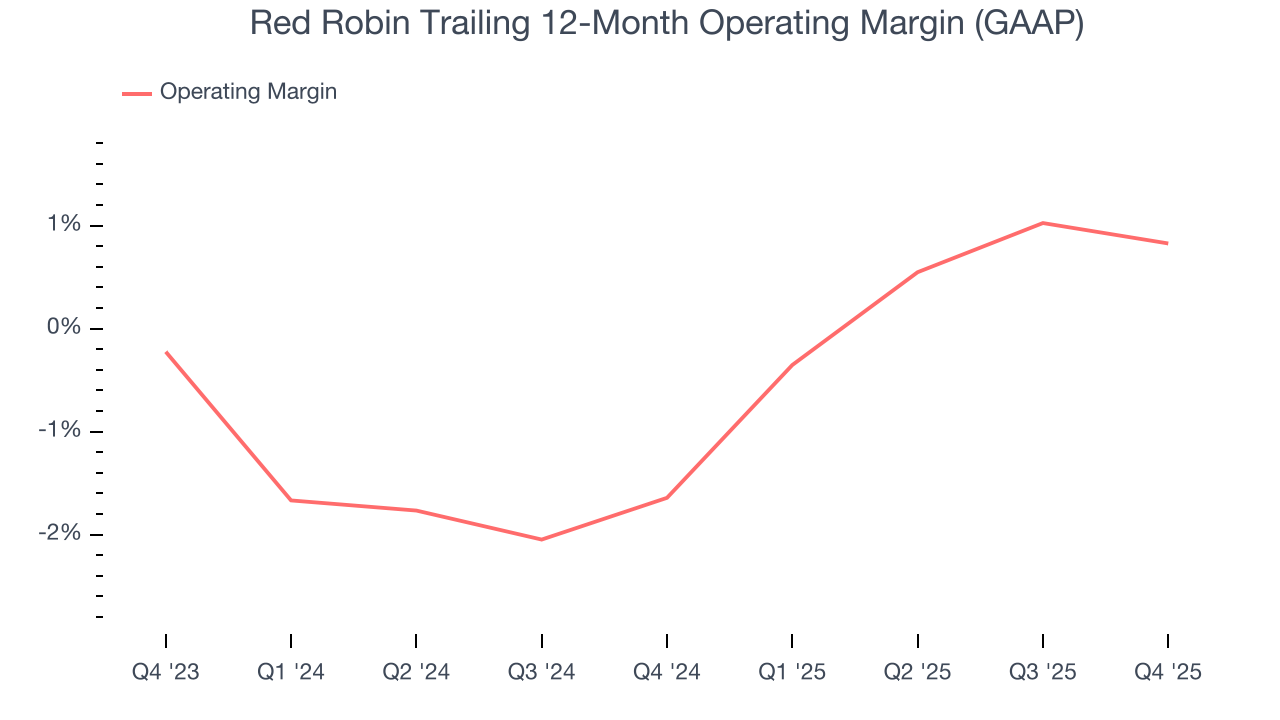
In Q4, Red Robin generated a negative 1.5% operating margin. The company's consistent lack of profits raise a flag.
9. Earnings Per Share
We track the long-term change in earnings per share (EPS) for the same reason as long-term revenue growth. Compared to revenue, however, EPS highlights whether a company’s growth is profitable.
Sadly for Red Robin, its EPS declined by 20.5% annually over the last six years, more than its revenue. This tells us the company struggled because its fixed cost base made it difficult to adjust to shrinking demand.
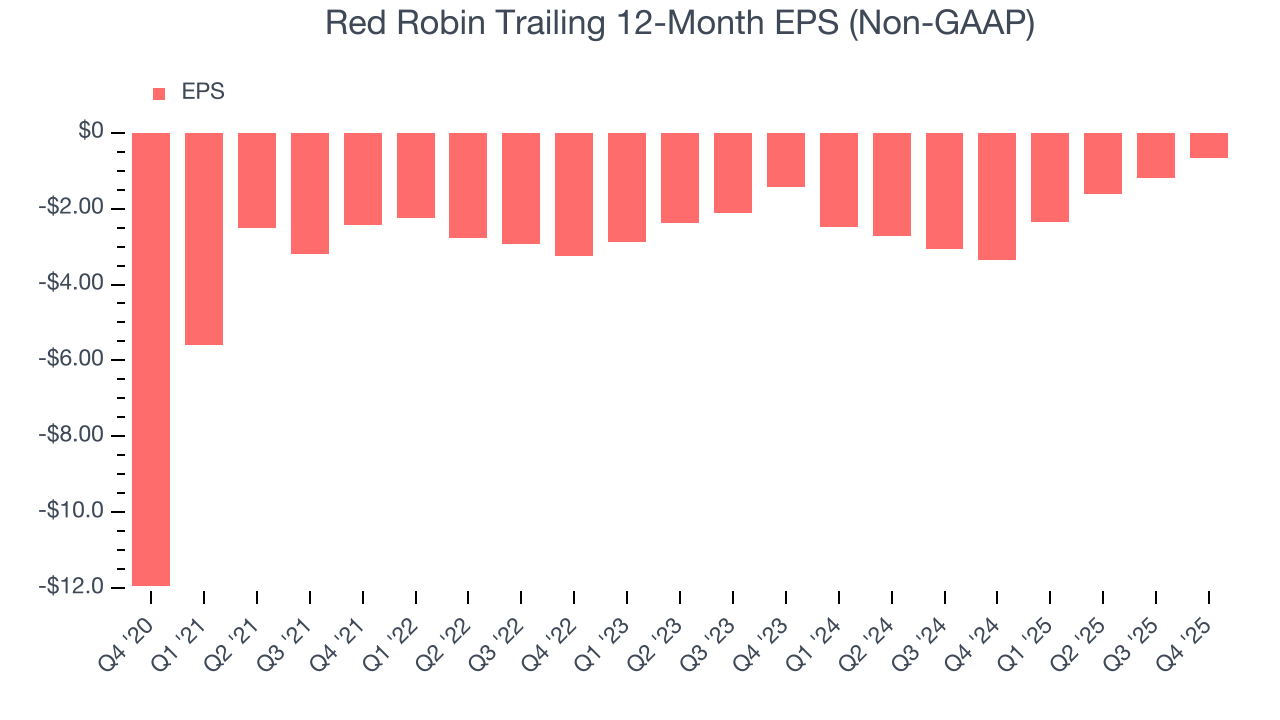
In Q4, Red Robin reported adjusted EPS of negative $0.41, up from negative $0.94 in the same quarter last year. This print easily cleared analysts’ estimates, and shareholders should be content with the results. Over the next 12 months, Wall Street expects Red Robin to improve its earnings losses. Analysts forecast its full-year EPS of negative $0.66 will advance to negative $0.47.
10. Return on Invested Capital (ROIC)
Growth gives us insight into a company’s long-term potential, but how capital-efficient was that growth? A company’s ROIC explains this by showing how much operating profit it makes compared to the money it has raised (debt and equity).
Red Robin’s five-year average ROIC was negative 1.6%, meaning management lost money while trying to expand the business. Its returns were among the worst in the restaurant sector.
11. Balance Sheet Assessment
Red Robin reported $29.54 million of cash and $513.9 million of debt on its balance sheet in the most recent quarter. As investors in high-quality companies, we primarily focus on two things: 1) that a company’s debt level isn’t too high and 2) that its interest payments are not excessively burdening the business.
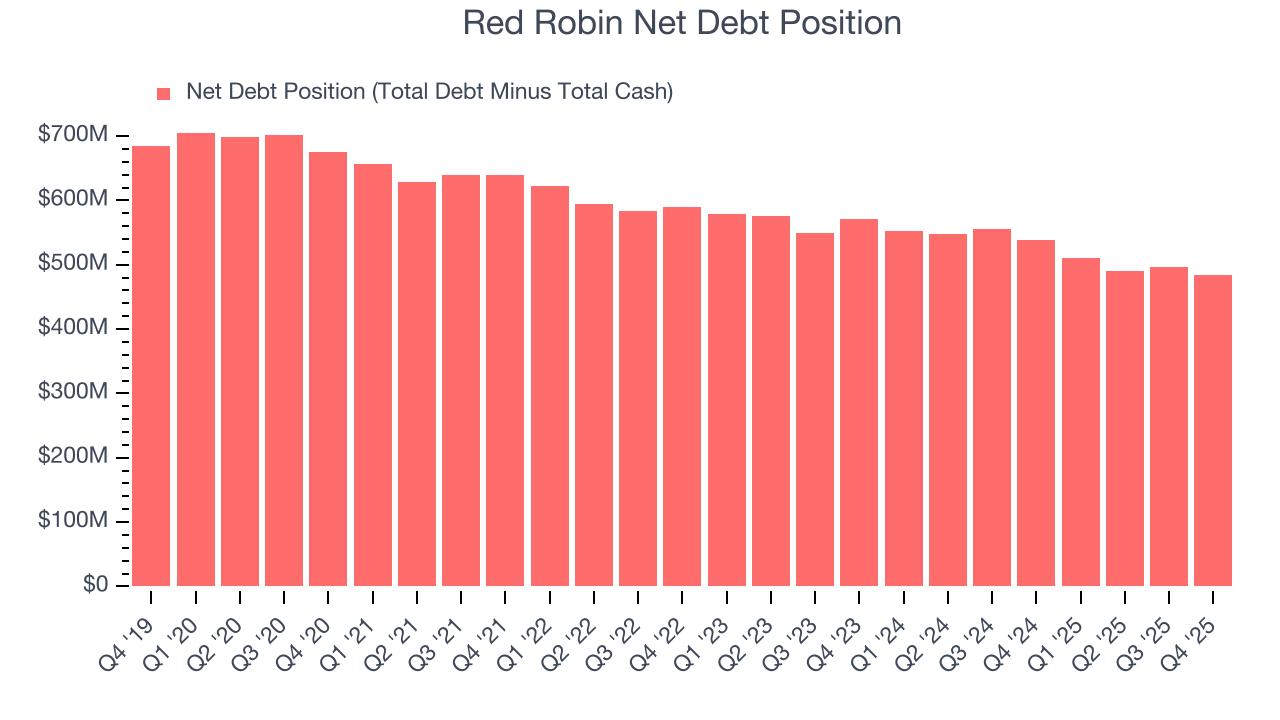
With $11.84 billion of EBITDA over the last 12 months, we view Red Robin’s 0.0× net-debt-to-EBITDA ratio as safe. We also see its $19.77 million of annual interest expenses as appropriate. The company’s profits give it plenty of breathing room, allowing it to continue investing in growth initiatives.
12. Key Takeaways from Red Robin’s Q4 Results
We were impressed by how significantly Red Robin blew past analysts’ EBITDA expectations this quarter. We were also glad its full-year EBITDA guidance exceeded Wall Street’s estimates. Zooming out, we think this was a solid print. The stock traded up 28.4% to $4.64 immediately after reporting.
13. Is Now The Time To Buy Red Robin?
Updated: March 16, 2026 at 10:51 PM EDT
A common mistake we notice when investors are deciding whether to buy a stock or not is that they simply look at the latest earnings results. Business quality and valuation matter more, so we urge you to understand these dynamics as well.
We cheer for all companies serving everyday consumers, but in the case of Red Robin, we’ll be cheering from the sidelines. To begin with, its revenue has declined over the last six years, and analysts expect its demand to deteriorate over the next 12 months. While its projected EPS for the next year implies the company’s fundamentals will improve, the downside is its declining EPS over the last six years makes it a less attractive asset to the public markets. On top of that, its relatively low ROIC suggests management has struggled to find compelling investment opportunities.
Red Robin’s EV-to-EBITDA ratio based on the next 12 months is 7.7x. This multiple tells us a lot of good news is priced in - we think there are better stocks to buy right now.
Wall Street analysts have a consensus one-year price target of $11.13 on the company (compared to the current share price of $3.42).
Although the price target is bullish, readers should exercise caution because analysts tend to be overly optimistic. The firms they work for, often big banks, have relationships with companies that extend into fundraising, M&A advisory, and other rewarding business lines. As a result, they typically hesitate to say bad things for fear they will lose out. We at StockStory do not suffer from such conflicts of interest, so we’ll always tell it like it is.