Cognex (CGNX)
We aren’t fans of Cognex. Its weak sales growth and declining returns on capital show its demand and profits are shrinking.― StockStory Analyst Team
1. News


2. Summary
Why We Think Cognex Will Underperform
Founded in 1981 when computer vision was in its infancy, Cognex (NASDAQ:CGNX) develops machine vision systems and software that help manufacturers and logistics companies automate quality inspection and tracking of products.
- Performance over the past five years shows its incremental sales were much less profitable, as its earnings per share fell by 1.3% annually
- Subscale operations are evident in its revenue base of $994.4 million, meaning it has fewer distribution channels than its larger rivals
- A positive is that its successful business model is illustrated by its impressive adjusted operating margin


Cognex is skating on thin ice. We’ve identified better opportunities elsewhere.
Why There Are Better Opportunities Than Cognex


Cognex is trading at $49.72 per share, or 40.1x forward P/E. This valuation multiple seems a bit much considering the tepid revenue growth profile.
There are stocks out there similarly priced with better business quality. We prefer owning these.
3. Cognex (CGNX) Research Report: Q4 CY2025 Update
Machine vision technology company Cognex (NASDAQ:CGNX) reported Q4 CY2025 results exceeding the market’s revenue expectations, with sales up 9.9% year on year to $252.3 million. On top of that, next quarter’s revenue guidance ($245 million at the midpoint) was surprisingly good and 7.1% above what analysts were expecting. Its non-GAAP profit of $0.27 per share was 22.9% above analysts’ consensus estimates.
Cognex (CGNX) Q4 CY2025 Highlights:
- Revenue: $252.3 million vs analyst estimates of $239.4 million (9.9% year-on-year growth, 5.4% beat)
- Adjusted EPS: $0.27 vs analyst estimates of $0.22 (22.9% beat)
- Adjusted EBITDA: $57.28 million vs analyst estimates of $45.33 million (22.7% margin, 26.3% beat)
- Revenue Guidance for Q1 CY2026 is $245 million at the midpoint, above analyst estimates of $228.8 million
- Adjusted EPS guidance for the upcoming financial year 2026 is $0.24 at the midpoint, missing analyst estimates by 78.8%
- Operating Margin: 14%, in line with the same quarter last year
- Free Cash Flow Margin: 28.7%, up from 21.5% in the same quarter last year
- Market Capitalization: $7.30 billion
Company Overview
Founded in 1981 when computer vision was in its infancy, Cognex (NASDAQ:CGNX) develops machine vision systems and software that help manufacturers and logistics companies automate quality inspection and tracking of products.
Cognex's technology essentially gives machines the ability to "see" and interpret visual information, much like human inspectors but with greater speed and consistency. The company's product lineup includes vision systems, sensors, barcode readers, and specialized software that can identify defects, verify assembly, guide robots, and read codes on products moving through production lines or distribution centers.
These systems use various forms of artificial intelligence, including deep learning and edge learning technology powered by neural networks, to perform complex tasks like detecting subtle product flaws that would traditionally require human judgment. For example, an automotive parts manufacturer might use Cognex vision systems to inspect engine components for microscopic defects at speeds impossible for human workers, while an e-commerce fulfillment center could deploy their barcode readers to accurately track thousands of packages per hour.
The company serves customers across numerous industries, with its largest revenue sources being logistics, automotive, and consumer electronics. In logistics, Cognex systems read barcodes and inspect packages for damage. In automotive manufacturing, they verify the proper assembly of components and inspect electric vehicle batteries. In consumer electronics, they ensure the precise alignment of tiny components in smartphones and other devices.
Cognex sells its products through both a direct sales force focused on large strategic accounts and a global network of distribution and integration partners that help reach smaller customers worldwide. The company maintains distribution centers in Massachusetts, Ireland, and Singapore to serve customers across the Americas, Europe, and Asia, respectively.
4. Specialized Technology
Companies in this sector, especially if they invest wisely, could see demand tailwinds as the world moves towards more IoT (Internet of Things), automation, and analytics. Enterprises across most industries will balk at taking these journeys solo and will enlist companies with expertise and scale in these areas. However, headwinds could include rising competition from larger technology firms, as digitization lowers barriers to entry in the space. Additionally, companies in the space will likely face evolving regulatory scrutiny over data privacy, particularly for surveillance and security technologies. This could make companies have to continually pivot and invest.
Cognex competes with other machine vision and automation technology providers including Keyence (TYO:6861), Omron (TYO:6645), and Teledyne Technologies (NYSE:TDY), as well as divisions of larger industrial automation companies like Rockwell Automation (NYSE:ROK).
5. Revenue Growth
Examining a company’s long-term performance can provide clues about its quality. Any business can put up a good quarter or two, but the best consistently grow over the long haul.
With $994.4 million in revenue over the past 12 months, Cognex is a small player in the business services space, which sometimes brings disadvantages compared to larger competitors benefiting from economies of scale and numerous distribution channels.
As you can see below, Cognex’s 4.2% annualized revenue growth over the last five years was mediocre. This shows it couldn’t generate demand in any major way and is a tough starting point for our analysis.
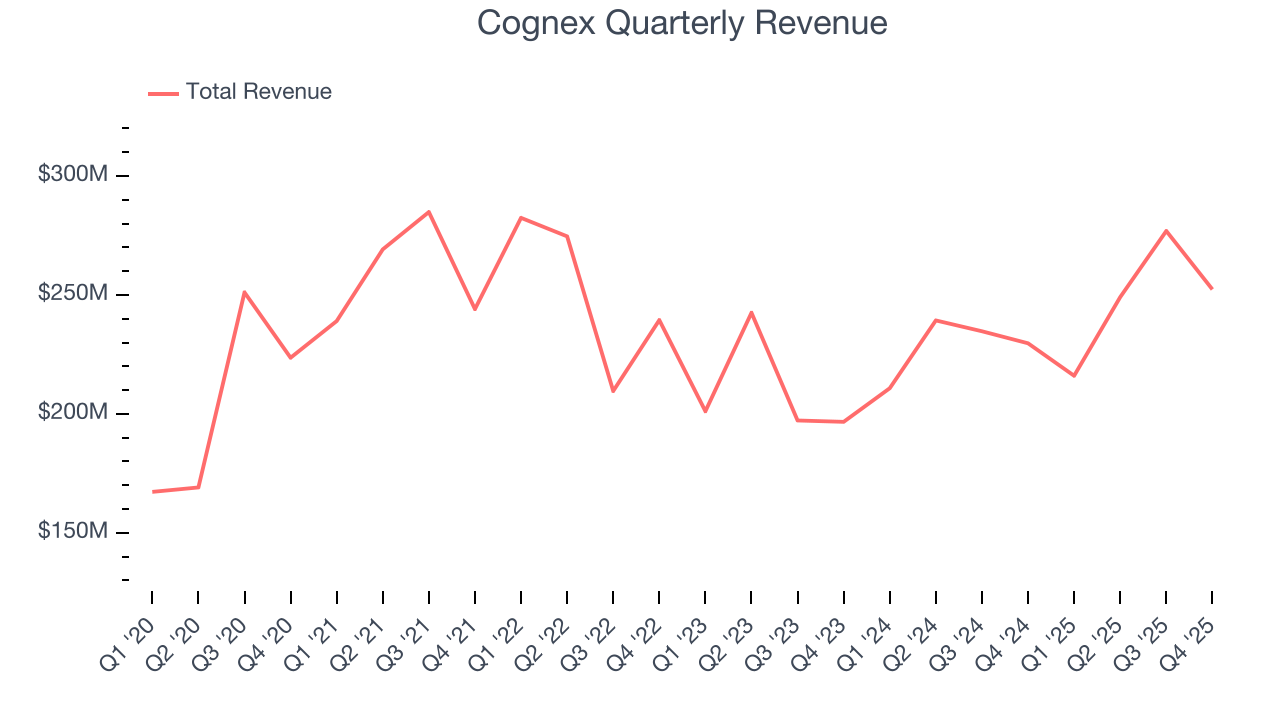
We at StockStory place the most emphasis on long-term growth, but within business services, a half-decade historical view may miss recent innovations or disruptive industry trends. Cognex’s annualized revenue growth of 9% over the last two years is above its five-year trend, suggesting its demand recently accelerated. 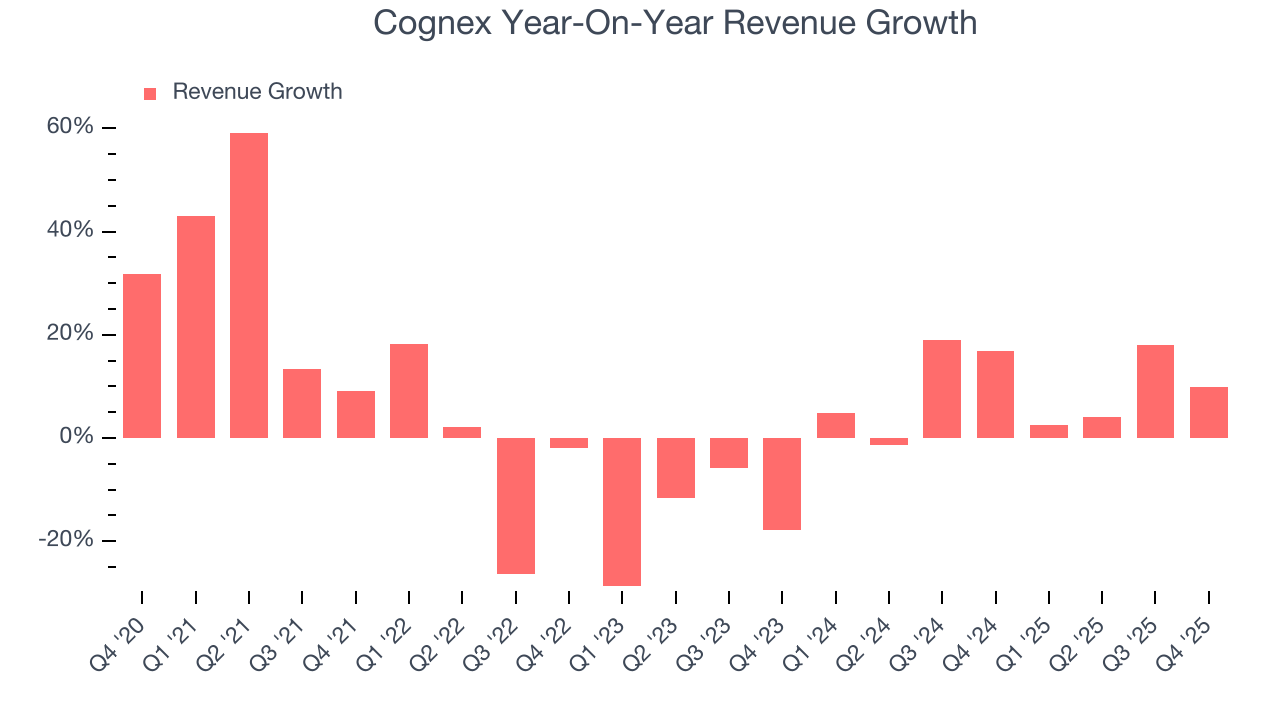
This quarter, Cognex reported year-on-year revenue growth of 9.9%, and its $252.3 million of revenue exceeded Wall Street’s estimates by 5.4%. Company management is currently guiding for a 13.4% year-on-year increase in sales next quarter.
Looking further ahead, sell-side analysts expect revenue to grow 4.7% over the next 12 months, a deceleration versus the last two years. This projection doesn't excite us and suggests its products and services will see some demand headwinds.
6. Operating Margin
Operating margin is one of the best measures of profitability because it tells us how much money a company takes home after subtracting all core expenses, like marketing and R&D.
Cognex has been a well-oiled machine over the last five years. It demonstrated elite profitability for a business services business, boasting an average operating margin of 20.2%.
Looking at the trend in its profitability, Cognex’s operating margin decreased by 14 percentage points over the last five years. This raises questions about the company’s expense base because its revenue growth should have given it leverage on its fixed costs, resulting in better economies of scale and profitability.
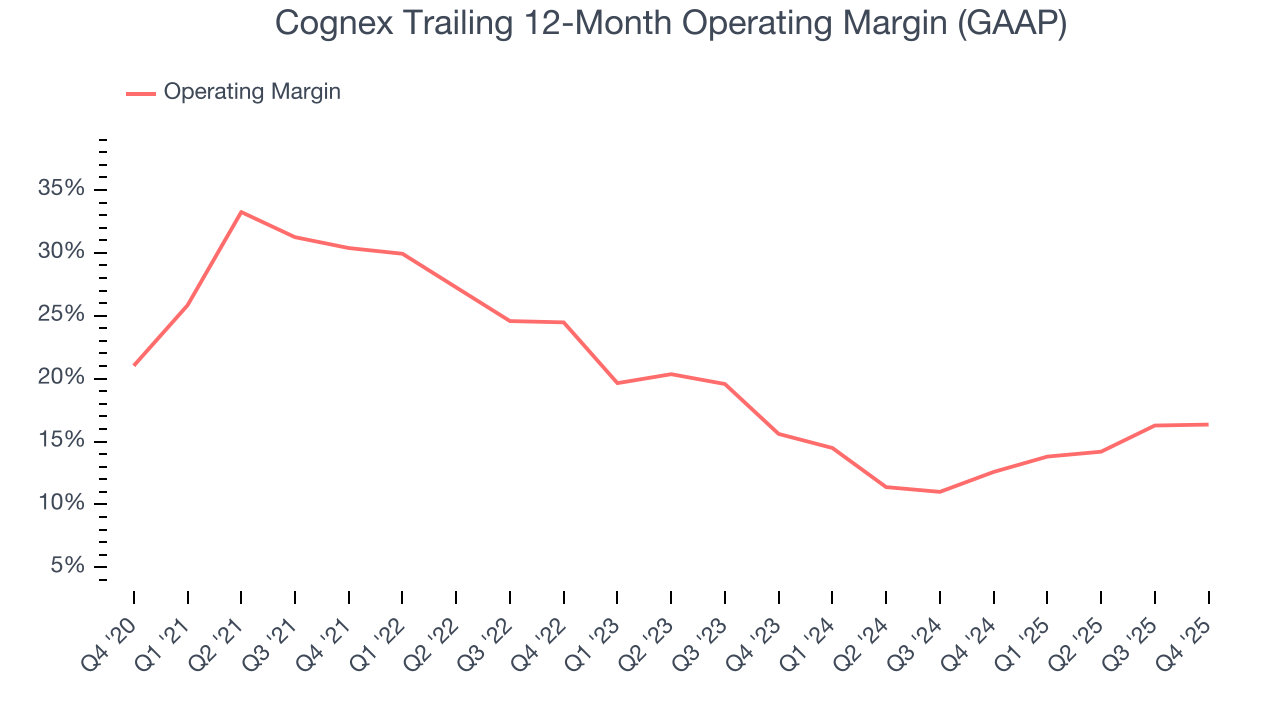
In Q4, Cognex generated an operating margin profit margin of 14%, in line with the same quarter last year. This indicates the company’s overall cost structure has been relatively stable.
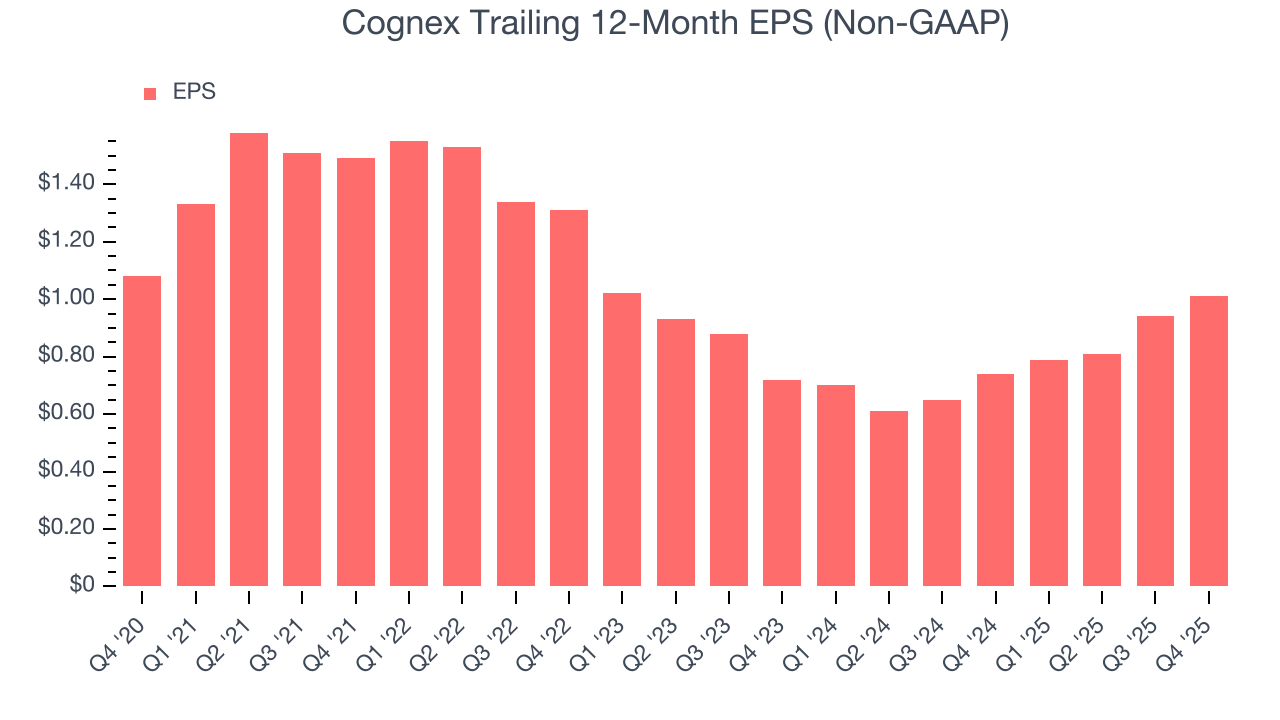
7. Earnings Per Share
Revenue trends explain a company’s historical growth, but the long-term change in earnings per share (EPS) points to the profitability of that growth – for example, a company could inflate its sales through excessive spending on advertising and promotions.
Sadly for Cognex, its EPS declined by 1.3% annually over the last five years while its revenue grew by 4.2%. This tells us the company became less profitable on a per-share basis as it expanded due to non-fundamental factors such as interest expenses and taxes.
We can take a deeper look into Cognex’s earnings to better understand the drivers of its performance. As we mentioned earlier, Cognex’s operating margin was flat this quarter but declined by 14 percentage points over the last five years. This was the most relevant factor (aside from the revenue impact) behind its lower earnings; interest expenses and taxes can also affect EPS but don’t tell us as much about a company’s fundamentals.
Like with revenue, we analyze EPS over a more recent period because it can provide insight into an emerging theme or development for the business.
For Cognex, its two-year annual EPS growth of 18.4% was higher than its five-year trend. This acceleration made it one of the faster-growing business services companies in recent history.
In Q4, Cognex reported adjusted EPS of $0.27, up from $0.20 in the same quarter last year. This print easily cleared analysts’ estimates, and shareholders should be content with the results. Over the next 12 months, Wall Street expects Cognex’s full-year EPS of $1.01 to grow 11.9%.
8. Cash Is King
If you’ve followed StockStory for a while, you know we emphasize free cash flow. Why, you ask? We believe that in the end, cash is king, and you can’t use accounting profits to pay the bills.
Cognex has shown terrific cash profitability, enabling it to reinvest, return capital to investors, and stay ahead of the competition while maintaining an ample cushion. The company’s free cash flow margin was among the best in the business services sector, averaging 20.5% over the last five years.
Taking a step back, we can see that Cognex’s margin dropped by 5 percentage points during that time. It may have ticked higher more recently, but shareholders are likely hoping for its margin to at least revert to its historical level. If the longer-term trend returns, it could signal it is in the middle of an investment cycle.
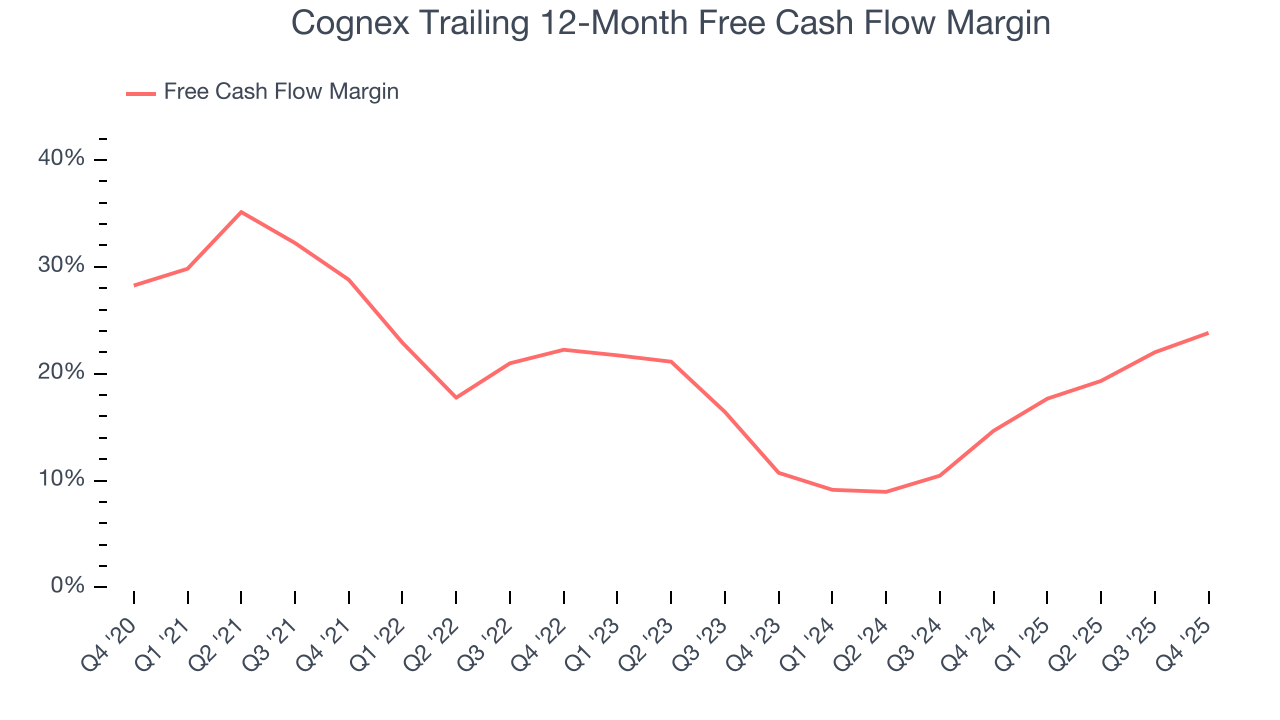
Cognex’s free cash flow clocked in at $72.31 million in Q4, equivalent to a 28.7% margin. This result was good as its margin was 7.2 percentage points higher than in the same quarter last year, but we wouldn’t read too much into the short term because investment needs can be seasonal, causing temporary swings. Long-term trends carry greater meaning.
9. Return on Invested Capital (ROIC)
EPS and free cash flow tell us whether a company was profitable while growing its revenue. But was it capital-efficient? Enter ROIC, a metric showing how much operating profit a company generates relative to the money it has raised (debt and equity).
Although Cognex hasn’t been the highest-quality company lately because of its poor bottom-line (EPS) performance, it historically found a few growth initiatives that worked. Its five-year average ROIC was 14.4%, higher than most business services businesses.
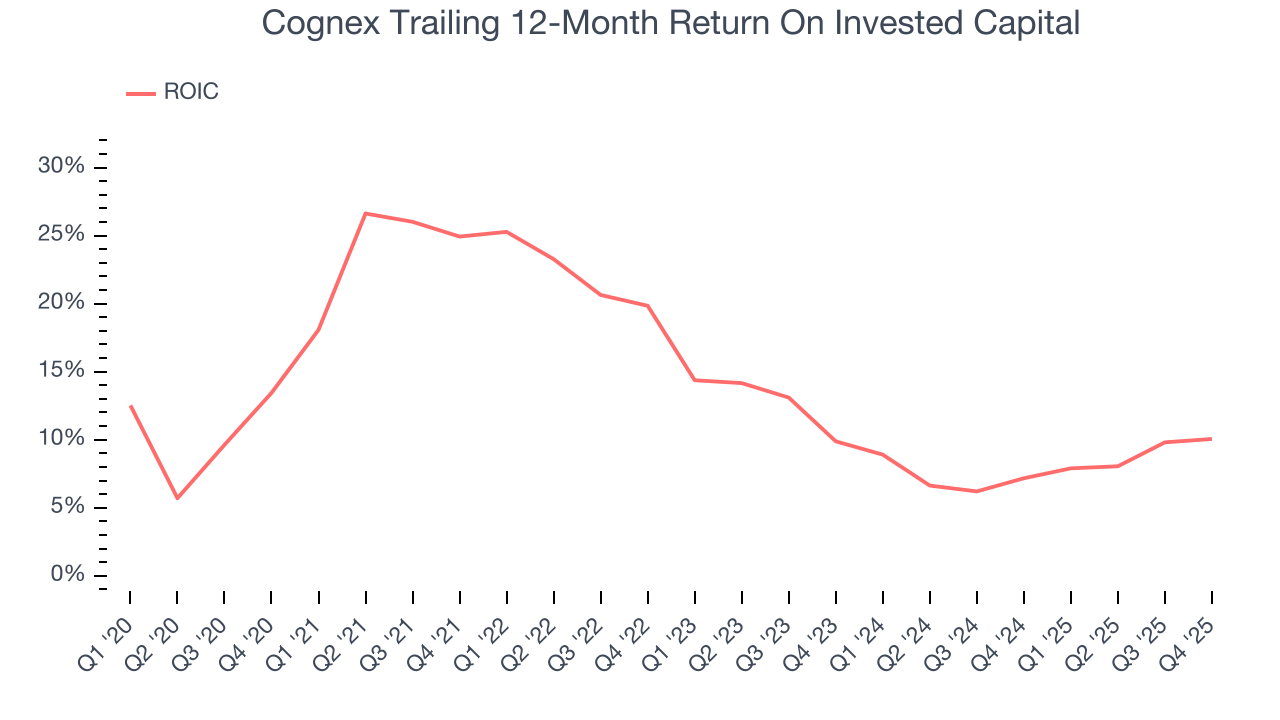
We like to invest in businesses with high returns, but the trend in a company’s ROIC is what often surprises the market and moves the stock price. Unfortunately, Cognex’s ROIC has decreased significantly over the last few years. We like what management has done in the past, but its declining returns are perhaps a symptom of fewer profitable growth opportunities.
10. Balance Sheet Assessment
Companies with more cash than debt have lower bankruptcy risk.
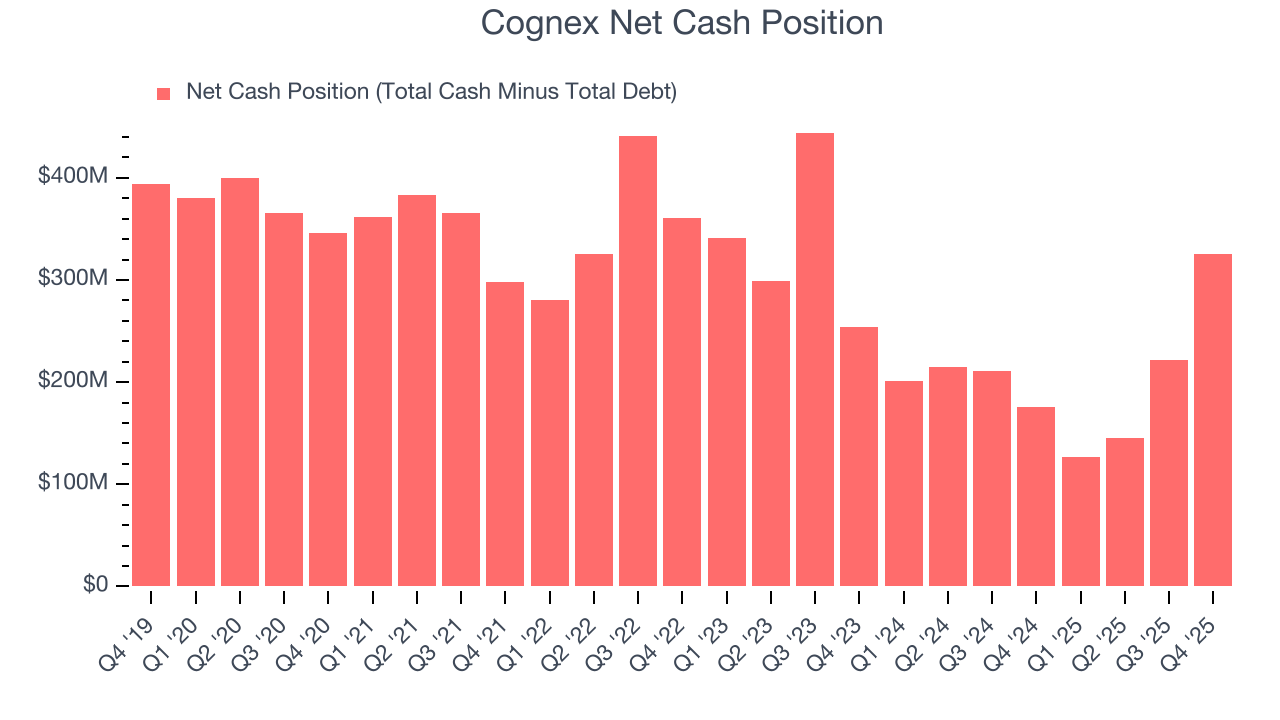
Cognex is a profitable, well-capitalized company with $337 million of cash and $11.72 million of debt on its balance sheet. This $325.2 million net cash position is 4.5% of its market cap and gives it the freedom to borrow money, return capital to shareholders, or invest in growth initiatives. Leverage is not an issue here.
11. Key Takeaways from Cognex’s Q4 Results
It was good to see Cognex beat analysts’ EPS expectations this quarter. We were also excited its revenue outperformed Wall Street’s estimates by a wide margin. On the other hand, its full-year EPS guidance missed. Zooming out, we think this was a solid print. The stock traded up 19% to $51.19 immediately after reporting.
12. Is Now The Time To Buy Cognex?
Updated: March 18, 2026 at 11:59 PM EDT
Before investing in or passing on Cognex, we urge you to understand the company’s business quality (or lack thereof), valuation, and the latest quarterly results - in that order.
Cognex isn’t a terrible business, but it isn’t one of our picks. To begin with, its revenue growth was mediocre over the last five years. While its powerful free cash flow generation enables it to stay ahead of the competition through consistent reinvestment of profits, the downside is its diminishing returns show management's prior bets haven't worked out. On top of that, its declining EPS over the last five years makes it a less attractive asset to the public markets.
Cognex’s P/E ratio based on the next 12 months is 40.1x. At this valuation, there’s a lot of good news priced in - we think other companies feature superior fundamentals at the moment.
Wall Street analysts have a consensus one-year price target of $65.50 on the company (compared to the current share price of $49.72).
Although the price target is bullish, readers should exercise caution because analysts tend to be overly optimistic. The firms they work for, often big banks, have relationships with companies that extend into fundraising, M&A advisory, and other rewarding business lines. As a result, they typically hesitate to say bad things for fear they will lose out. We at StockStory do not suffer from such conflicts of interest, so we’ll always tell it like it is.