
Cincinnati Financial (CINF)
Cincinnati Financial doesn’t impress us. Its forecasted earnings for the next 12 months are weak, suggesting a rocky road for its share price.― StockStory Analyst Team
1. News


2. Summary
Why Cincinnati Financial Is Not Exciting
Founded in 1950 by independent insurance agents seeking stable market options for their clients, Cincinnati Financial (NASDAQ:CINF) provides property casualty insurance, life insurance, and related financial services through independent agencies across 46 states.
- Estimated book value per share growth of 4.3% for the next 12 months implies profitability will slow from its two-year trend
- One positive is that its incremental sales over the last five years have been more profitable as its earnings per share increased by 19.4% annually, topping its revenue gains


Cincinnati Financial doesn’t satisfy our quality benchmarks. We’re looking for better stocks elsewhere.
Why There Are Better Opportunities Than Cincinnati Financial


At $159.36 per share, Cincinnati Financial trades at 1.5x forward P/B. This multiple is high given its weaker fundamentals.
We’d rather pay up for companies with elite fundamentals than get a decent price on a poor one. High-quality businesses often have more durable earnings power, helping us sleep well at night.
3. Cincinnati Financial (CINF) Research Report: Q4 CY2025 Update
Property casualty insurer Cincinnati Financial (NASDAQ:CINF) reported Q4 CY2025 results beating Wall Street’s revenue expectations, with sales up 16.5% year on year to $3.09 billion. Its non-GAAP profit of $3.37 per share was 16.6% above analysts’ consensus estimates.
Cincinnati Financial (CINF) Q4 CY2025 Highlights:
- Net Premiums Earned: $2.59 billion vs analyst estimates of $2.56 billion (9.6% year-on-year growth, 1.4% beat)
- Revenue: $3.09 billion vs analyst estimates of $2.92 billion (16.5% year-on-year growth, 5.8% beat)
- Pre-tax Profit: $840 million (27.2% margin)
- Adjusted EPS: $3.37 vs analyst estimates of $2.89 (16.6% beat)
- Book Value per Share: $102.35 vs analyst estimates of $100.27 (14.9% year-on-year growth, 2.1% beat)
- Market Capitalization: $26.94 billion
Company Overview
Founded in 1950 by independent insurance agents seeking stable market options for their clients, Cincinnati Financial (NASDAQ:CINF) provides property casualty insurance, life insurance, and related financial services through independent agencies across 46 states.
The company operates through five segments: Commercial Lines, Personal Lines, Excess and Surplus Lines, Life Insurance, and Investments. Its Commercial Lines segment offers businesses protection against liability, property damage, workers' compensation, and commercial auto risks. The Personal Lines segment provides auto and homeowner coverage to individuals, while the Excess and Surplus Lines segment specializes in harder-to-insure business risks that standard markets typically avoid.
Cincinnati Financial's business model centers on building long-term relationships with independent insurance agencies. These agencies serve as the exclusive distribution channel for the company's products, with underwriters assigned to specific agencies to provide expertise and support. This agency-centered approach allows Cincinnati Financial to maintain stability in the insurance marketplace while gaining local market insights.
For example, a manufacturing business might work with a Cincinnati Financial agency to obtain coverage for its facilities, liability protection, and workers' compensation through the Commercial Lines segment. If that same business has unique risks that standard policies won't cover, the agency can access specialty coverage through Cincinnati Specialty Underwriters in the Excess and Surplus Lines segment.
The company generates revenue primarily through insurance premiums and investment income from its portfolio of fixed-maturity securities and equity investments. Cincinnati Financial maintains a buy-and-hold investment strategy, focusing on a laddered portfolio approach to manage interest rate risk rather than making large-scale changes in anticipation of market movements.
4. Property & Casualty Insurance
Property & Casualty (P&C) insurers protect individuals and businesses against financial loss from damage to property or from legal liability. This is a cyclical industry, and the sector benefits when there is 'hard market', characterized by strong premium rate increases that outpace loss and cost inflation, resulting in robust underwriting margins. The opposite is true in a 'soft market'. Interest rates also matter, as they determine the yields earned on fixed-income portfolios. On the other hand, P&C insurers face a major secular headwind from the increasing frequency and severity of catastrophe losses due to climate change. Furthermore, the liability side of the business is pressured by 'social inflation'—the trend of rising litigation costs and larger jury awards.
Cincinnati Financial competes with other property and casualty insurers including The Travelers Companies (NYSE:TRV), Chubb Limited (NYSE:CB), The Hartford Financial Services Group (NYSE:HIG), and Progressive Corporation (NYSE:PGR). In the life insurance segment, it faces competition from companies like MetLife (NYSE:MET) and Prudential Financial (NYSE:PRU).
5. Revenue Growth
Big picture, insurers generate revenue from three key sources. The first is the core business of underwriting policies. The second source is income from investing the “float” (premiums collected upfront not yet paid out as claims) in assets such as fixed-income assets and equities. The third is fees from various sources such as policy administration, annuities, or other value-added services. Thankfully, Cincinnati Financial’s 11.3% annualized revenue growth over the last five years was impressive. Its growth beat the average insurance company and shows its offerings resonate with customers, a helpful starting point for our analysis.
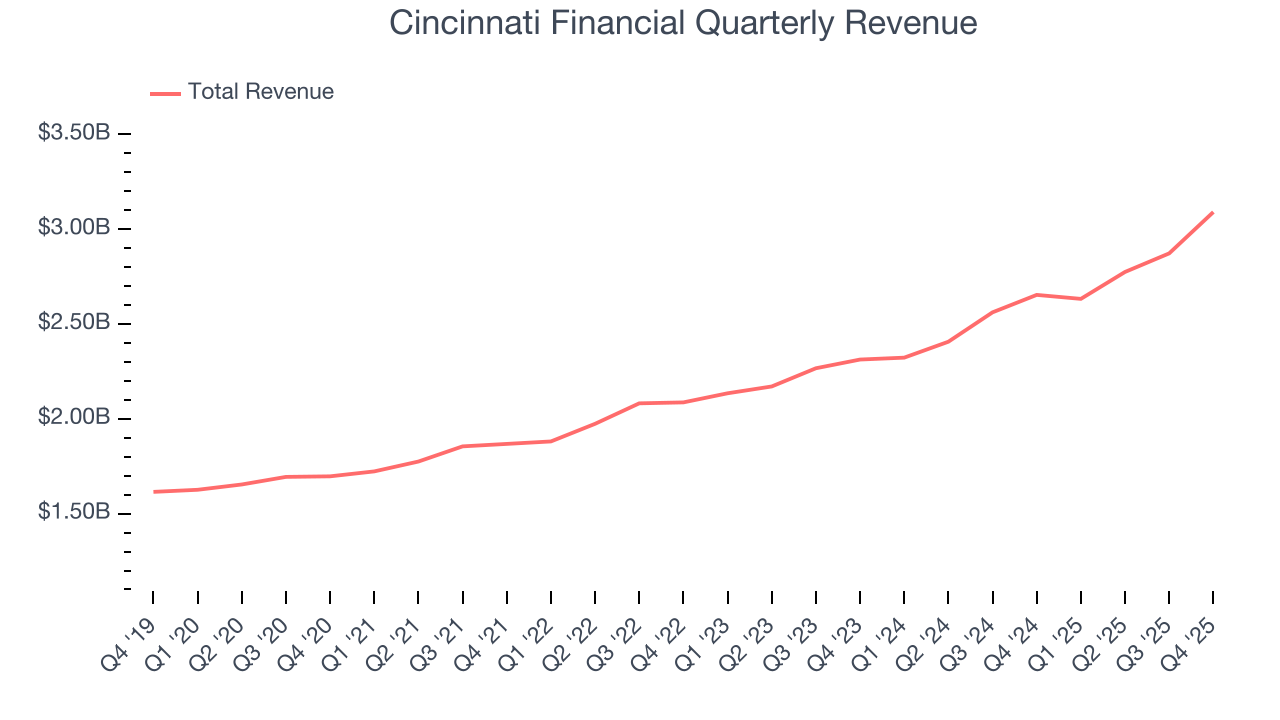
Long-term growth is the most important, but within financials, a half-decade historical view may miss recent interest rate changes and market returns. Cincinnati Financial’s annualized revenue growth of 13.1% over the last two years is above its five-year trend, suggesting its demand was strong and recently accelerated. 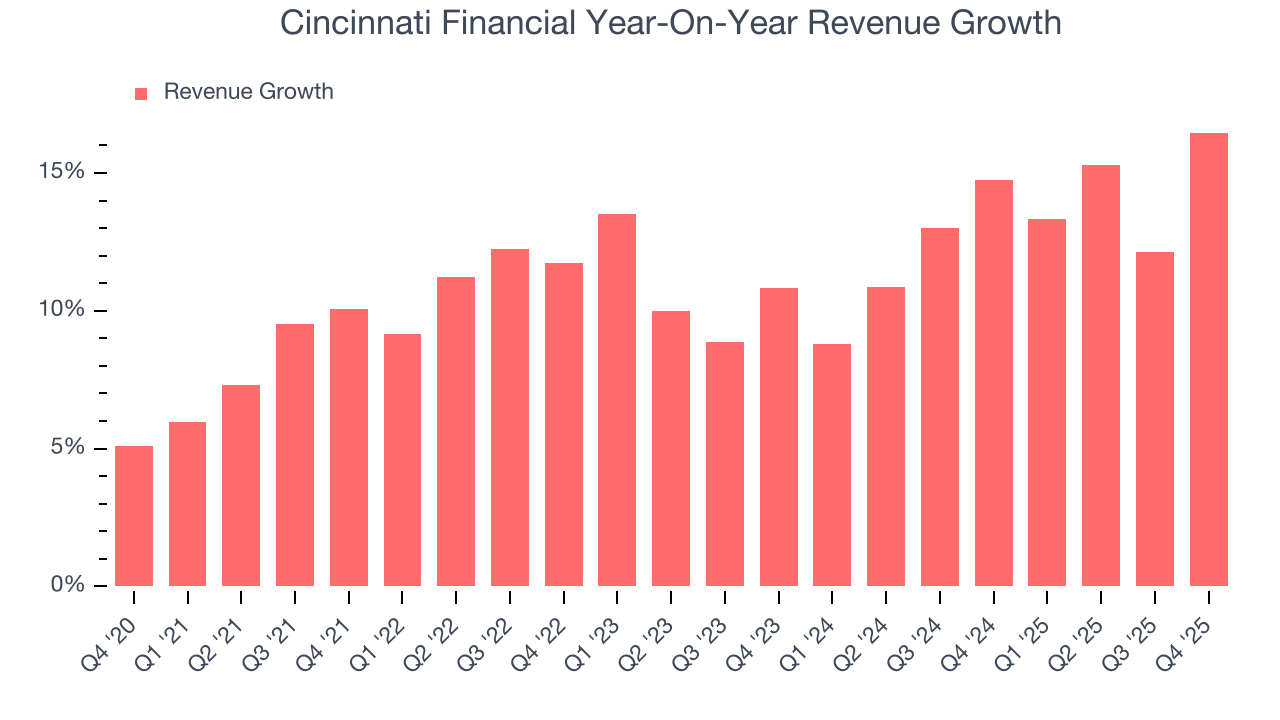
This quarter, Cincinnati Financial reported year-on-year revenue growth of 16.5%, and its $3.09 billion of revenue exceeded Wall Street’s estimates by 5.8%.
Net premiums earned made up 89.2% of the company’s total revenue during the last five years, meaning Cincinnati Financial barely relies on non-insurance activities to drive its overall growth.
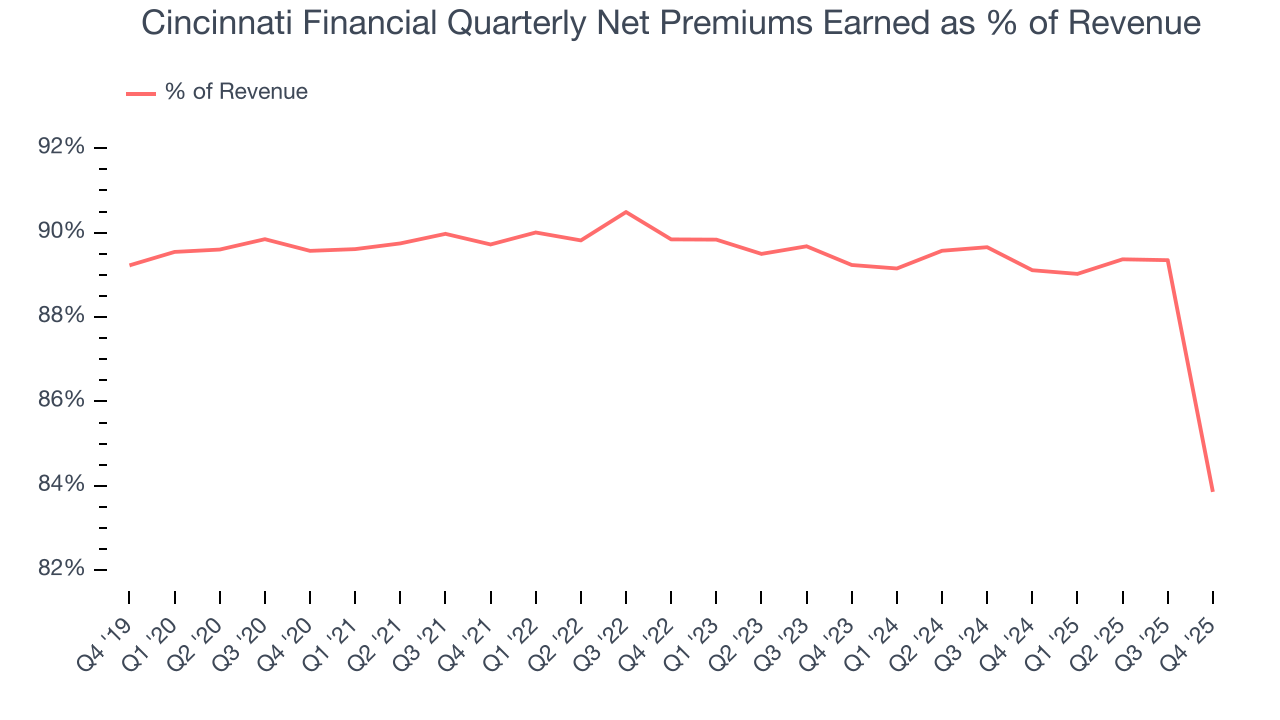
Markets consistently prioritize net premiums earned growth over investment and fee income, recognizing its superior quality as a core indicator of the company’s underwriting success and market penetration.
6. Net Premiums Earned
When insurers sell policies, they protect themselves from extremely large losses or an outsized accumulation of losses with reinsurance (insurance for insurance companies). Net premiums earned are therefore net of what’s ceded to reinsurers as a risk mitigation and transfer strategy.
Cincinnati Financial’s net premiums earned has grown at a 10.8% annualized rate over the last five years, a step above the broader insurance industry and in line with its total revenue.
When analyzing Cincinnati Financial’s net premiums earned over the last two years, we can see that growth accelerated to 12% annually. Since two-year net premiums earned grew slower than total revenue over this period, it’s implied that other line items such as investment income grew at a faster rate. While these supplementary streams affect the bottom line, their contribution can fluctuate. Some firms have been more successful and consistent in investing their float over the long term, but sharp movements in the fixed income and equity markets can play a substantial role in short-term performance.
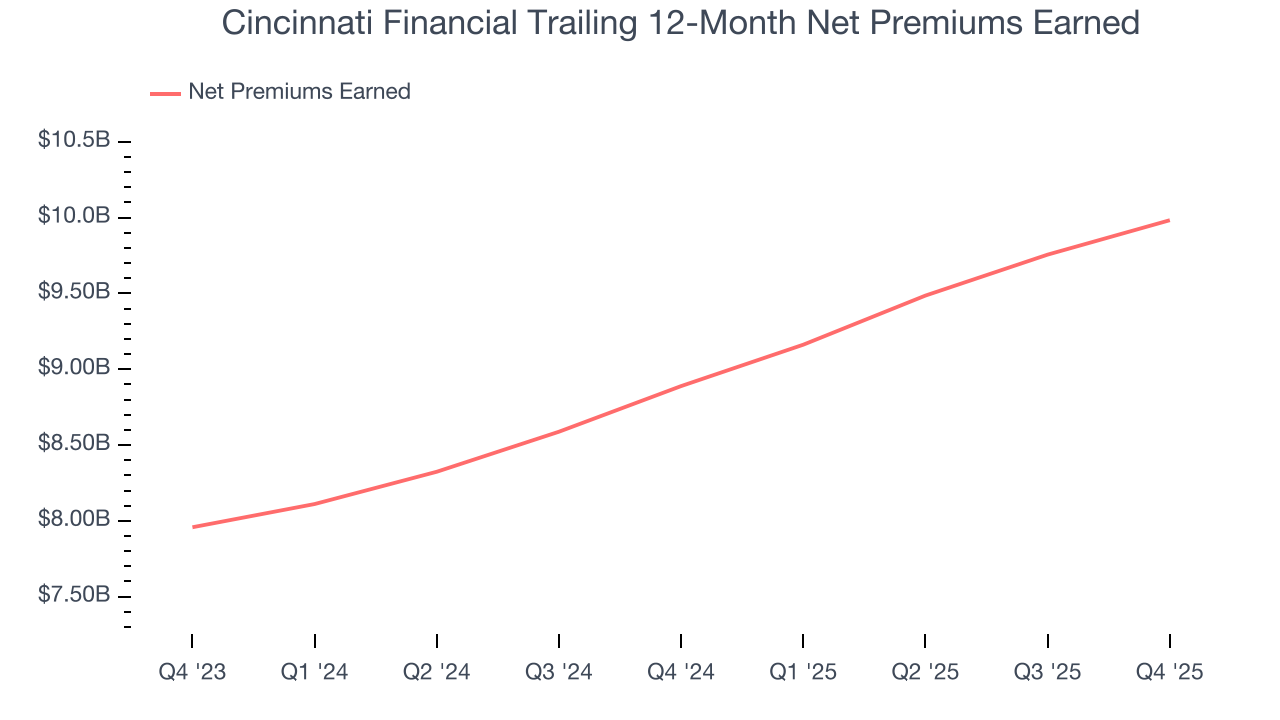
Cincinnati Financial’s net premiums earned came in at $2.59 billion this quarter, up 9.6% year on year and topping Wall Street Consensus estimates by 1.4%.
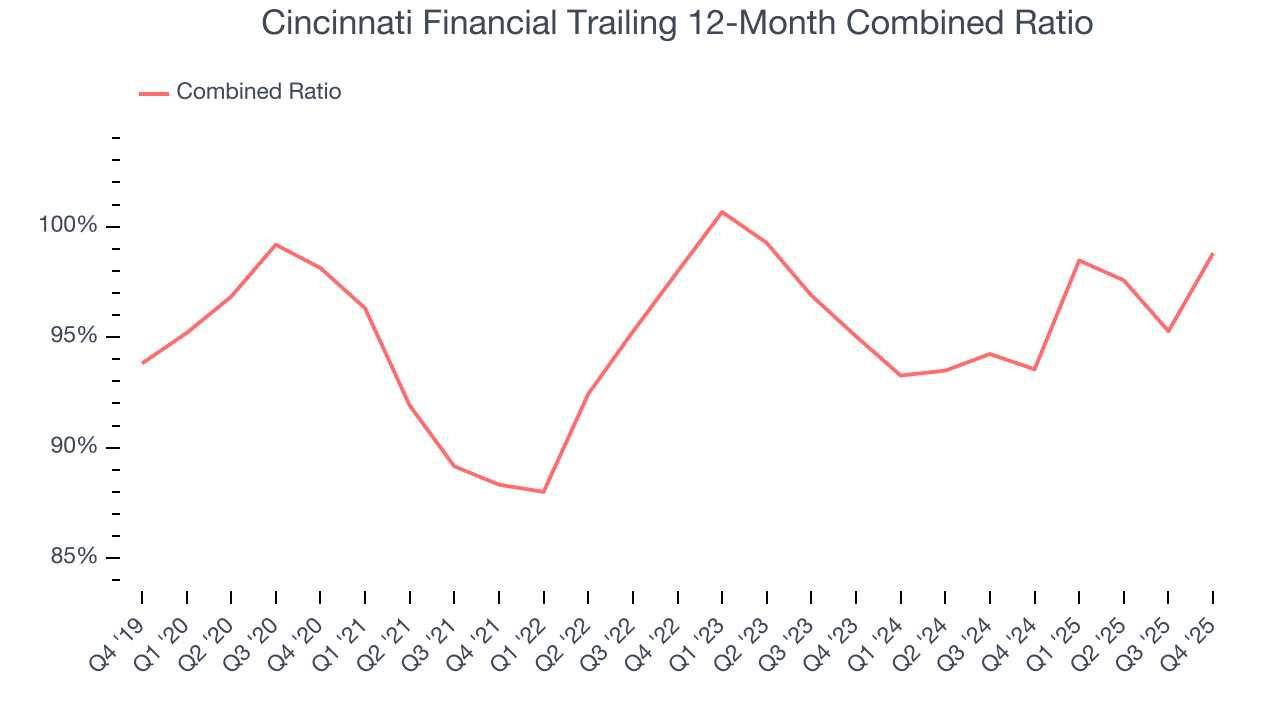
7. Combined Ratio
Revenue growth is one major determinant of business quality, and the efficiency of operations is another. For insurance companies, we look at the combined ratio rather than the operating expenses and margins that define sectors such as consumer, tech, and industrials.
The combined ratio sums the costs of underwriting (salaries, commissions, overhead) as well as what an insurer pays out in claims (losses) and divides it by net premiums earned. If a company boasts a combined ratio under 100%, it is underwriting profitably. If above 100%, it is losing money on its core operations of selling insurance policies.
Given the calculation, a lower expense ratio is better. Over the last five years, Cincinnati Financial’s combined ratio couldn’t build momentum, hanging around 98.8%. It has also worsened by 3.8 percentage points on a two-year basis, showing its expenses have recently increased at a faster rate than revenue. This usually raises questions unless the company is in high-growth mode and reinvesting its profits into attractive ventures.
8. Earnings Per Share
We track the long-term change in earnings per share (EPS) for the same reason as long-term revenue growth. Compared to revenue, however, EPS highlights whether a company’s growth is profitable.
Cincinnati Financial’s EPS grew at a remarkable 19.4% compounded annual growth rate over the last five years, higher than its 11.3% annualized revenue growth. However, this alone doesn’t tell us much about its business quality because its combined ratio didn’t improve.
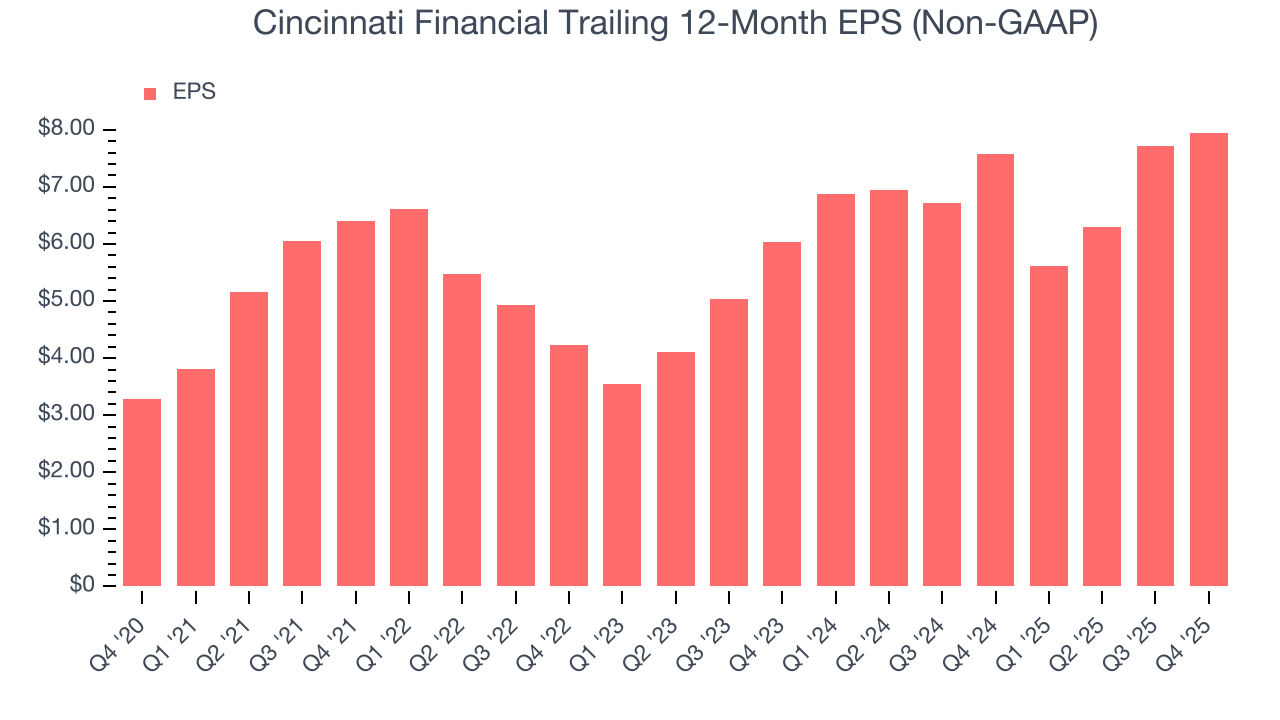
Diving into the nuances of Cincinnati Financial’s earnings can give us a better understanding of its performance. A five-year view shows that Cincinnati Financial has repurchased its stock, shrinking its share count by 2.8%. This tells us its EPS outperformed its revenue not because of increased operational efficiency but financial engineering, as buybacks boost per share earnings. 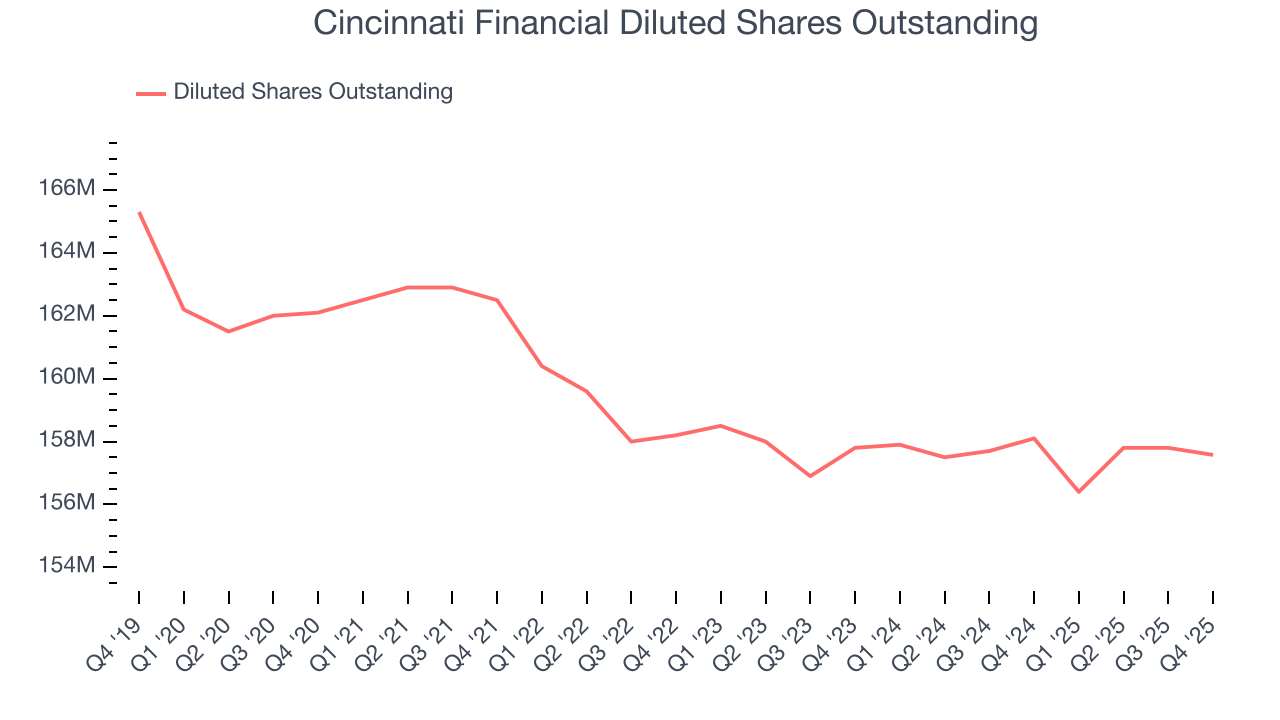
Like with revenue, we analyze EPS over a shorter period to see if we are missing a change in the business.
For Cincinnati Financial, its two-year annual EPS growth of 14.7% was lower than its five-year trend. This wasn’t great, but at least the company was successful in other measures of financial health.
In Q4, Cincinnati Financial reported adjusted EPS of $3.37, up from $3.14 in the same quarter last year. This print easily cleared analysts’ estimates, and shareholders should be content with the results. Over the next 12 months, Wall Street expects Cincinnati Financial’s full-year EPS of $7.95 to grow 5.8%.
9. Book Value Per Share (BVPS)
Insurance companies are balance sheet businesses, collecting premiums upfront and paying out claims over time. The float – premiums collected but not yet paid out – are invested, creating an asset base supported by a liability structure. Book value captures this dynamic by measuring:
- Assets (investment portfolio, cash, reinsurance recoverables) - liabilities (claim reserves, debt, future policy benefits)
BVPS is essentially the residual value for shareholders.
We therefore consider BVPS very important to track for insurers and a metric that sheds light on business quality. While other (and more commonly known) per-share metrics like EPS can sometimes be lumpy due to reserve releases or one-time items and can be managed or skewed while still following accounting rules, BVPS reflects long-term capital growth and is harder to manipulate.
Cincinnati Financial’s BVPS grew at a decent 8.8% annual clip over the last five years. BVPS growth has accelerated recently, growing by 15.2% annually over the last two years from $77.06 to $102.35 per share.
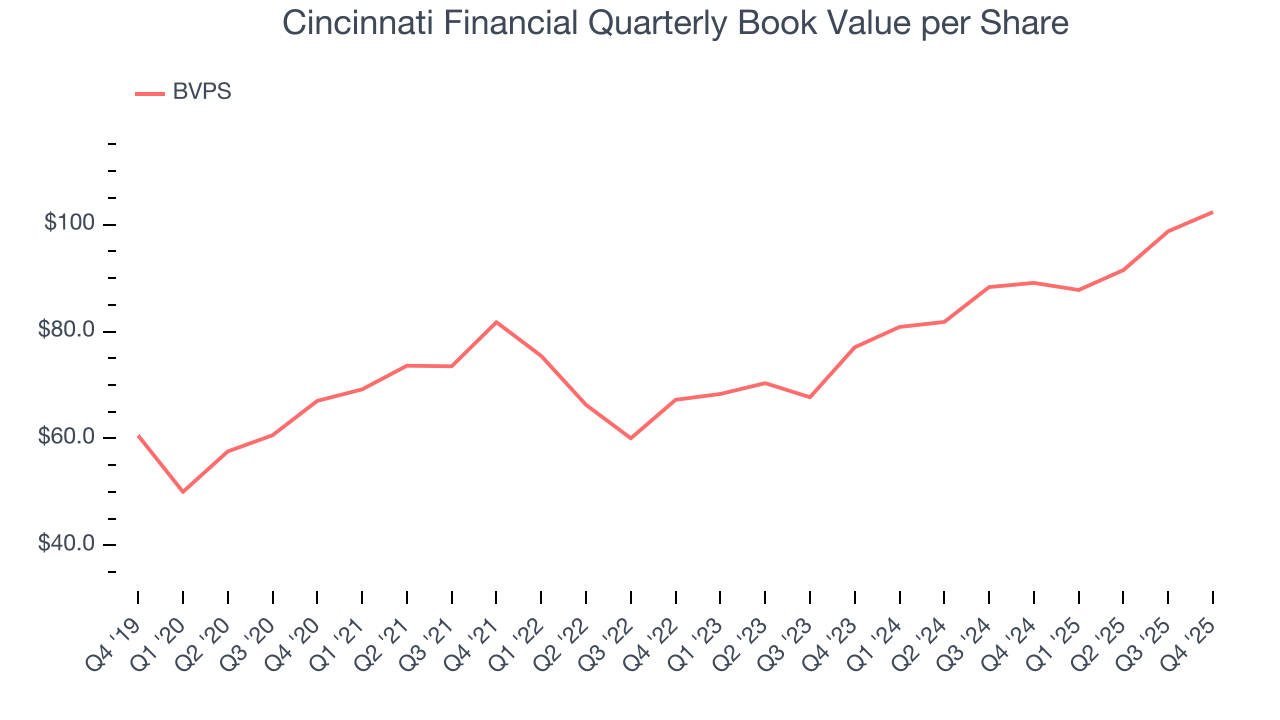
Over the next 12 months, Consensus estimates call for Cincinnati Financial’s BVPS to grow by 2.9% to $100.27, lousy growth rate.
10. Balance Sheet Assessment
The debt-to-equity ratio is a widely used measure to assess a company's balance sheet health. A higher ratio means that a business aggressively financed its growth with debt. This can result in higher earnings (if the borrowed funds are invested profitably) but also increases risk.
If debt levels are too high, there could be difficulties in meeting obligations, especially during economic downturns or periods of rising interest rates if the debt has variable-rate payments.
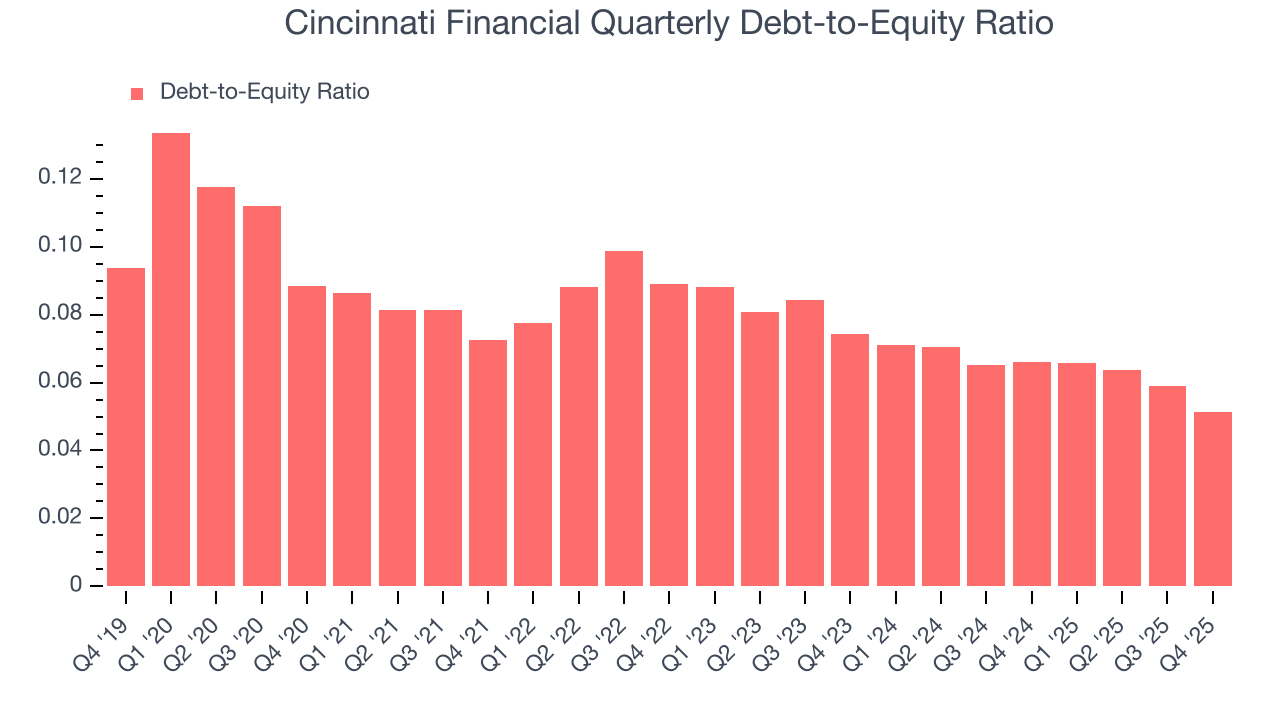
Cincinnati Financial currently has $815 million of debt and $15.91 billion of shareholder's equity on its balance sheet, and over the past four quarters, has averaged a debt-to-equity ratio of 0.1×. We think this is safe and raises no red flags. In general, we’re comfortable with any ratio below 1.0× for an insurance business. Anything below 0.5× is a bonus.
11. Return on Equity
Return on Equity, or ROE, ties everything together and is a vital metric. It tells us how much profit the insurer generates for each dollar of shareholder equity entrusted to management. Over a long period, insurers with higher ROEs tend to compound shareholder wealth faster through retained earnings, buybacks, and dividends.
Over the last five years, Cincinnati Financial has averaged an ROE of 14.2%, healthy for a company operating in a sector where the average shakes out around 12.5% and those putting up 20%+ are greatly admired. This shows Cincinnati Financial has a decent competitive moat.
12. Key Takeaways from Cincinnati Financial’s Q4 Results
We were impressed by how significantly Cincinnati Financial blew past analysts’ revenue expectations this quarter. We were also glad its EPS outperformed Wall Street’s estimates. Zooming out, we think this quarter featured some important positives. The stock remained flat at $168.67 immediately following the results.
13. Is Now The Time To Buy Cincinnati Financial?
Updated: March 24, 2026 at 12:51 AM EDT
Are you wondering whether to buy Cincinnati Financial or pass? We urge investors to not only consider the latest earnings results but also longer-term business quality and valuation as well.
Cincinnati Financial isn’t a bad business, but we have other favorites. To kick things off, its revenue growth was impressive over the last five years. And while Cincinnati Financial’s estimated sales for the next 12 months are weak, its remarkable EPS growth over the last five years shows its profits are trickling down to shareholders.
Cincinnati Financial’s P/B ratio based on the next 12 months is 1.5x. Beauty is in the eye of the beholder, but we don’t really see a big opportunity at the moment. We're pretty confident there are superior stocks to buy right now.
Wall Street analysts have a consensus one-year price target of $173.67 on the company (compared to the current share price of $159.36).