
CoStar (CSGP)
We’re cautious of CoStar. Its weak sales growth and low returns on capital show it struggled to generate demand and profits.― StockStory Analyst Team
1. News


2. Summary
Why CoStar Is Not Exciting
With a research department that makes over 10,000 property updates daily to its 35-year-old database, CoStar Group (NASDAQ:CSGP) provides comprehensive real estate data, analytics, and online marketplaces for commercial and residential properties in the U.S. and U.K.
- Earnings per share fell by 2.7% annually over the last five years while its revenue grew, showing its incremental sales were much less profitable
- Underwhelming 3.4% return on capital reflects management’s difficulties in finding profitable growth opportunities, and its decreasing returns suggest its historical profit centers are aging
- A positive is that its exciting sales outlook for the upcoming 12 months calls for 17.3% growth, an acceleration from its two-year trend


CoStar falls below our quality standards. We’re redirecting our focus to better businesses.
Why There Are Better Opportunities Than CoStar


CoStar is trading at $43.52 per share, or 33.3x forward P/E. Not only is CoStar’s multiple richer than most business services peers, but it’s also expensive for its fundamentals.
We prefer to invest in similarly-priced but higher-quality companies with superior earnings growth.
3. CoStar (CSGP) Research Report: Q4 CY2025 Update
Real estate data provider CoStar Group (NASDAQ:CSGP) reported revenue ahead of Wall Street’s expectations in Q4 CY2025, with sales up 26.9% year on year to $900 million. On the other hand, next quarter’s revenue guidance of $895 million was less impressive, coming in 0.6% below analysts’ estimates. Its non-GAAP profit of $0.31 per share was 13.8% above analysts’ consensus estimates.
CoStar (CSGP) Q4 CY2025 Highlights:
- Revenue: $900 million vs analyst estimates of $892.2 million (26.9% year-on-year growth, 0.9% beat)
- Adjusted EPS: $0.31 vs analyst estimates of $0.27 (13.8% beat)
- Adjusted EBITDA: $177 million vs analyst estimates of $157.8 million (19.7% margin, 12.2% beat)
- Revenue Guidance for Q1 CY2026 is $895 million at the midpoint, below analyst estimates of $900 million
- Adjusted EPS guidance for the upcoming financial year 2026 is $1.28 at the midpoint, missing analyst estimates by 5%
- EBITDA guidance for the upcoming financial year 2026 is $770 million at the midpoint, below analyst estimates of $781.9 million
- Operating Margin: 5.4%, in line with the same quarter last year
- Market Capitalization: $20.29 billion
Company Overview
With a research department that makes over 10,000 property updates daily to its 35-year-old database, CoStar Group (NASDAQ:CSGP) provides comprehensive real estate data, analytics, and online marketplaces for commercial and residential properties in the U.S. and U.K.
CoStar's business revolves around collecting, analyzing, and delivering real estate information through its integrated platform of online services. The company maintains what it describes as the most comprehensive proprietary database of commercial real estate information in the industry, covering office, retail, industrial, multifamily, land, mixed-use, and hospitality properties.
The company employs a large team of researchers who collect data through phone calls, emails, field inspections, and public records reviews. These researchers physically inspect properties, take photographs, create videos and 3D tours, measure buildings, and gather tenant information. CoStar even uses low-flying aircraft and drones to conduct aerial research of commercial developments.
Real estate professionals use CoStar's tools to identify available spaces, evaluate leasing and sales opportunities, value assets, and analyze market conditions. For example, a commercial broker might use CoStar to find office space matching a client's requirements, access detailed property information including floor plans and photographs, and analyze comparable lease rates in the area.
CoStar monetizes its data through subscription-based services under various brands. Its flagship CoStar platform provides commercial real estate intelligence, while Apartments.com offers apartment listings and tools for property managers. LoopNet serves as an online marketplace for commercial property listings, and Homes.com focuses on residential real estate. The company also operates Ten-X, an online auction platform for commercial real estate.
Beyond information services, CoStar offers technology solutions for lease administration, portfolio management, and risk analytics. Its STR service provides benchmarking and analytics specifically for the hospitality industry.
The company operates primarily in North America but has expanded internationally, particularly in Europe. CoStar typically charges fixed monthly subscription fees rather than usage-based pricing, with rates varying based on factors like number of users, organization size, and geographic location.
4. Data & Business Process Services
A combination of increasing reliance on data and analytics across various industries and the desire for cost efficiency through outsourcing could mean that companies in this space gain. As functions such as payroll, HR, and credit risk assessment rely on more digitization, key players in the data & business process services industry could be increased demand. On the other hand, the sector faces headwinds from growing regulatory scrutiny on data privacy and security, with laws like GDPR and evolving U.S. regulations potentially limiting data collection and monetization strategies. Additionally, rising cyber threats pose risks to firms handling sensitive personal and financial information, creating outsized headline risk when things go wrong in this area.
CoStar Group competes with various specialized real estate data providers like Reed Business Information's Estates Gazette, Altus Group, and Moody's REIS Network in commercial real estate data. In the apartment listing space, it faces competition from Zillow Rentals, Trulia Rentals, and RentCafe. For residential listings, competitors include Zillow, Redfin, and Realtor.com, while Ten-X competes with commercial real estate auction platforms like CREXi.
5. Revenue Growth
Examining a company’s long-term performance can provide clues about its quality. Even a bad business can shine for one or two quarters, but a top-tier one grows for years.
With $3.25 billion in revenue over the past 12 months, CoStar is a mid-sized business services company, which sometimes brings disadvantages compared to larger competitors benefiting from better economies of scale. On the bright side, it can still flex high growth rates because it’s working from a smaller revenue base.
As you can see below, CoStar’s sales grew at an exceptional 14.4% compounded annual growth rate over the last five years. This shows it had high demand, a useful starting point for our analysis.
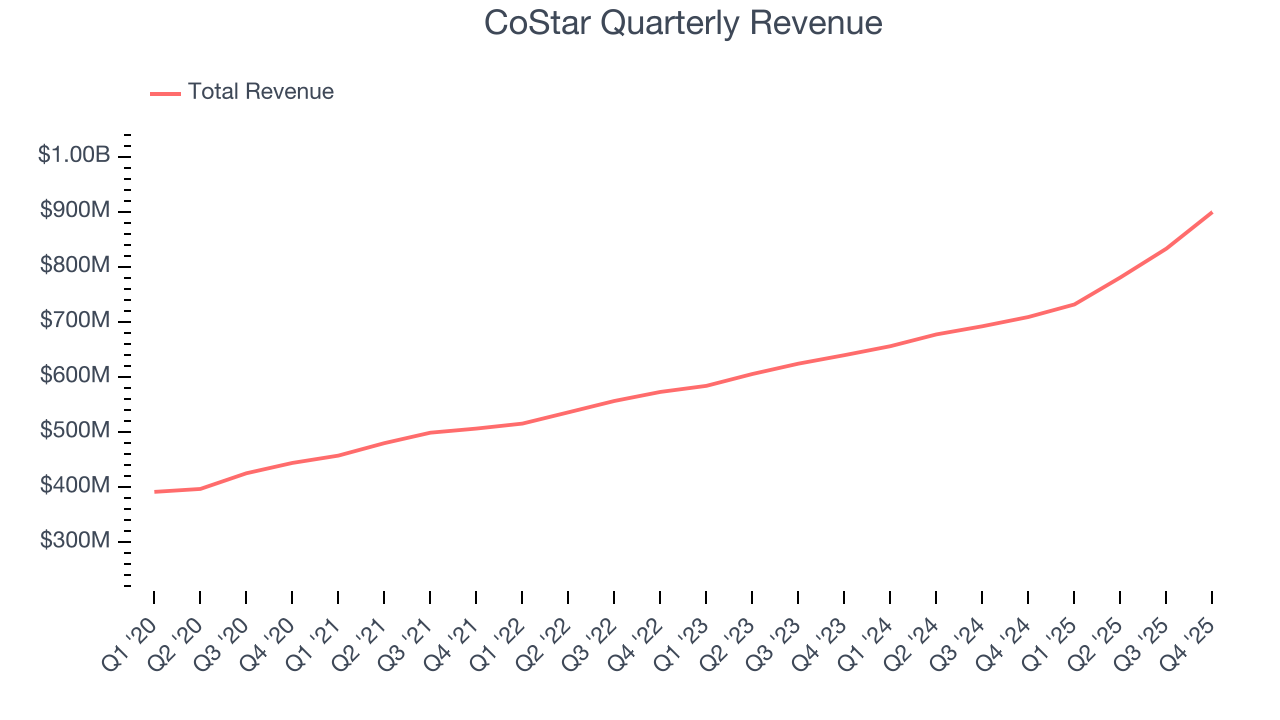
We at StockStory place the most emphasis on long-term growth, but within business services, a half-decade historical view may miss recent innovations or disruptive industry trends. CoStar’s annualized revenue growth of 15% over the last two years aligns with its five-year trend, suggesting its demand was predictably strong. 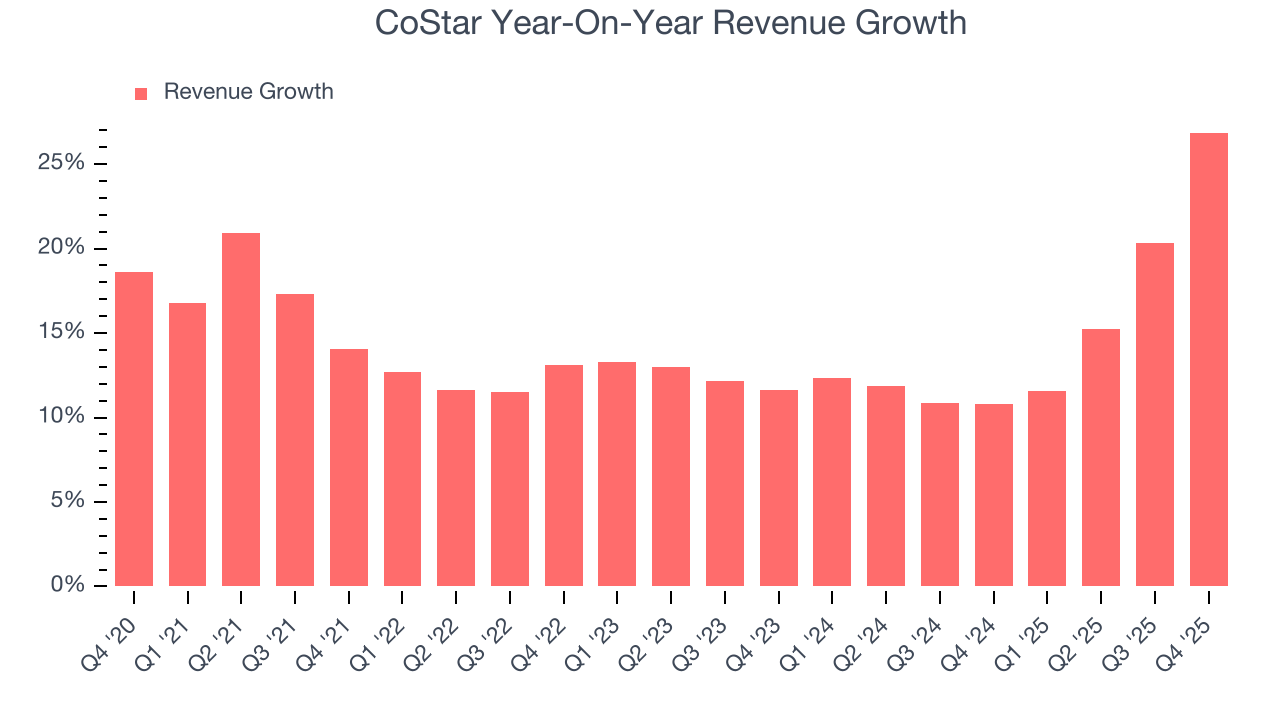
This quarter, CoStar reported robust year-on-year revenue growth of 26.9%, and its $900 million of revenue topped Wall Street estimates by 0.9%. Company management is currently guiding for a 22.2% year-on-year increase in sales next quarter.
Looking further ahead, sell-side analysts expect revenue to grow 17.3% over the next 12 months, an improvement versus the last two years. This projection is eye-popping and implies its newer products and services will catalyze better top-line performance.
6. Operating Margin
Operating margin is an important measure of profitability as it shows the portion of revenue left after accounting for all core expenses – everything from the cost of goods sold to advertising and wages. It’s also useful for comparing profitability across companies with different levels of debt and tax rates because it excludes interest and taxes.
CoStar was profitable over the last five years but held back by its large cost base. Its average operating margin of 8.7% was weak for a business services business.
Looking at the trend in its profitability, CoStar’s operating margin decreased by 24.5 percentage points over the last five years. This raises questions about the company’s expense base because its revenue growth should have given it leverage on its fixed costs, resulting in better economies of scale and profitability. CoStar’s performance was poor no matter how you look at it - it shows that costs were rising and it couldn’t pass them onto its customers.
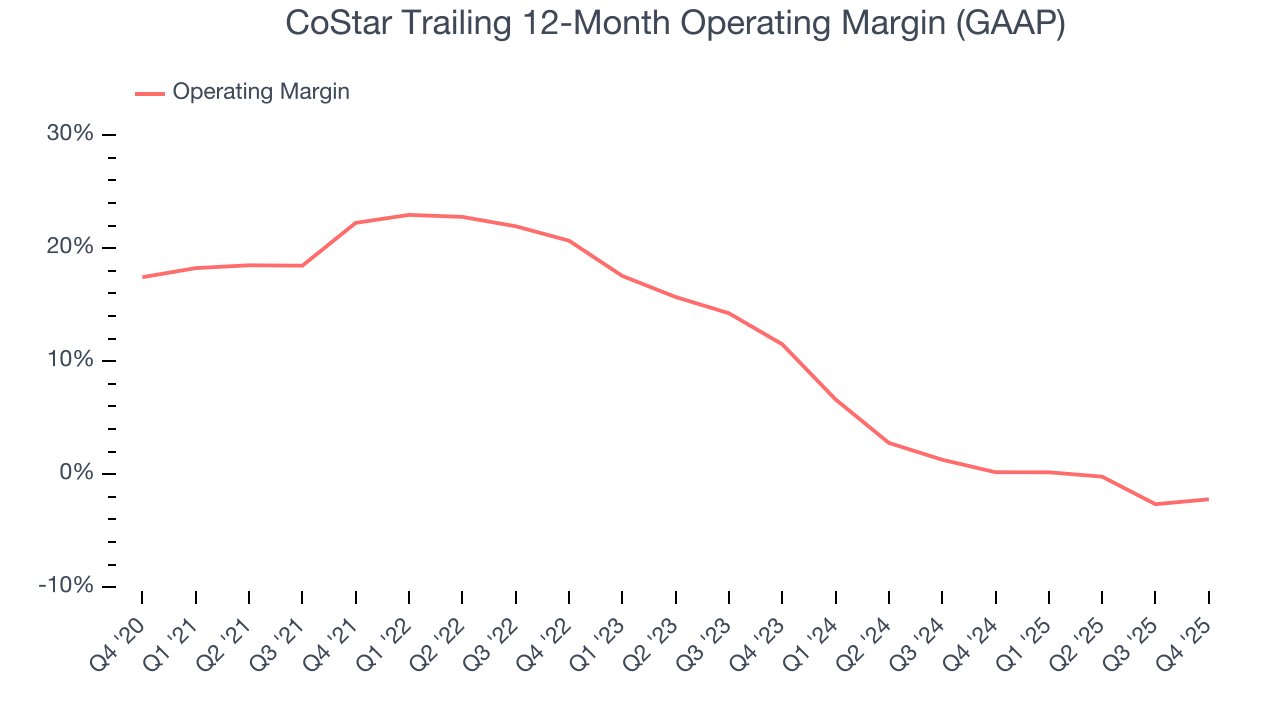
In Q4, CoStar generated an operating margin profit margin of 5.4%, in line with the same quarter last year. This indicates the company’s overall cost structure has been relatively stable.
7. Earnings Per Share
Revenue trends explain a company’s historical growth, but the long-term change in earnings per share (EPS) points to the profitability of that growth – for example, a company could inflate its sales through excessive spending on advertising and promotions.
Sadly for CoStar, its EPS declined by 2.7% annually over the last five years while its revenue grew by 14.4%. This tells us the company became less profitable on a per-share basis as it expanded.
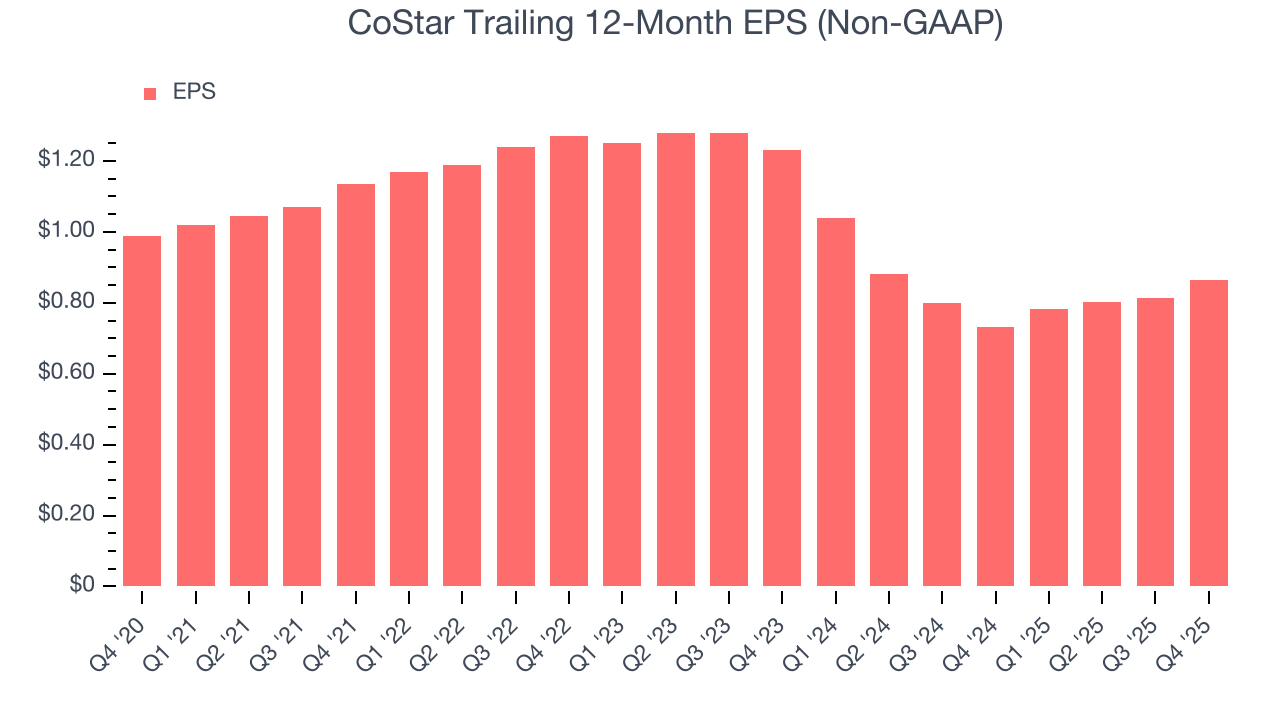
Diving into the nuances of CoStar’s earnings can give us a better understanding of its performance. As we mentioned earlier, CoStar’s operating margin was flat this quarter but declined by 24.5 percentage points over the last five years. Its share count also grew by 6.5%, meaning the company not only became less efficient with its operating expenses but also diluted its shareholders. 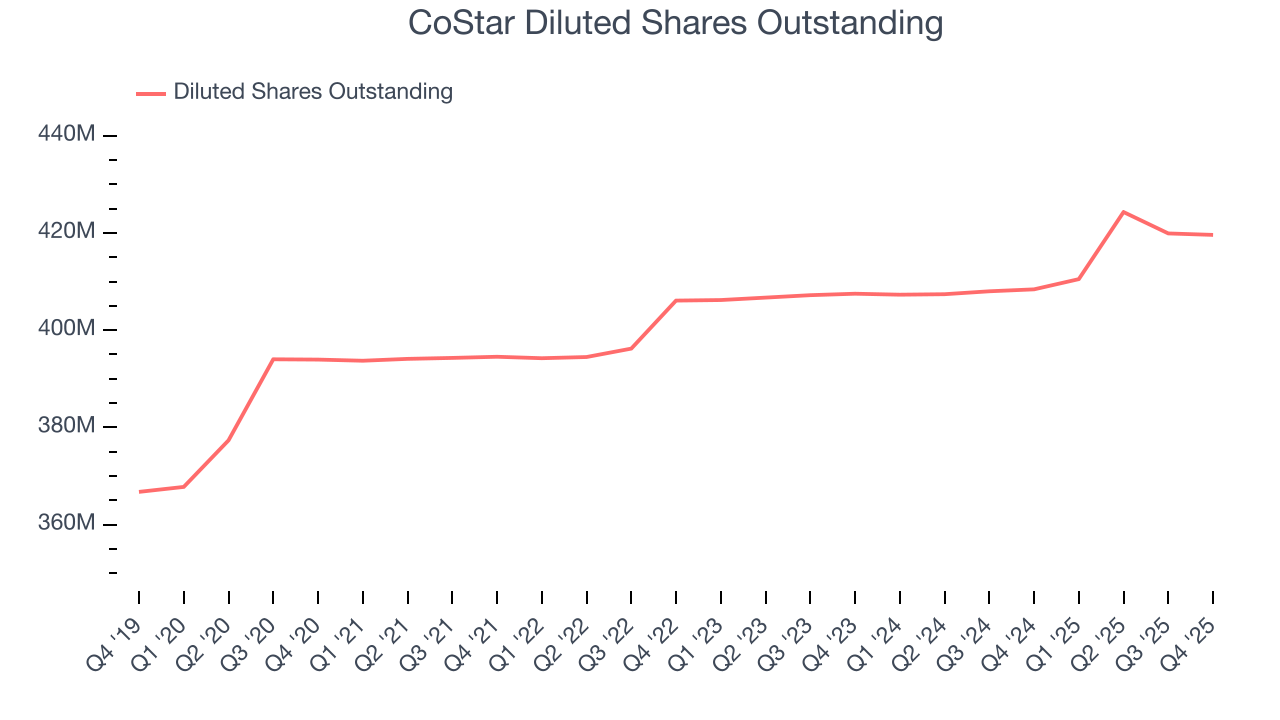
Like with revenue, we analyze EPS over a more recent period because it can provide insight into an emerging theme or development for the business.
For CoStar, its two-year annual EPS declines of 16.2% show it’s continued to underperform. These results were bad no matter how you slice the data.
In Q4, CoStar reported adjusted EPS of $0.31, up from $0.26 in the same quarter last year. This print easily cleared analysts’ estimates, and shareholders should be content with the results. Over the next 12 months, Wall Street expects CoStar’s full-year EPS of $0.86 to grow 52.4%.
8. Cash Is King
If you’ve followed StockStory for a while, you know we emphasize free cash flow. Why, you ask? We believe that in the end, cash is king, and you can’t use accounting profits to pay the bills.
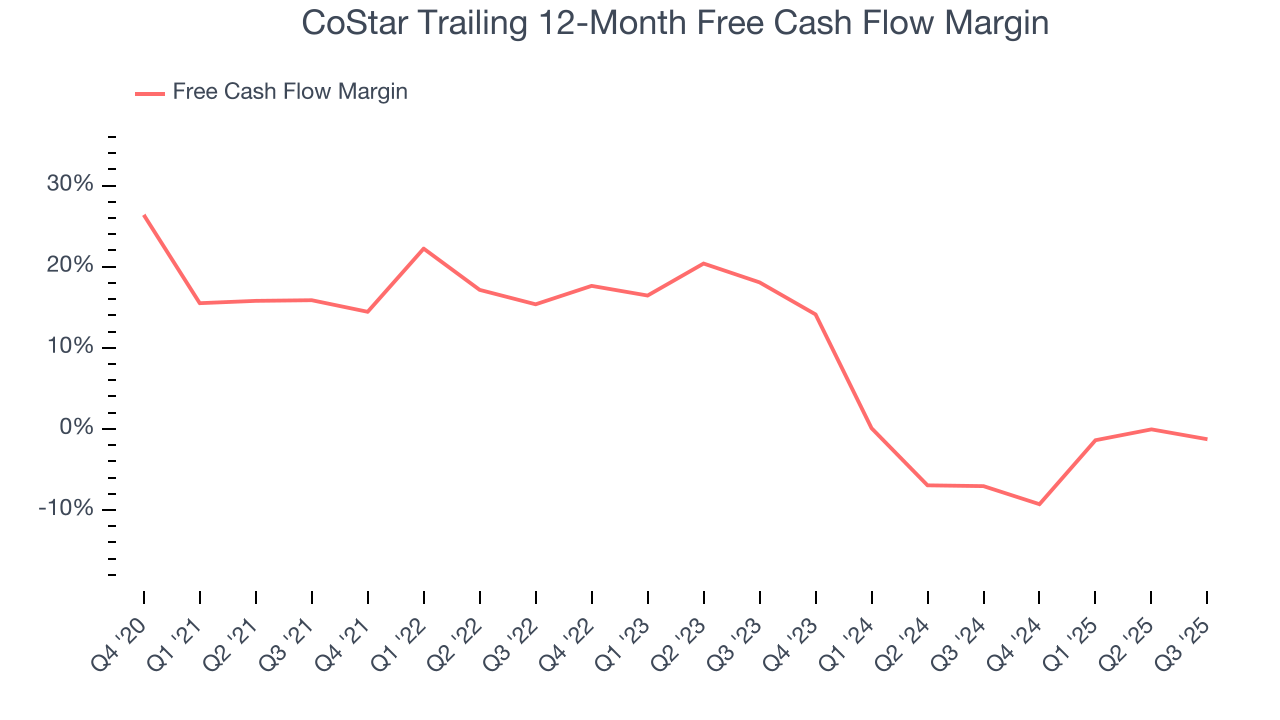
CoStar has shown decent cash profitability, giving it some flexibility to reinvest or return capital to investors. The company’s free cash flow margin averaged 6% over the last five years, slightly better than the broader business services sector.
Taking a step back, we can see that CoStar’s margin dropped by 14.4 percentage points during that time. Continued declines could signal it is in the middle of an investment cycle.
9. Return on Invested Capital (ROIC)
EPS and free cash flow tell us whether a company was profitable while growing its revenue. But was it capital-efficient? A company’s ROIC explains this by showing how much operating profit it makes compared to the money it has raised (debt and equity).
CoStar historically did a mediocre job investing in profitable growth initiatives. Its five-year average ROIC was 3.5%, lower than the typical cost of capital (how much it costs to raise money) for business services companies.
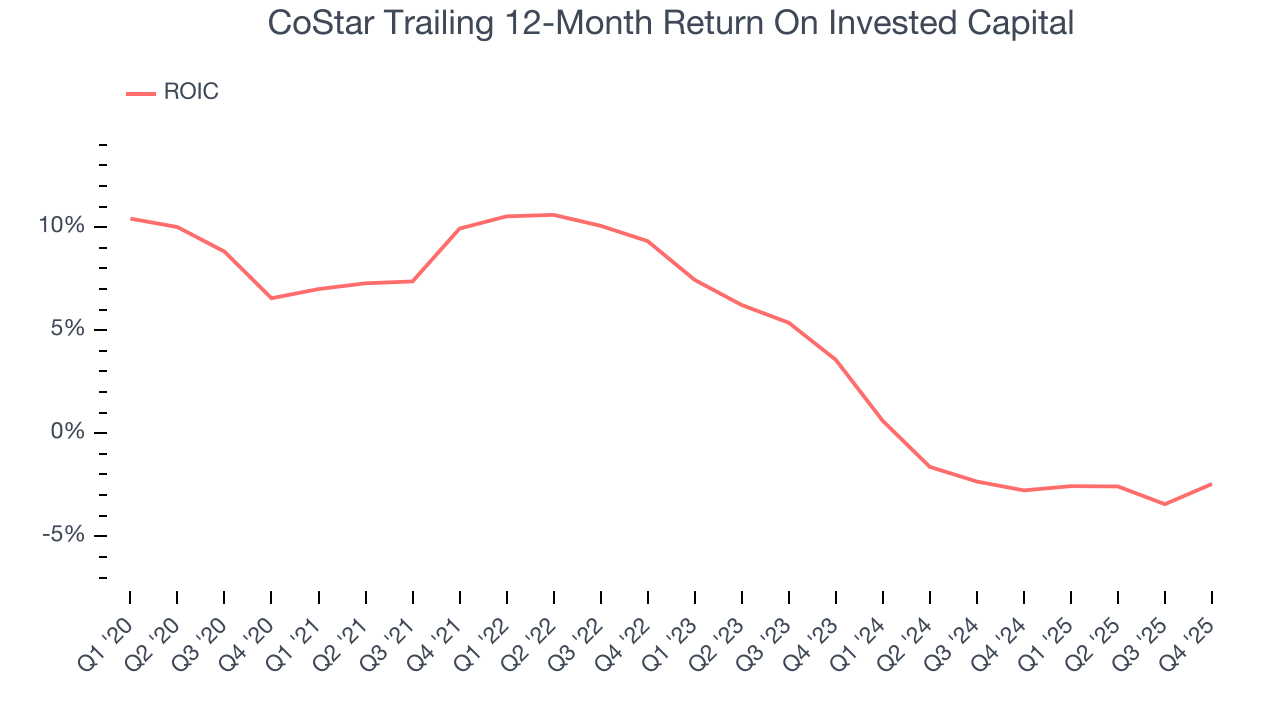
We like to invest in businesses with high returns, but the trend in a company’s ROIC is what often surprises the market and moves the stock price. Unfortunately, CoStar’s ROIC has decreased significantly over the last few years. Paired with its already low returns, these declines suggest its profitable growth opportunities are few and far between.
10. Balance Sheet Assessment
Companies with more cash than debt have lower bankruptcy risk.
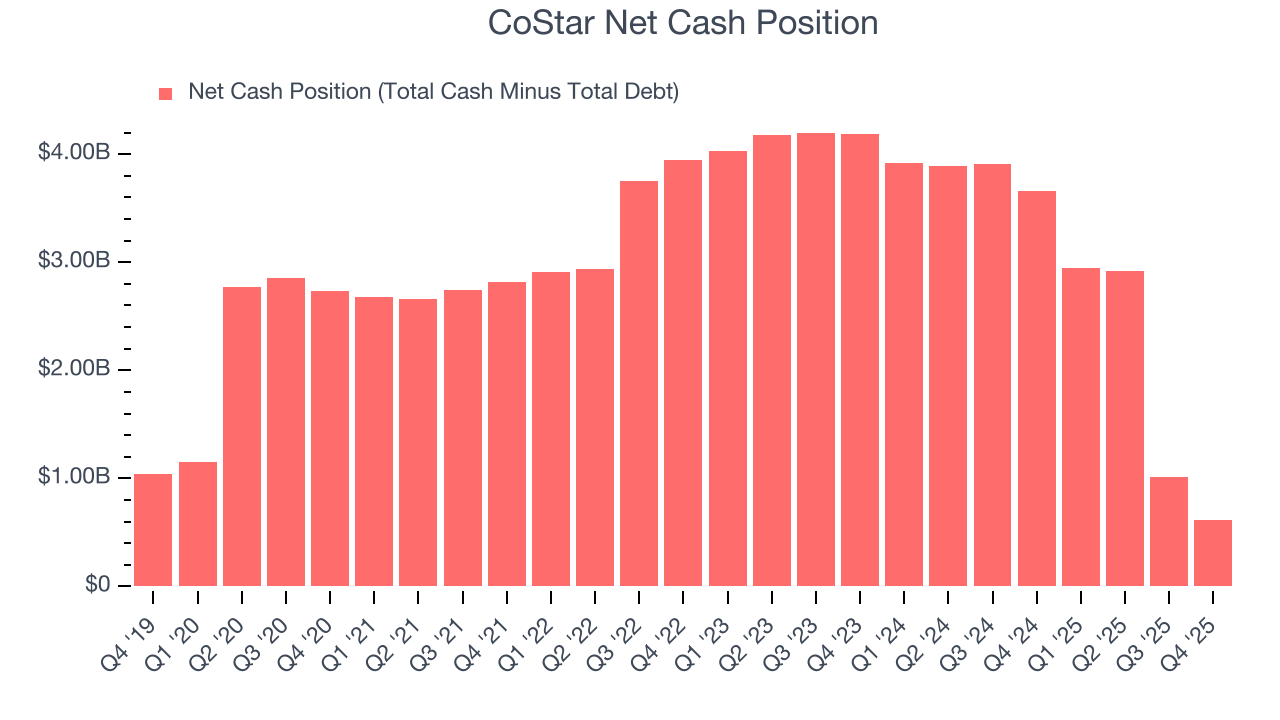
CoStar is a well-capitalized company with $1.63 billion of cash and $1.02 billion of debt on its balance sheet. This $612 million net cash position is 3.2% of its market cap and gives it the freedom to borrow money, return capital to shareholders, or invest in growth initiatives. Leverage is not an issue here.
11. Key Takeaways from CoStar’s Q4 Results
It was good to see CoStar beat analysts’ EPS expectations this quarter. We were also happy its revenue narrowly outperformed Wall Street’s estimates. On the other hand, its full-year EPS guidance missed and its EPS guidance for next quarter fell short of Wall Street’s estimates. Overall, this quarter could have been better. The stock traded down 4.2% to $47.10 immediately following the results.
12. Is Now The Time To Buy CoStar?
Updated: March 16, 2026 at 12:31 AM EDT
A common mistake we notice when investors are deciding whether to buy a stock or not is that they simply look at the latest earnings results. Business quality and valuation matter more, so we urge you to understand these dynamics as well.
CoStar isn’t a terrible business, but it doesn’t pass our quality test. Although its revenue growth was exceptional over the last five years and is expected to accelerate over the next 12 months, its diminishing returns show management's prior bets haven't worked out. And while the company’s projected EPS for the next year implies the company’s fundamentals will improve, the downside is its declining EPS over the last five years makes it a less attractive asset to the public markets.
CoStar’s P/E ratio based on the next 12 months is 33.3x. This multiple tells us a lot of good news is priced in - we think other companies feature superior fundamentals at the moment.
Wall Street analysts have a consensus one-year price target of $65.42 on the company (compared to the current share price of $43.52).
Although the price target is bullish, readers should exercise caution because analysts tend to be overly optimistic. The firms they work for, often big banks, have relationships with companies that extend into fundraising, M&A advisory, and other rewarding business lines. As a result, they typically hesitate to say bad things for fear they will lose out. We at StockStory do not suffer from such conflicts of interest, so we’ll always tell it like it is.