Krispy Kreme (DNUT)
We wouldn’t buy Krispy Kreme. Its poor sales growth shows demand is soft and its negative returns on capital suggest it destroyed value.― StockStory Analyst Team
1. News

2. Summary
Why We Think Krispy Kreme Will Underperform
Famous for its Original Glazed doughnuts and parent company of Insomnia Cookies, Krispy Kreme (NASDAQ:DNUT) is one of the most beloved and well-known fast-food chains in the world.
- Sales are projected to tank by 1.5% over the next 12 months as demand evaporates
- Historical operating margin losses point to an inefficient cost structure
- Limited cash reserves may force the company to seek unfavorable financing terms that could dilute shareholders


Krispy Kreme’s quality doesn’t meet our expectations. We’d search for superior opportunities elsewhere.
Why There Are Better Opportunities Than Krispy Kreme


Krispy Kreme is trading at $3.28 per share, or 15.2x forward EV-to-EBITDA. This multiple is high given its weaker fundamentals.
Paying a premium for high-quality companies with strong long-term earnings potential is preferable to owning challenged businesses with questionable prospects. That helps the prudent investor sleep well at night.
3. Krispy Kreme (DNUT) Research Report: Q4 CY2025 Update
Doughnut chain Krispy Kreme (NASDAQ:DNUT) announced better-than-expected revenue in Q4 CY2025, but sales fell by 2.9% year on year to $392.4 million. Its non-GAAP profit of $0.09 per share was significantly above analysts’ consensus estimates.
Krispy Kreme (DNUT) Q4 CY2025 Highlights:
- Revenue: $392.4 million vs analyst estimates of $389 million (2.9% year-on-year decline, 0.9% beat)
- Adjusted EPS: $0.09 vs analyst estimates of $0.04 (significant beat)
- Adjusted EBITDA: $55.57 million vs analyst estimates of $46.7 million (14.2% margin, 19% beat)
- Operating Margin: -1.9%, in line with the same quarter last year
- Free Cash Flow was $27.93 million, up from -$6.87 million in the same quarter last year
- Locations: 15,194 at quarter end, down from 17,557 in the same quarter last year
- Market Capitalization: $512.2 million
Company Overview
Famous for its Original Glazed doughnuts and parent company of Insomnia Cookies, Krispy Kreme (NASDAQ:DNUT) is one of the most beloved and well-known fast-food chains in the world.
The company was founded in 1937 by Vernon Rudolph when he rented a small building in North Carolina to sell doughnuts to local grocery stores.
Since then, Krispy Kreme has evolved into an omni-channel business and acquired Insomnia Cookies, another revered brand, in 2018. Together, these two banners work harmonically to provide fresh sweets to its customers.
Krispy Kreme and Insomnia Cookies have an unwavering commitment to freshness and quality. At Krispy Kreme, each doughnut is made with the finest ingredients, ensuring a “hot-off-the-line, melt-in-your-mouth” experience, and at Insomnia Cookies, bakers work hard to create “CookieMagic”. In addition to its core menu items, Krispy Kreme serves a range of premium beverages, while Insomnia Cookies also offers ice cream, brownies, and cakes.
When entering Krispy Kreme’s stores, customers are greeted by the unmistakable aroma of warm doughnuts wafting through the air. The warm and inviting atmosphere, often adorned with the mesmerizing sight of doughnuts being freshly glazed through a see-through glass window, creates an immersive and joyful environment for customers.
On the other hand, Insomnia Cookies leverages a digital-first concept, using its popular app to facilitate in-store pickup and delivery orders. This channel accounts for over 40% of Insomnia Cookies’ sales.
4. Traditional Fast Food
Traditional fast-food restaurants are renowned for their speed and convenience, boasting menus filled with familiar and budget-friendly items. Their reputations for on-the-go consumption make them favored destinations for individuals and families needing a quick meal. This class of restaurants, however, is fighting the perception that their meals are unhealthy and made with inferior ingredients, a battle that's especially relevant today given the consumers increasing focus on health and wellness.
Some competitors that sell sweet treats include private company Dunkin’ as well as public companies Dutch Bros (NYSE:BROS), McDonald’s (NYSE:MCD), Starbucks (NYSE:SBUX), and Tim Hortons (owned by Restaurant Brands, NYSE:QSR).
5. Revenue Growth
Examining a company’s long-term performance can provide clues about its quality. Any business can experience short-term success, but top-performing ones enjoy sustained growth for years.
With $1.52 billion in revenue over the past 12 months, Krispy Kreme is a mid-sized restaurant chain, which sometimes brings disadvantages compared to larger competitors benefiting from better brand awareness and economies of scale. On the bright side, it can still flex high growth rates because it’s working from a smaller revenue base.
As you can see below, Krispy Kreme’s sales grew at a decent 8% compounded annual growth rate over the last six years as it opened new restaurants and expanded its reach.
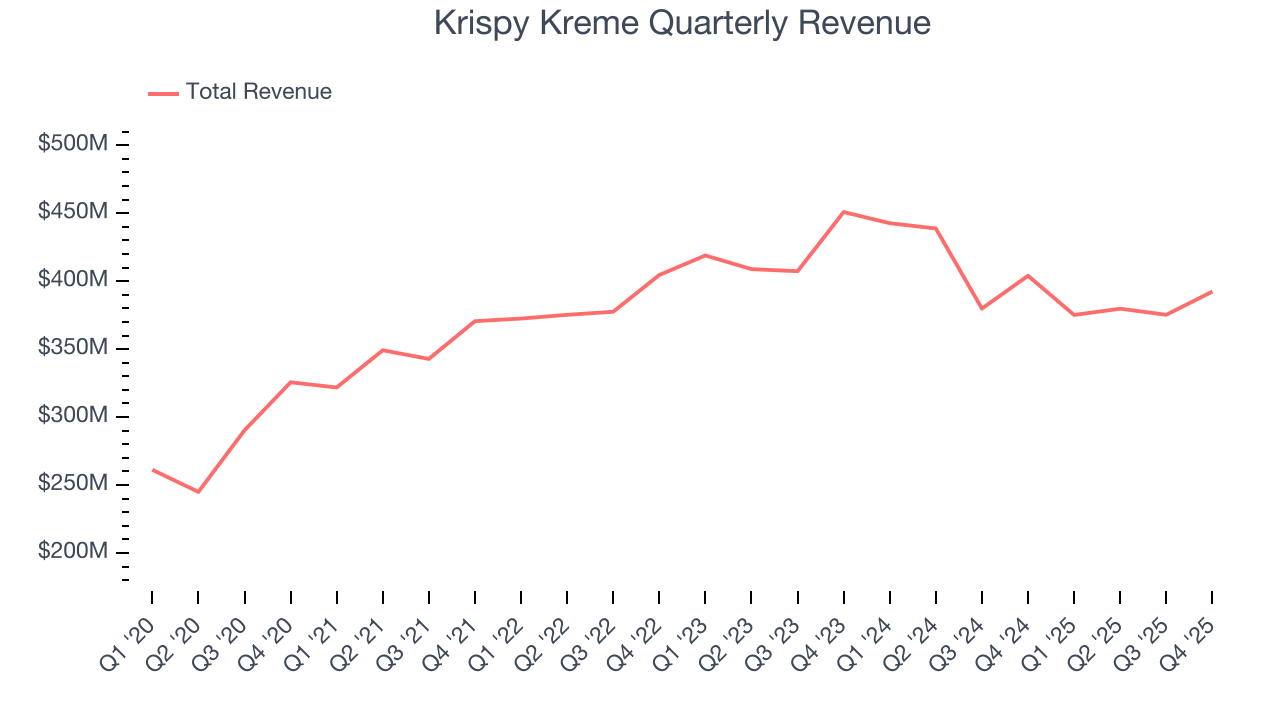
This quarter, Krispy Kreme’s revenue fell by 2.9% year on year to $392.4 million but beat Wall Street’s estimates by 0.9%.
Looking ahead, sell-side analysts expect revenue to decline by 1.5% over the next 12 months, a deceleration versus the last six years. This projection is underwhelming and suggests its menu offerings will see some demand headwinds.
6. Number of Restaurants
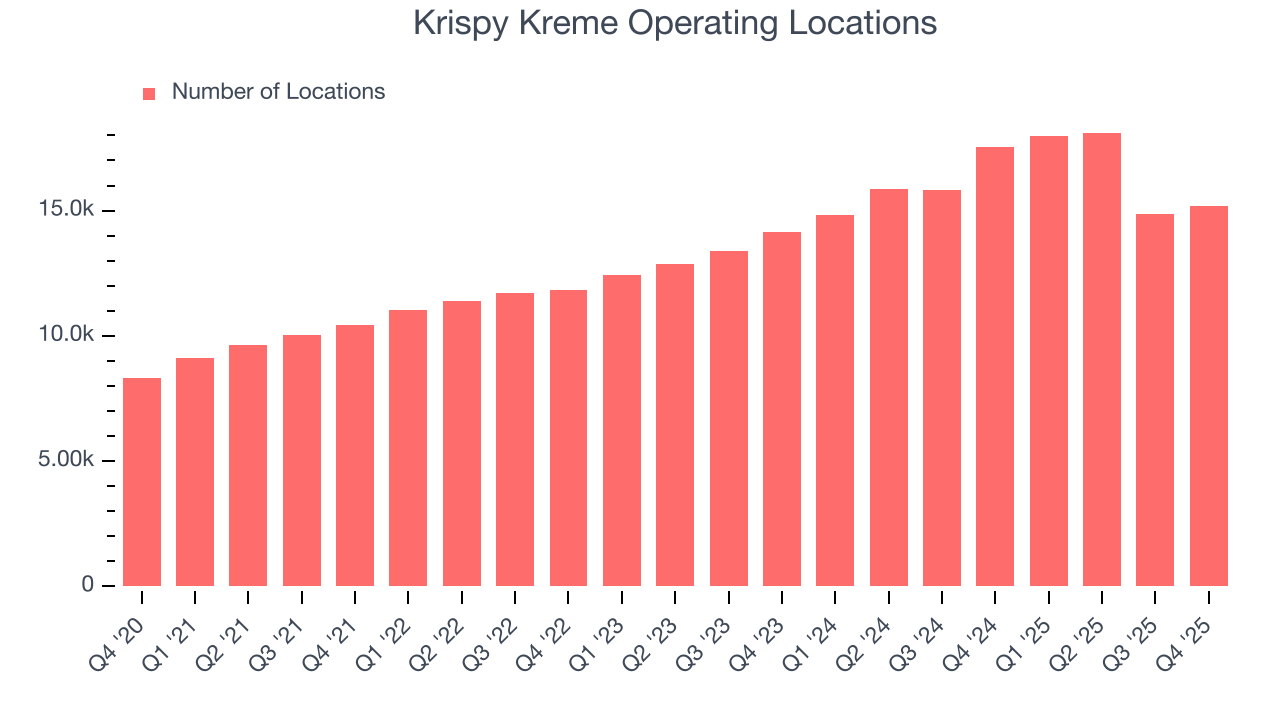
A restaurant chain’s total number of dining locations influences how much it can sell and how quickly revenue can grow.
Krispy Kreme sported 15,194 locations in the latest quarter. Over the last two years, it has opened new restaurants at a rapid clip by averaging 12.6% annual growth, among the fastest in the restaurant sector. This gives it a chance to become a large, scaled business over time.
When a chain opens new restaurants, it usually means it’s investing for growth because there’s healthy demand for its meals and there are markets where its concepts have few or no locations.
7. Gross Margin & Pricing Power
Krispy Kreme’s unit economics are higher than the typical restaurant company, giving it the flexibility to invest in areas such as marketing and talent to reach more consumers. As you can see below, it averaged a decent 25% gross margin over the last two years. That means for every $100 in revenue, roughly $25.01 was left to spend on selling, marketing, and general administrative overhead. 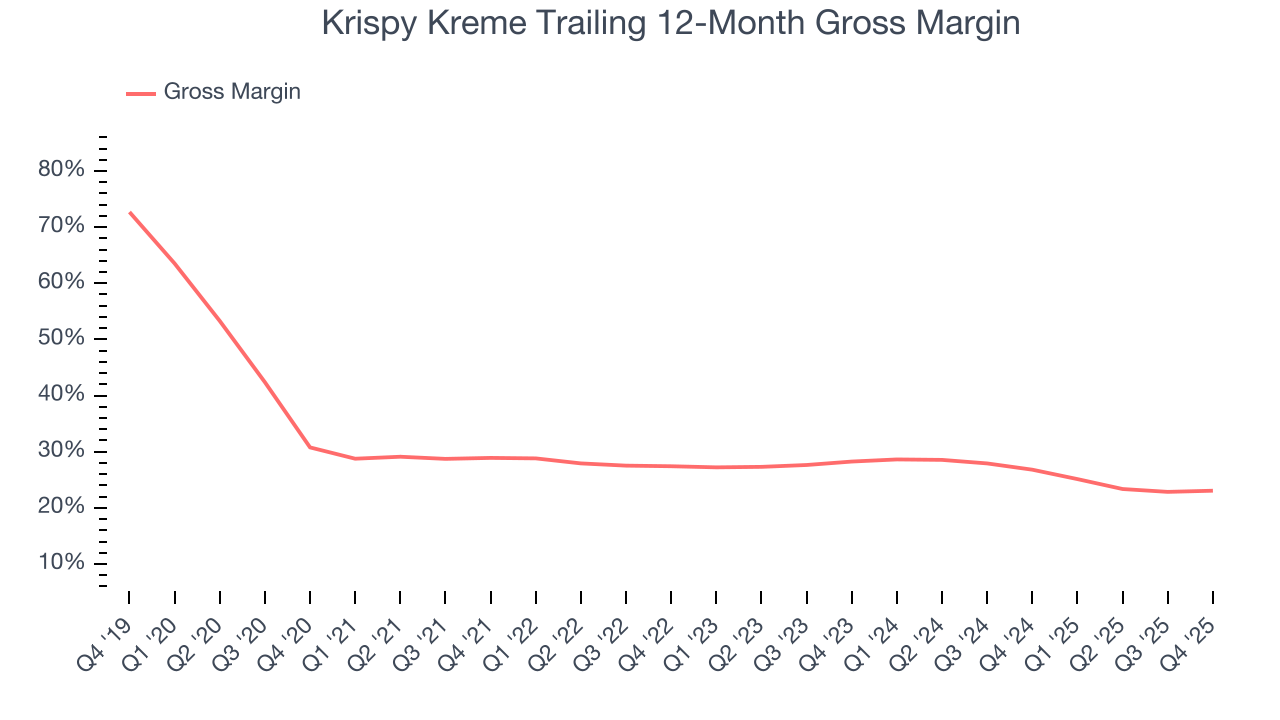
Krispy Kreme produced a 27% gross profit margin in Q4, in line with the same quarter last year. On a wider time horizon, Krispy Kreme’s full-year margin has been trending down over the past 12 months, decreasing by 3.7 percentage points. If this move continues, it could suggest a more competitive environment with some pressure to lower prices and higher input costs (such as ingredients and transportation expenses).
8. Operating Margin
Operating margin is an important measure of profitability as it shows the portion of revenue left after accounting for all core expenses – everything from the cost of goods sold to advertising and wages. It’s also useful for comparing profitability across companies with different levels of debt and tax rates because it excludes interest and taxes.
The restaurant business is tough to succeed in because of its unpredictability, whether it be employees not showing up for work, sudden changes in consumer preferences, or the cost of ingredients skyrocketing thanks to supply shortages.Krispy Kreme has been a victim of these challenges over the last two years, and its high expenses have contributed to an average operating margin of negative 15%.
Looking at the trend in its profitability, Krispy Kreme’s operating margin decreased by 30.3 percentage points over the last year. This raises questions about the company’s expense base because its revenue growth should have given it leverage on its fixed costs, resulting in better economies of scale and profitability. Krispy Kreme’s performance was poor no matter how you look at it - it shows that costs were rising and it couldn’t pass them onto its customers.
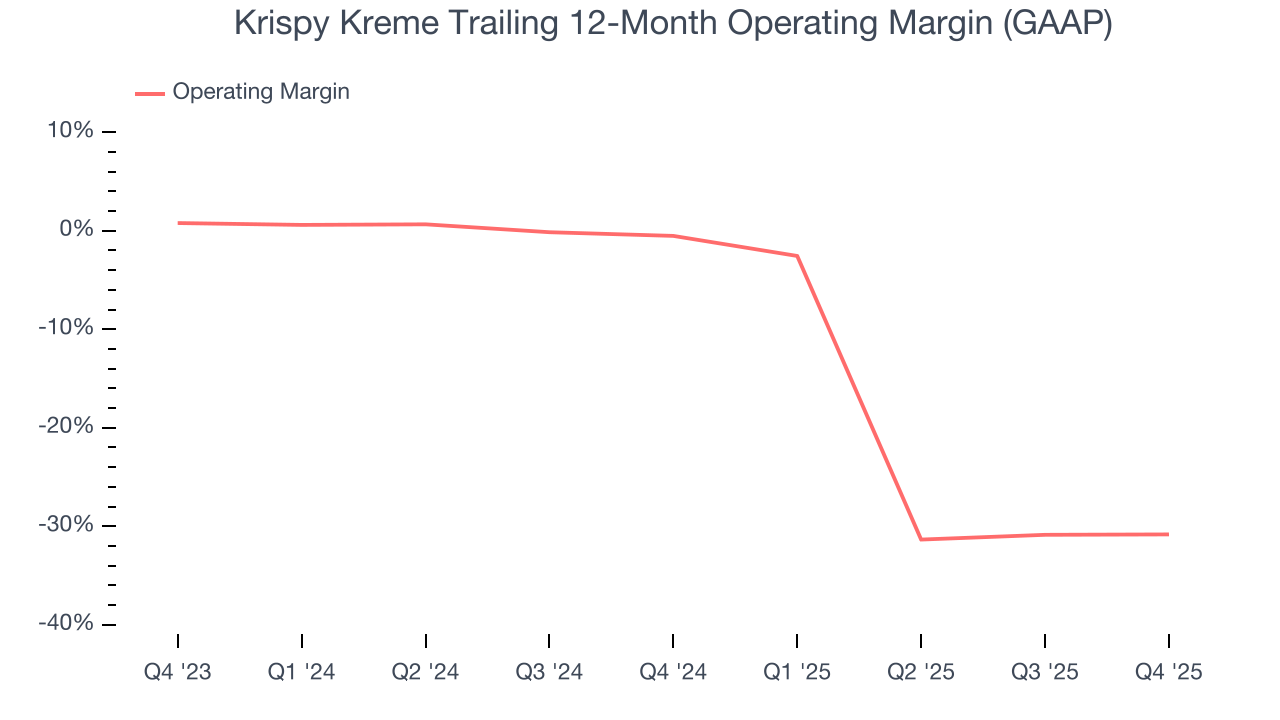
This quarter, Krispy Kreme generated a negative 1.9% operating margin.
9. Earnings Per Share
Revenue trends explain a company’s historical growth, but the long-term change in earnings per share (EPS) points to the profitability of that growth – for example, a company could inflate its sales through excessive spending on advertising and promotions.
Krispy Kreme’s full-year EPS turned negative over the last four years. We tend to steer our readers away from companies with falling EPS, especially restaurants, which are arguably some of the hardest businesses to manage because of constantly changing consumer tastes, input costs, and labor dynamics. If the tide turns unexpectedly, Krispy Kreme’s low margin of safety could leave its stock price susceptible to large downswings.
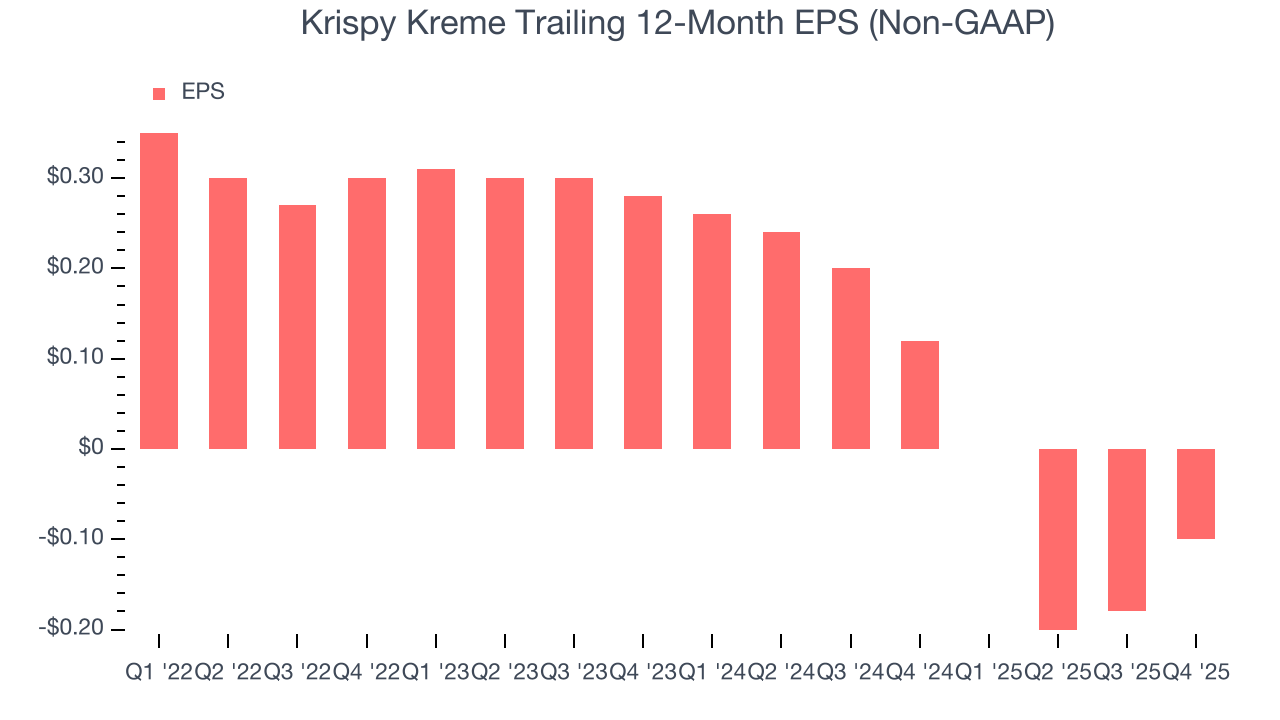
In Q4, Krispy Kreme reported adjusted EPS of $0.09, up from $0.01 in the same quarter last year. This print easily cleared analysts’ estimates, and shareholders should be content with the results. Over the next 12 months, Wall Street expects Krispy Kreme to improve its earnings losses. Analysts forecast its full-year EPS of negative $0.10 will advance to negative $0.08.
10. Cash Is King
Although earnings are undoubtedly valuable for assessing company performance, we believe cash is king because you can’t use accounting profits to pay the bills.
While Krispy Kreme posted positive free cash flow this quarter, the broader story hasn’t been so clean. Over the last two years, Krispy Kreme’s capital-intensive business model and large investments in new physical locations have drained its resources, putting it in a pinch and limiting its ability to return capital to investors. Its free cash flow margin averaged negative 4.4%, meaning it lit $4.36 of cash on fire for every $100 in revenue.
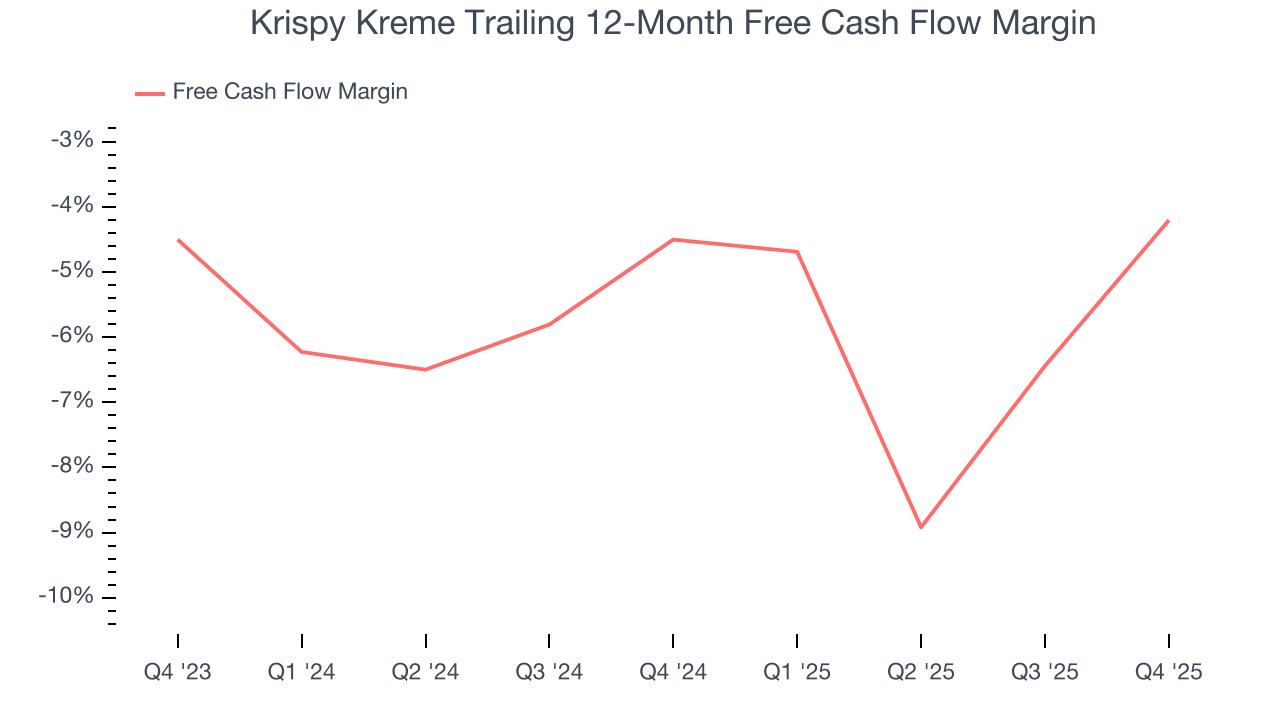
Krispy Kreme’s free cash flow clocked in at $27.93 million in Q4, equivalent to a 7.1% margin. Its cash flow turned positive after being negative in the same quarter last year, but we wouldn’t read too much into the short term because investment needs can be seasonal, leading to temporary swings. Long-term trends trump fluctuations.
11. Return on Invested Capital (ROIC)
EPS and free cash flow tell us whether a company was profitable while growing its revenue. But was it capital-efficient? A company’s ROIC explains this by showing how much operating profit it makes compared to the money it has raised (debt and equity).
Krispy Kreme’s five-year average ROIC was negative 4.6%, meaning management lost money while trying to expand the business. Its returns were among the worst in the restaurant sector.
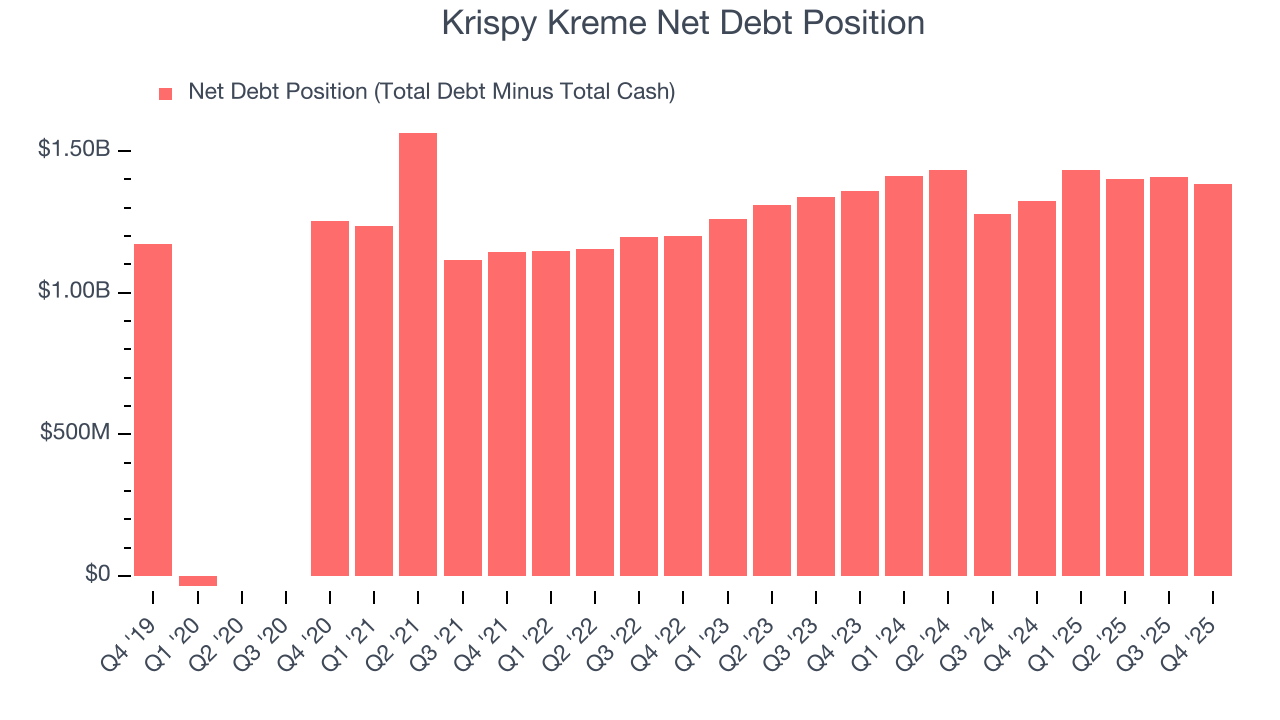
12. Balance Sheet Risk
As long-term investors, the risk we care about most is the permanent loss of capital, which can happen when a company goes bankrupt or raises money from a disadvantaged position. This is separate from short-term stock price volatility, something we are much less bothered by.
Krispy Kreme burned through $64.01 million of cash over the last year, and its $1.42 billion of debt exceeds the $42.89 million of cash on its balance sheet. This is a deal breaker for us because indebted loss-making companies spell trouble.
Unless the Krispy Kreme’s fundamentals change quickly, it might find itself in a position where it must raise capital from investors to continue operating. Whether that would be favorable is unclear because dilution is a headwind for shareholder returns.
We remain cautious of Krispy Kreme until it generates consistent free cash flow or any of its announced financing plans materialize on its balance sheet.
13. Key Takeaways from Krispy Kreme’s Q4 Results
It was good to see Krispy Kreme beat analysts’ EPS expectations this quarter. We were also excited its EBITDA outperformed Wall Street’s estimates by a wide margin. Zooming out, we think this was a solid print. The stock traded up 11.7% to $3.34 immediately after reporting.
14. Is Now The Time To Buy Krispy Kreme?
Updated: March 14, 2026 at 10:40 PM EDT
When considering an investment in Krispy Kreme, investors should account for its valuation and business qualities as well as what’s happened in the latest quarter.
Krispy Kreme falls short of our quality standards. Although its revenue growth was decent over the last six years, it’s expected to deteriorate over the next 12 months and its declining EPS over the last four years makes it a less attractive asset to the public markets. And while the company’s new restaurant openings have increased its brand equity, the downside is its relatively low ROIC suggests management has struggled to find compelling investment opportunities.
Krispy Kreme’s EV-to-EBITDA ratio based on the next 12 months is 15.2x. This valuation tells us a lot of optimism is priced in - we think other companies feature superior fundamentals at the moment.
Wall Street analysts have a consensus one-year price target of $4.17 on the company (compared to the current share price of $3.28).
Although the price target is bullish, readers should exercise caution because analysts tend to be overly optimistic. The firms they work for, often big banks, have relationships with companies that extend into fundraising, M&A advisory, and other rewarding business lines. As a result, they typically hesitate to say bad things for fear they will lose out. We at StockStory do not suffer from such conflicts of interest, so we’ll always tell it like it is.