
Green Plains (GPRE)
Green Plains is up against the odds. Not only has its sales growth been weak but also its negative returns on capital show it destroyed value.― StockStory Analyst Team
1. News
2. Summary
Why We Think Green Plains Will Underperform
Operating one of North America's largest ethanol platforms with capacity to process 310 million bushels of corn annually, Green Plains (NASDAQ:GPRE) operates ten biorefineries that convert corn into ethanol for fuel, distillers grains for animal feed, and renewable corn oil.
- Sales trends were unexciting over the last five years as its 1.4% annual growth was below the typical energy upstream and integrated energy company
- Costly operations and weak unit economics result in an inferior gross margin of 5.1% that must be offset through higher production volumes
- Responsiveness to unforeseen market trends is restricted due to its substandard EBITDA margin profitability


Green Plains’s quality doesn’t meet our bar. We’re looking for better stocks elsewhere.
Why There Are Better Opportunities Than Green Plains


At $16.44 per share, Green Plains trades at 24.8x forward P/E. This multiple is higher than most energy upstream and integrated energy companies, and we think it’s quite expensive for the weaker revenue growth you get.
There are stocks out there featuring similar valuation multiples with better fundamentals. We prefer to invest in those.
3. Green Plains (GPRE) Research Report: Q4 CY2025 Update
Biorefining company Green Plains (NASDAQ:GPRE) fell short of the market’s revenue expectations in Q4 CY2025, with sales falling 26.6% year on year to $428.8 million. Its non-GAAP loss of $0.12 per share was significantly below analysts’ consensus estimates.
Green Plains (GPRE) Q4 CY2025 Highlights:
- Revenue: $428.8 million vs analyst estimates of $580.8 million (26.6% year-on-year decline, 26.2% miss)
- Adjusted EPS: -$0.12 vs analyst estimates of $0.06 (significant miss)
- Adjusted EBITDA: $49.14 million vs analyst estimates of $35.95 million (11.5% margin, 36.7% beat)
- Operating Margin: -2.4%, up from -7% in the same quarter last year
- Free Cash Flow was $62.01 million, up from -$54.23 million in the same quarter last year
- Market Capitalization: $1.11 billion
Company Overview
Operating one of North America's largest ethanol platforms with capacity to process 310 million bushels of corn annually, Green Plains (NASDAQ:GPRE) operates ten biorefineries that convert corn into ethanol for fuel, distillers grains for animal feed, and renewable corn oil.
The company's biorefineries, located across Illinois, Indiana, Iowa, Minnesota, Nebraska, and Tennessee, use a dry mill process where corn is ground into flour, mixed with water and enzymes, and then fermented to produce ethanol. The ethanol is primarily blended into gasoline to reduce emissions and extend fuel supply. The fermentation process also yields distillers grains, a protein-rich byproduct that dairy farms and feedlots use as livestock feed, and renewable corn oil extracted from the production waste, which serves as a low-carbon feedstock for biodiesel, renewable diesel, and sustainable aviation fuel producers.
Green Plains has deployed technology to create higher-value products from the same corn input. Using its patented mechanical separation technology, the company produces Ultra-High Protein, a specialized feed ingredient with protein concentrations up to 60% that targets aquaculture markets globally while simultaneously increasing renewable corn oil yields. At its Shenandoah, Iowa facility, the company operates a corn syrup technology system that produces low-carbon glucose and dextrose for food production and as feedstock for renewable chemicals. These technologies allow the company to extract additional value from each bushel of corn beyond standard ethanol production.
The company's agribusiness segment procures corn directly from local farmers and grain elevators, operating grain storage facilities with over 20 million bushels of capacity. Its marketing arm, Green Plains Trade, sells the ethanol and co-products from its plants to integrated energy companies, fuel retailers, and international buyers in Brazil, Canada, Europe, and Asia. The company uses a fleet of approximately 2,080 leased ethanol railcars and 1,000 hopper and tank cars to transport products to distant markets, while trucks handle deliveries within 150 miles of its facilities.
Green Plains has committed seven of its biorefineries to carbon capture and sequestration projects that will capture biogenic carbon dioxide from the fermentation process and transport it via pipeline for underground storage, reducing the carbon intensity of its ethanol by more than half in some cases.
4. Mixed or Offshore Upstream E&P
This category includes smaller or niche E&P companies operating in specialized basins, geographies, or resource types outside major classifications. These firms may target unconventional resources, frontier regions, or specific commodity niches. Tailwinds include potential for outsized returns from successful exploration, acquisition opportunities during industry downturns, and specialized expertise commanding premium valuations. Headwinds include higher operational and geological risks, limited scale reducing negotiating power and cost efficiencies, and constrained capital market access during challenging commodity environments. Regulatory risks and ESG concerns may disproportionately affect smaller operators with fewer resources for compliance.
Green Plains competes with other ethanol producers including POET Biorefining (private), Archer-Daniels-Midland (NYSE:ADM), Valero Energy's ethanol division (NYSE:VLO), and Alto Ingredients (NASDAQ:ALTO).
5. Economies of Scale
In Energy, scale separates fragile single-asset producers from platform-style businesses that generate revenue across entire basins and infrastructure networks. Green Plains’s $2.09 billion of revenue in the last year lacks scale in an industry where it matters.
6. Revenue Growth
A company’s long-term performance can give signals about its business quality. Even a bad business, especially in a cyclical industry, can shine for a year or so, but a top-tier one should exhibit resilience through cycles. Regrettably, Green Plains’s sales grew at a weak 1.4% compounded annual growth rate over the last five years. This fell short of our benchmarks and is a rough starting point for our analysis.
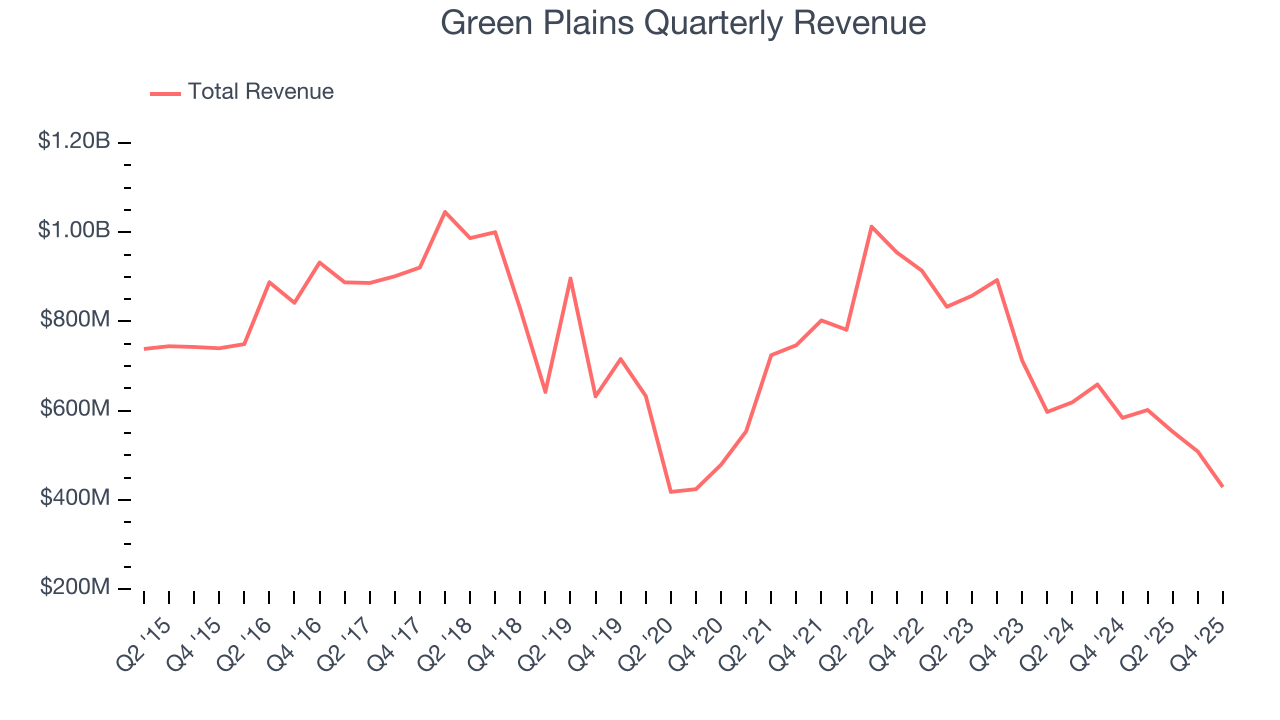
Energy cycles can be long enough that a single five-year period can still reflect one price environment, which is why an additional, decade-long view can help capture through-cycle performance. Green Plains’s performance shows it grew in the past five-year but relinquished its gains over the last ten years, as its revenue fell by 3.4% annually.
This quarter, Green Plains missed Wall Street’s estimates and reported a rather uninspiring 26.6% year-on-year revenue decline, generating $428.8 million of revenue.
7. Gross Margin
In any given year, energy gross margins are heavily influenced by prices, hedging, and cost inflation, but over a full cycle these gross margins reveal which producers are structurally advantaged through superior “rock” quality, infrastructure access, and cost position.
Green Plains, which averaged 5.1% gross margin over the last five years, exhibiting bottom-tier unit economics in the sector. It means the company will struggle at higher commodity prices than peers with better gross margins. 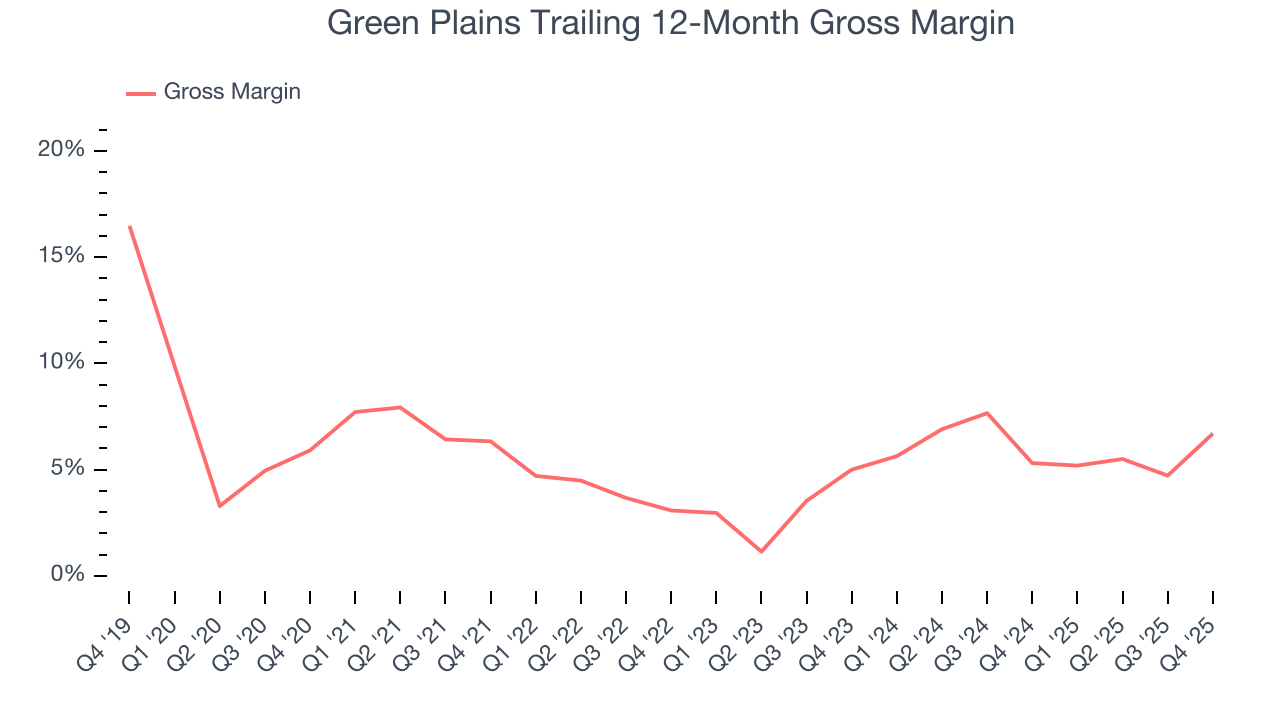
In Q4, Green Plains produced a 9.4% gross profit margin, up 8.3 percentage points year on year.
8. Adjusted EBITDA Margin
Green Plains was profitable over the last five years but held back by its large cost base. Its average EBITDA margin of 1.8% was among the worst in the energy upstream and integrated energy sector.
Looking at the trend in its profitability, Green Plains’s EBITDA margin might fluctuated slightly but has generally stayed the same over the last year, meaning it will take a fundamental shift in the business model to change.
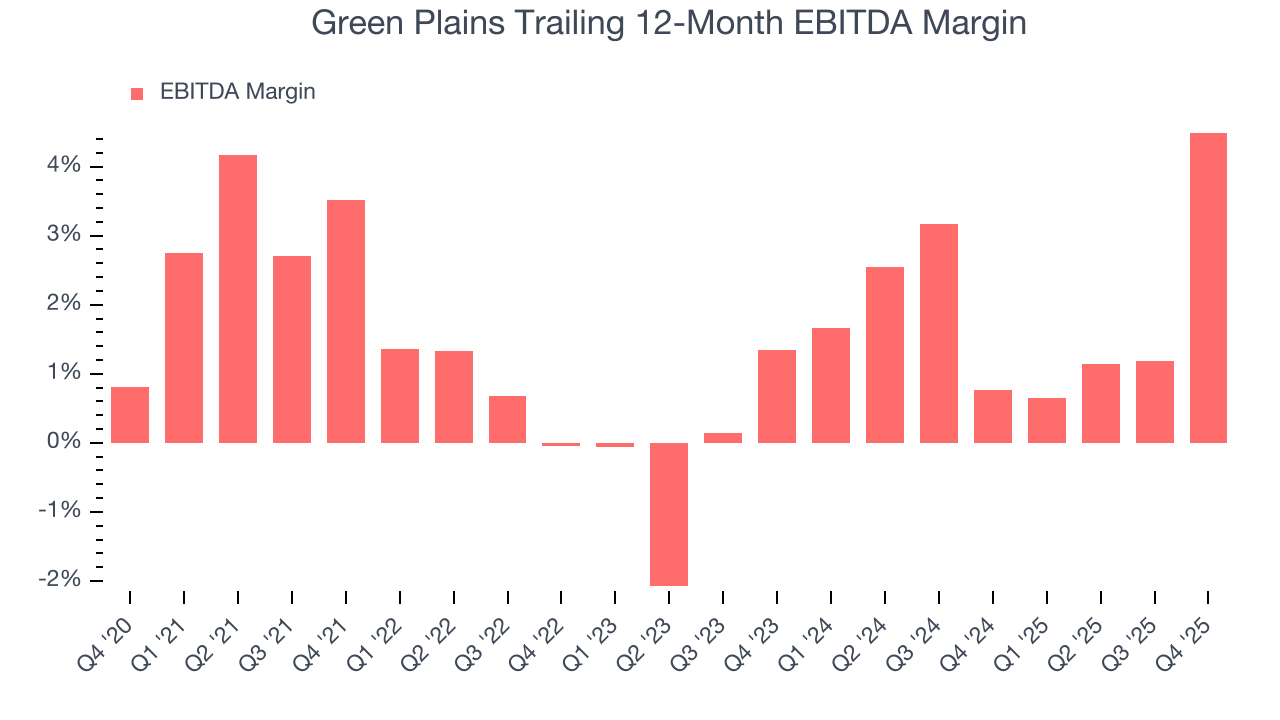
In Q4, Green Plains generated an EBITDA margin profit margin of 11.5%, up 14.6 percentage points year on year. This increase was a welcome development, especially since its revenue fell, showing it was more efficient because it scaled down its expenses. This adjusted EBITDA beat Wall Street’s estimates by 36.7%.
9. Cash Is King
Adjusted EBITDA shows how profitable a company’s existing “rock” is before financing and reinvestment, while free cash flow shows how much value remains after paying to replace those wells. Because production declines over time, strong EBITDA can coexist with weak FCF if drilling is expensive or declines are steep. FCF therefore captures both operating efficiency and the cost of sustaining production.
While Green Plains posted positive free cash flow this quarter, the broader story hasn’t been so clean. Green Plains’s demanding reinvestments have consumed many resources over the last five years, contributing to an average free cash flow margin of negative 3%. This means it lit $2.99 of cash on fire for every $100 in revenue.
The level of free cash flow is important, but its durability across cycles is just as critical. Consistent margins are far more valuable than volatile swings driven by commodity prices.
Green Plains’s ratio of quarterly free cash flow volatility to WTI crude price volatility over the past five years was 23.2 (lower is better), indicating that its cash generation is far more sensitive to commodity-price swings than most peers. This elevated volatility limits its access to capital in downturns and makes it unlikely to act as a consolidator when weaker competitors come under pressure.
You may be asking why we wait until the free cash flow line to perform this stability analysis versus commodity prices. Why not compare revenue or EBITDA to WTI in the case of Green Plains? Because what ultimately matters is not how much revenue or profit you earn when prices are high but how much cash you can generate when prices are low. Free cash flow is the superior metric because it includes everything from hedging prowess to growth and maintenance capex to management behavior during good times and bad.
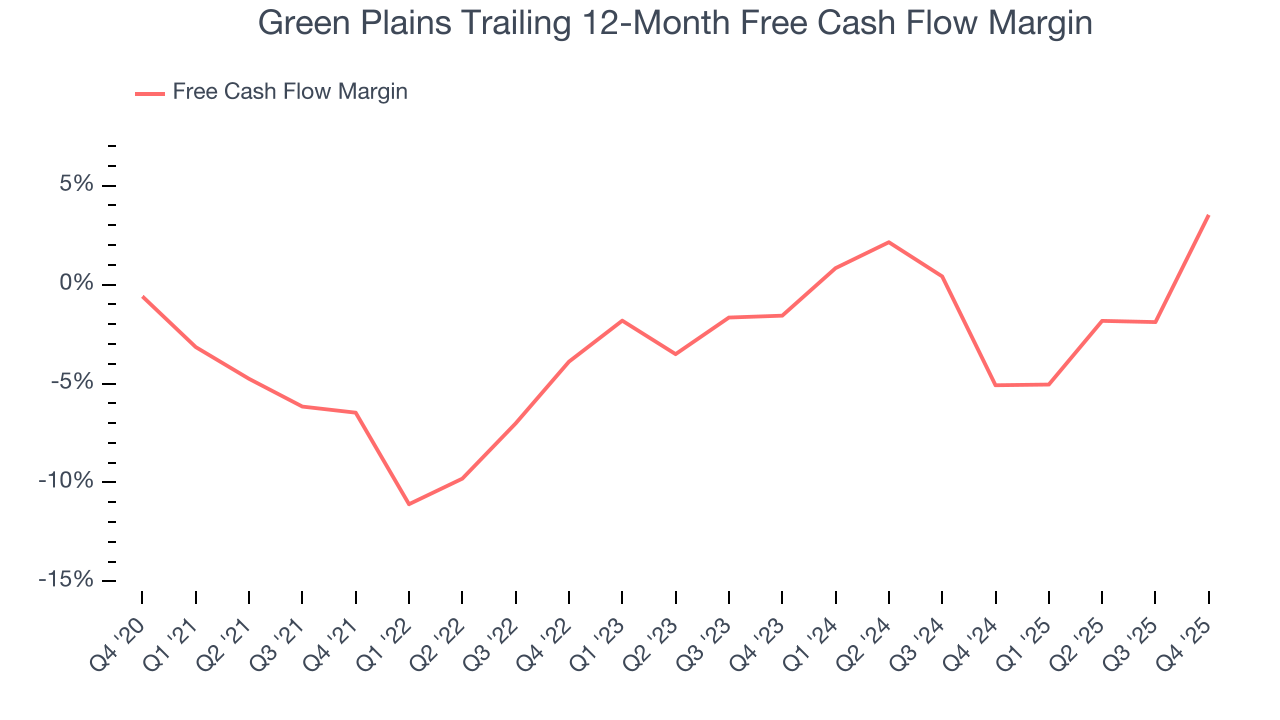
Green Plains’s free cash flow clocked in at $62.01 million in Q4, equivalent to a 14.5% margin. Its cash flow turned positive after being negative in the same quarter last year, marking a potential inflection point.
10. Return on Invested Capital (ROIC)
Free cash flow shows how much money a producer generated, while ROIC shows how efficiently that money was earned. ROIC measures the operating profit produced for each dollar of capital invested, whether from debt or equity. Cash generation measures quantity while ROIC measures the quality of value creation.
We at StockStory like to look at ROIC over a ten-year period because energy investment cycles can involve up to five years of ramping production and another five years of harvesting. A decade view captures buying, extracting, and monetizing rather than just part of that picture. Green Plains’s ten-year average ROIC was negative 1.4%, meaning management lost money while trying to expand the business. Its returns were among the worst in the energy upstream and integrated energy sector.
We like to invest in businesses with high returns, but the trend in a company’s ROIC is what often surprises the market and moves the stock price. Unfortunately, Green Plains’s ROIC has stayed the same over the last few years. If the company wants to become an investable business, it must improve its returns by generating more profitable growth.
11. Balance Sheet Assessment
Green Plains reported $230.1 million of cash and $464.7 million of debt on its balance sheet in the most recent quarter. As investors in high-quality companies, we primarily focus on two things: 1) that a company’s debt level isn’t too high and 2) that its interest payments are not excessively burdening the business.
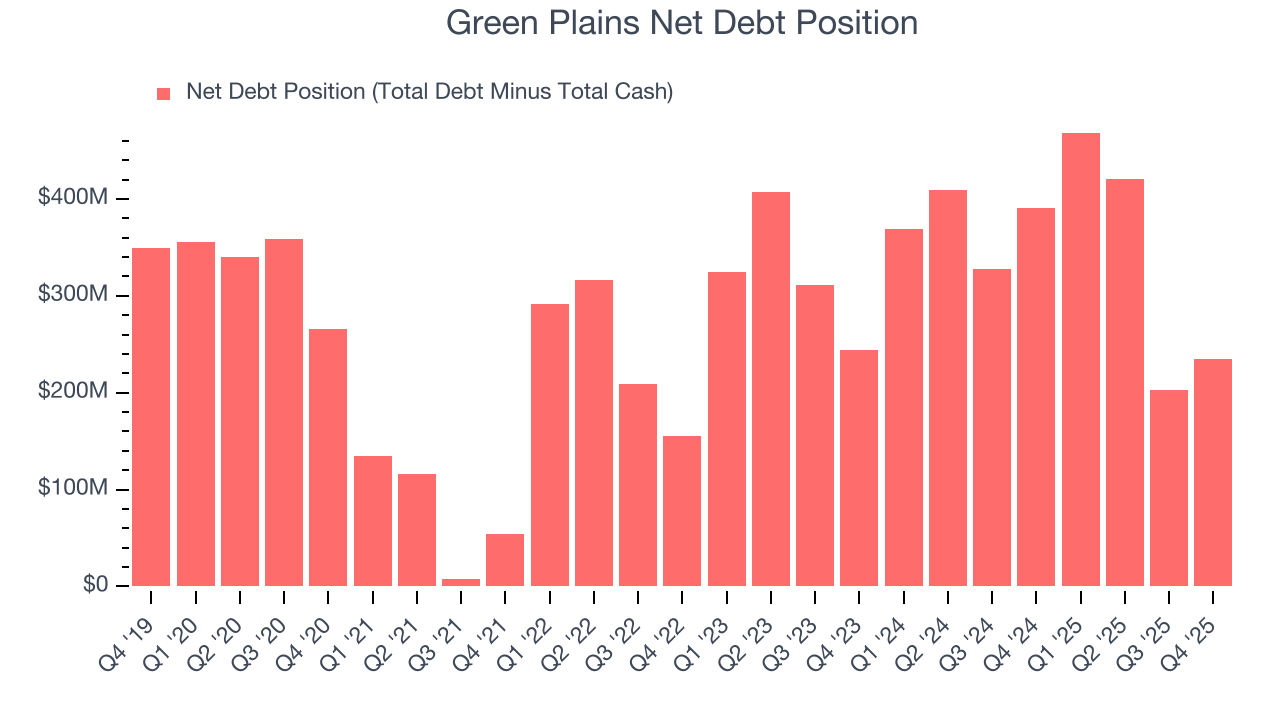
With $93.97 million of EBITDA over the last 12 months, we view Green Plains’s 2.5× net-debt-to-EBITDA ratio as safe. We also see its $72.49 million of annual interest expenses as appropriate. The company’s profits give it plenty of breathing room, allowing it to continue investing in growth initiatives.
12. Key Takeaways from Green Plains’s Q4 Results
We were impressed by how significantly Green Plains blew past analysts’ EBITDA expectations this quarter. On the other hand, its revenue missed and its EPS fell short of Wall Street’s estimates. Overall, this quarter could have been better. The stock remained flat at $14.94 immediately following the results.
13. Is Now The Time To Buy Green Plains?
Updated: March 13, 2026 at 1:09 AM EDT
The latest quarterly earnings matters, sure, but we actually think longer-term fundamentals and valuation matter more. Investors should consider all these pieces before deciding whether or not to invest in Green Plains.
We see the value of companies helping consumers, but in the case of Green Plains, we’re out. To kick things off, its revenue growth over the last five years was bottom-tier for the sector, and analysts expect its demand to deteriorate over the next 12 months. On top of that, Green Plains’s relatively low ROIC suggests management has struggled to find compelling investment opportunities, and its free cash flow volatility compared to commodity price volatility is bottom-tier in the sector, leading to highly volatile free cash flow.
Green Plains’s P/E ratio based on the next 12 months is 24.8x. This valuation tells us it’s a bit of a market darling with a lot of good news priced in - we think other companies feature superior fundamentals at the moment.
Wall Street analysts have a consensus one-year price target of $14 on the company (compared to the current share price of $16.44), implying they don’t see much short-term potential in Green Plains.