
Garrett Motion (GTX)
We’re cautious of Garrett Motion. Its weak revenue growth and gross margin show it not only lacks demand but also decent unit economics.― StockStory Analyst Team
1. News


2. Summary
Why We Think Garrett Motion Will Underperform
A key player in the transition to cleaner vehicles, Garrett Motion (NYSE:GTX) designs and manufactures turbochargers, air compressors, and electric motor technologies for vehicle manufacturers and industrial applications.
- Falling earnings per share over the last five years has some investors worried as stock prices ultimately follow EPS over the long term
- Demand will likely be weak over the next 12 months as Wall Street expects flat revenue
- A bright spot is that its ROIC punches in at 64.7%, illustrating management’s expertise in identifying profitable investments, and its returns are growing as it capitalizes on even better market opportunities


Garrett Motion is in the penalty box. We believe there are better businesses elsewhere.
Why There Are Better Opportunities Than Garrett Motion


At $18.17 per share, Garrett Motion trades at 10.5x forward P/E. Garrett Motion’s valuation may seem like a bargain, especially when stacked up against other industrials companies. We remind you that you often get what you pay for, though.
It’s better to pay up for high-quality businesses with higher long-term earnings potential rather than to buy lower-quality stocks because they appear cheap. These challenged businesses often don’t re-rate, a phenomenon known as a “value trap”.
3. Garrett Motion (GTX) Research Report: Q3 CY2025 Update
Turbocharger technology company Garrett Motion (NYSE:GTX) reported Q3 CY2025 results beating Wall Street’s revenue expectations, with sales up 9.2% year on year to $902 million. The company’s full-year revenue guidance of $3.55 billion at the midpoint came in 0.6% above analysts’ estimates. Its GAAP profit of $0.38 per share was 19.1% above analysts’ consensus estimates.
Garrett Motion (GTX) Q3 CY2025 Highlights:
- Revenue: $902 million vs analyst estimates of $866.2 million (9.2% year-on-year growth, 4.1% beat)
- EPS (GAAP): $0.38 vs analyst estimates of $0.32 (19.1% beat)
- Adjusted EBITDA: $164 million vs analyst estimates of $150.3 million (18.2% margin, 9.1% beat)
- EBITDA guidance for the full year is $630 million at the midpoint, above analyst estimates of $614.7 million
- Operating Margin: 14.4%, in line with the same quarter last year
- Free Cash Flow Margin: 10%, up from 5.7% in the same quarter last year
- Market Capitalization: $3.38 billion
Company Overview
A key player in the transition to cleaner vehicles, Garrett Motion (NYSE:GTX) designs and manufactures turbochargers, air compressors, and electric motor technologies for vehicle manufacturers and industrial applications.
The company's core business revolves around turbochargers that enhance engine performance while reducing emissions for both gasoline and diesel engines. These technologies are crucial for automakers striving to meet increasingly stringent environmental regulations while maintaining vehicle performance. Garrett's product portfolio has evolved beyond traditional turbochargers to include electric boosting systems for hybrid vehicles and specialized compressors for hydrogen fuel cell vehicles.
Garrett serves a global customer base of automotive manufacturers including BMW and Ford, who rely on its components to improve fuel economy and reduce carbon emissions. For example, an SUV manufacturer might use Garrett's variable geometry turbochargers to maintain power output while downsizing engine displacement, resulting in better fuel efficiency without sacrificing performance.
The company generates revenue primarily through direct sales to original equipment manufacturers (OEMs), with additional income from its aftermarket business serving the replacement parts market through a network of distributors. Garrett is investing heavily in electrification technologies, focusing more than half of its R&D budget on solutions for hybrid and electric vehicles, including components for thermal management and electric powertrains that leverage its expertise in high-speed motors and power electronics.
4. Electrical Systems
Like many equipment and component manufacturers, electrical systems companies are buoyed by secular trends such as connectivity and industrial automation. More specific pockets of strong demand include Internet of Things (IoT) connectivity and the 5G telecom upgrade cycle, which can benefit companies whose cables and conduits fit those needs. But like the broader industrials sector, these companies are also at the whim of economic cycles. Interest rates, for example, can greatly impact projects that drive demand for these products.
Garrett Motion competes with other turbocharger and automotive technology suppliers such as BorgWarner (NYSE:BWA), Mitsubishi Heavy Industries (TYO:7011), IHI Corporation (TYO:7013), and Continental AG (ETR:CON), particularly in the growing electric vehicle and hydrogen fuel cell components markets.
5. Revenue Growth
Reviewing a company’s long-term sales performance reveals insights into its quality. Any business can have short-term success, but a top-tier one grows for years. Regrettably, Garrett Motion’s sales grew at a sluggish 4.4% compounded annual growth rate over the last five years. This fell short of our benchmark for the industrials sector and is a rough starting point for our analysis.
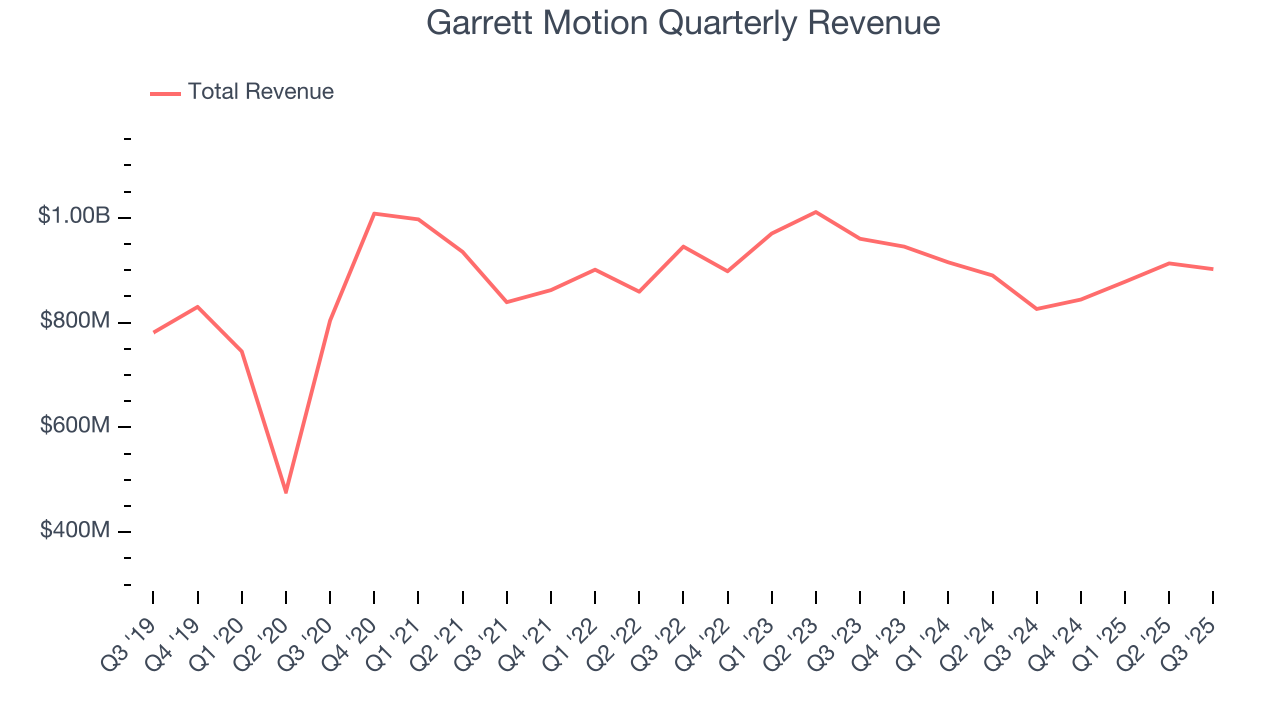
Long-term growth is the most important, but within industrials, a half-decade historical view may miss new industry trends or demand cycles. Garrett Motion’s performance shows it grew in the past but relinquished its gains over the last two years, as its revenue fell by 4% annually. 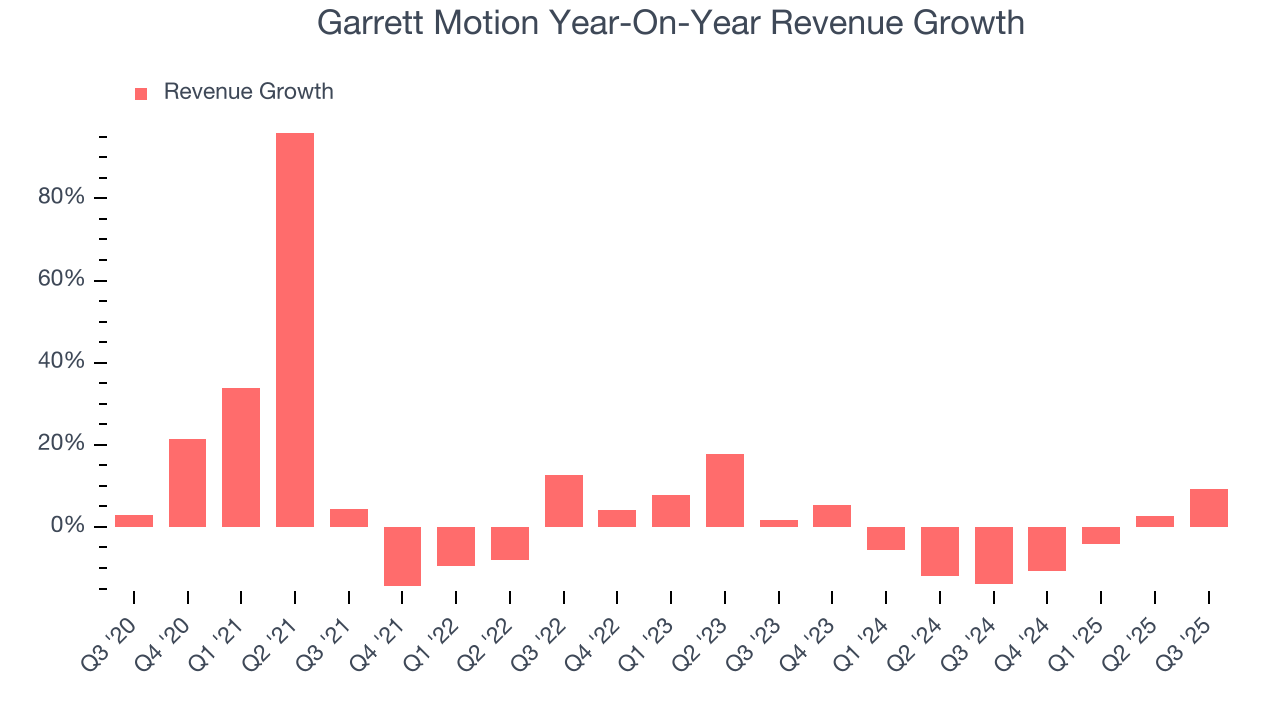
This quarter, Garrett Motion reported year-on-year revenue growth of 9.2%, and its $902 million of revenue exceeded Wall Street’s estimates by 4.1%.
Looking ahead, sell-side analysts expect revenue to remain flat over the next 12 months. Although this projection indicates its newer products and services will spur better top-line performance, it is still below the sector average.
6. Gross Margin & Pricing Power
All else equal, we prefer higher gross margins because they make it easier to generate more operating profits and indicate that a company commands pricing power by offering more differentiated products.
Garrett Motion has bad unit economics for an industrials business, signaling it operates in a competitive market. As you can see below, it averaged a 19.6% gross margin over the last five years. That means Garrett Motion paid its suppliers a lot of money ($80.39 for every $100 in revenue) to run its business. 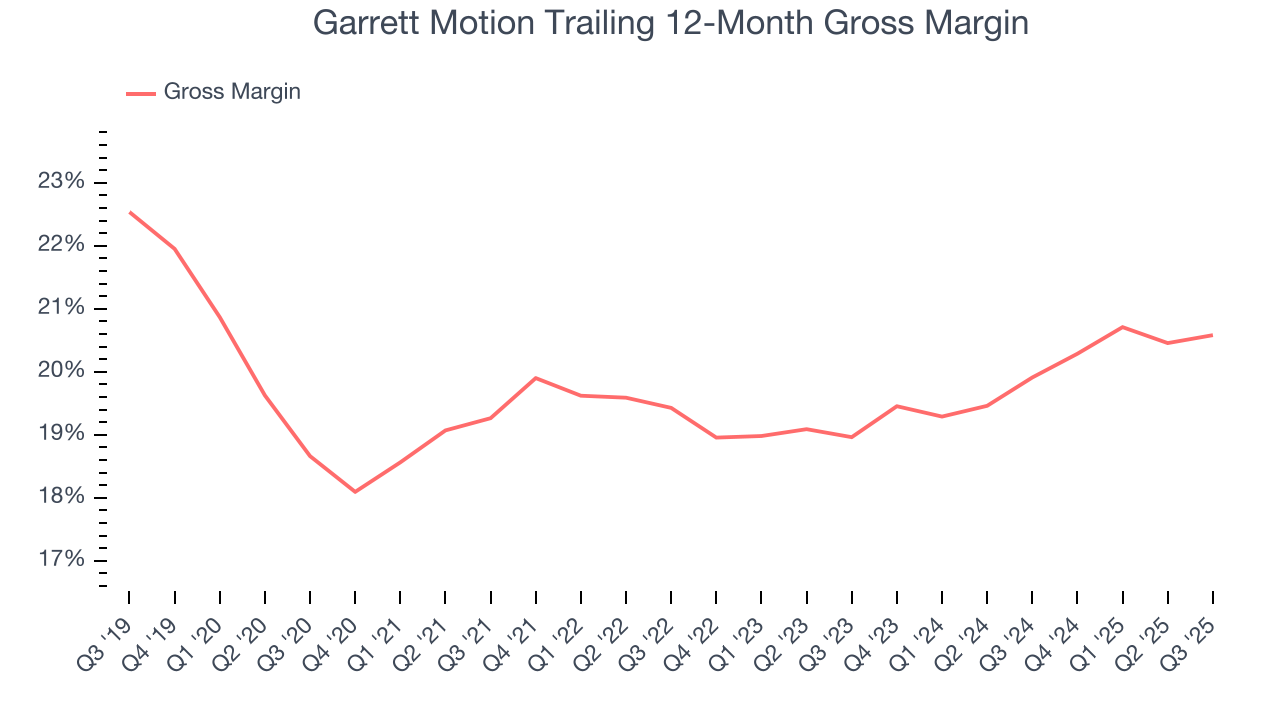
This quarter, Garrett Motion’s gross profit margin was 20.6%, in line with the same quarter last year. Zooming out, the company’s full-year margin has remained steady over the past 12 months, suggesting its input costs (such as raw materials and manufacturing expenses) have been stable and it isn’t under pressure to lower prices.
7. Operating Margin
Operating margin is a key measure of profitability. Think of it as net income - the bottom line - excluding the impact of taxes and interest on debt, which are less connected to business fundamentals.
Garrett Motion’s operating margin has risen over the last 12 months and averaged 13.6% over the last five years. On top of that, its profitability was top-notch for an industrials business, showing it’s an well-run company with an efficient cost structure. This result was particularly impressive because of its low gross margin, which is mostly a factor of what it sells and takes huge shifts to move meaningfully. Companies have more control over their operating margins, and it’s a show of well-managed operations if they’re high when gross margins are low.
Analyzing the trend in its profitability, Garrett Motion’s operating margin might fluctuated slightly but has generally stayed the same over the last five years. This raises questions about the company’s expense base because its revenue growth should have given it leverage on its fixed costs, resulting in better economies of scale and profitability.
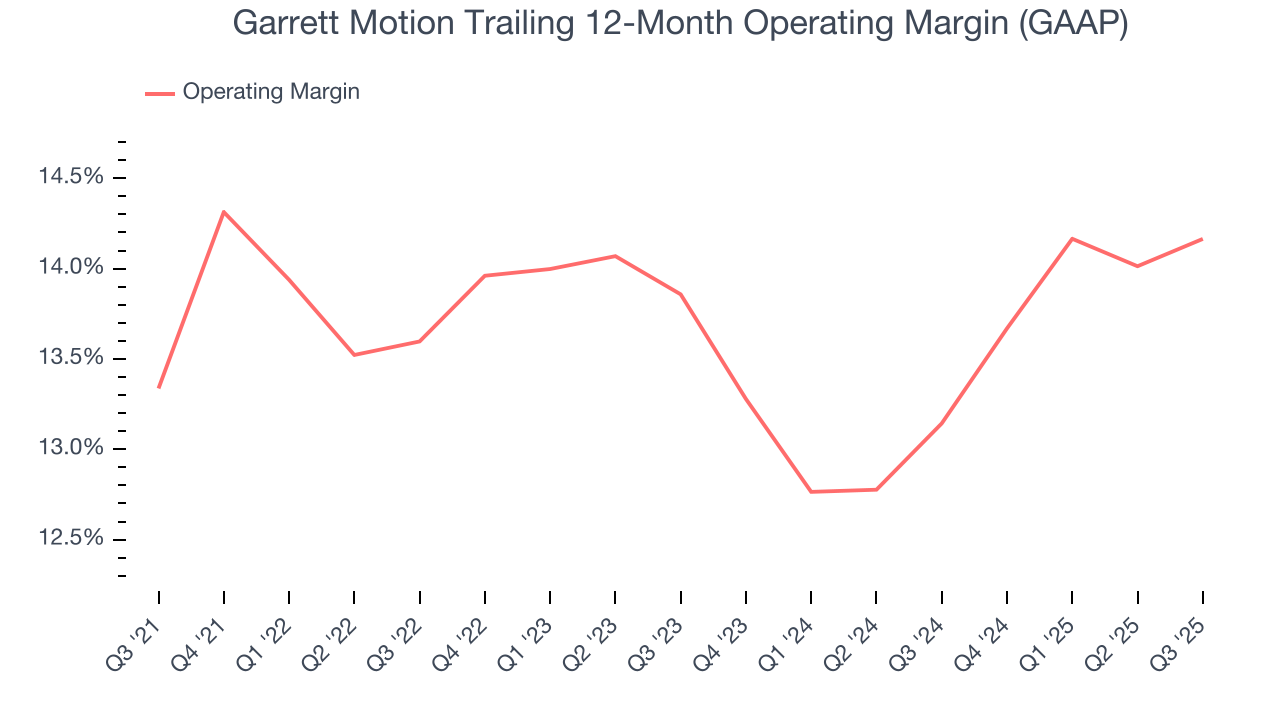
In Q3, Garrett Motion generated an operating margin profit margin of 14.4%, in line with the same quarter last year. This indicates the company’s cost structure has recently been stable.
8. Earnings Per Share
Revenue trends explain a company’s historical growth, but the long-term change in earnings per share (EPS) points to the profitability of that growth – for example, a company could inflate its sales through excessive spending on advertising and promotions.
Sadly for Garrett Motion, its EPS declined by 12.7% annually over the last five years while its revenue grew by 4.4%. However, its operating margin actually improved during this time, telling us that non-fundamental factors such as interest expenses and taxes affected its ultimate earnings.
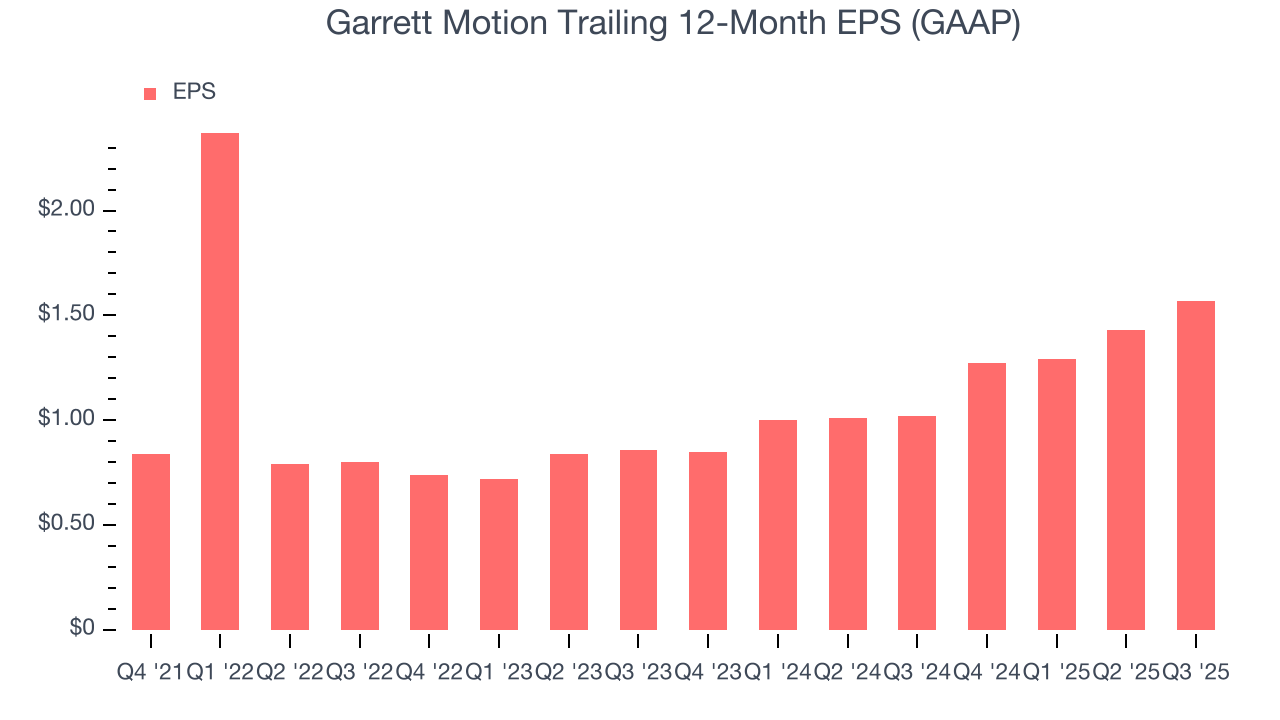
Diving into the nuances of Garrett Motion’s earnings can give us a better understanding of its performance. A five-year view shows Garrett Motion has diluted its shareholders, growing its share count by 166%. This has led to lower per share earnings. Taxes and interest expenses can also affect EPS but don’t tell us as much about a company’s fundamentals. 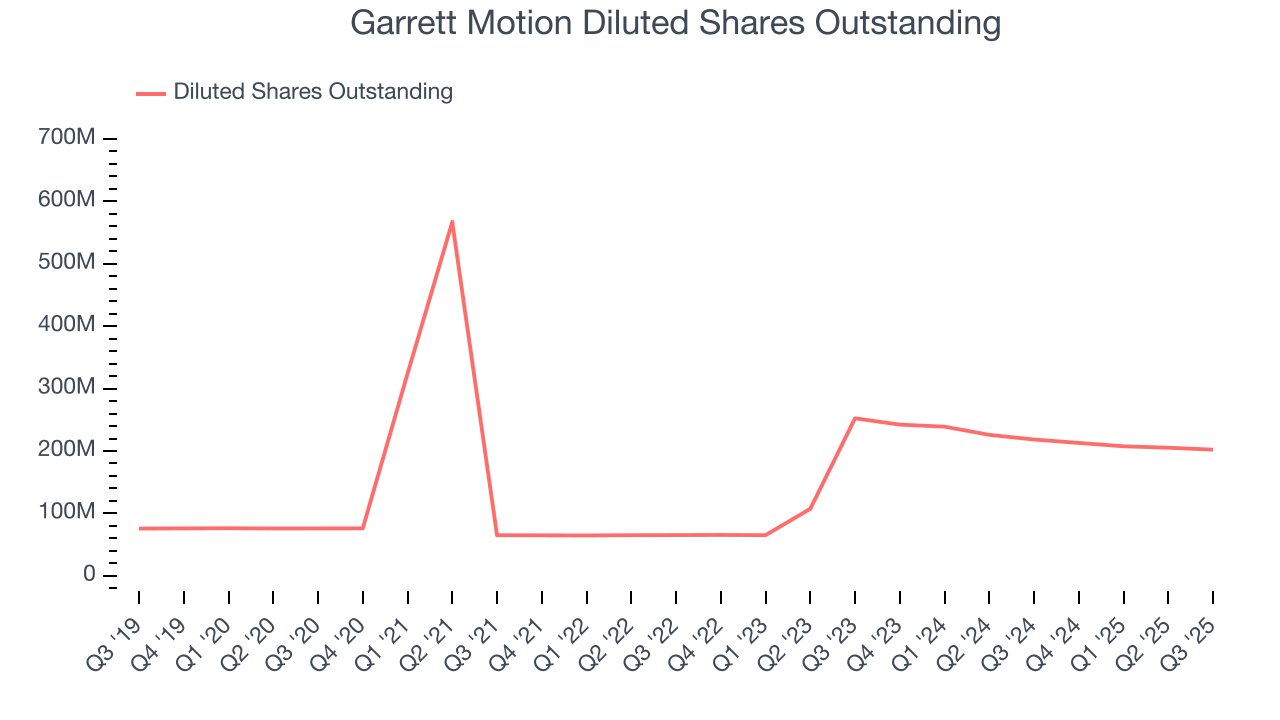
Like with revenue, we analyze EPS over a more recent period because it can provide insight into an emerging theme or development for the business.
For Garrett Motion, its two-year annual EPS growth of 35.2% was higher than its five-year trend. This acceleration made it one of the faster-growing industrials companies in recent history.
In Q3, Garrett Motion reported EPS of $0.38, up from $0.24 in the same quarter last year. This print easily cleared analysts’ estimates, and shareholders should be content with the results. Over the next 12 months, Wall Street expects Garrett Motion’s full-year EPS of $1.57 to shrink by 1.5%.
9. Cash Is King
If you’ve followed StockStory for a while, you know we emphasize free cash flow. Why, you ask? We believe that in the end, cash is king, and you can’t use accounting profits to pay the bills.
Garrett Motion has shown mediocre cash profitability over the last five years, giving the company limited opportunities to return capital to shareholders. Its free cash flow margin averaged 5.6%, subpar for an industrials business. The divergence from its good operating margin stems from its capital-intensive business model, which requires Garrett Motion to make large cash investments in working capital and capital expenditures.
Taking a step back, an encouraging sign is that Garrett Motion’s margin expanded by 20 percentage points during that time. The company’s improvement shows it’s heading in the right direction, and we can see it became a less capital-intensive business because its free cash flow profitability rose while its operating profitability was flat.
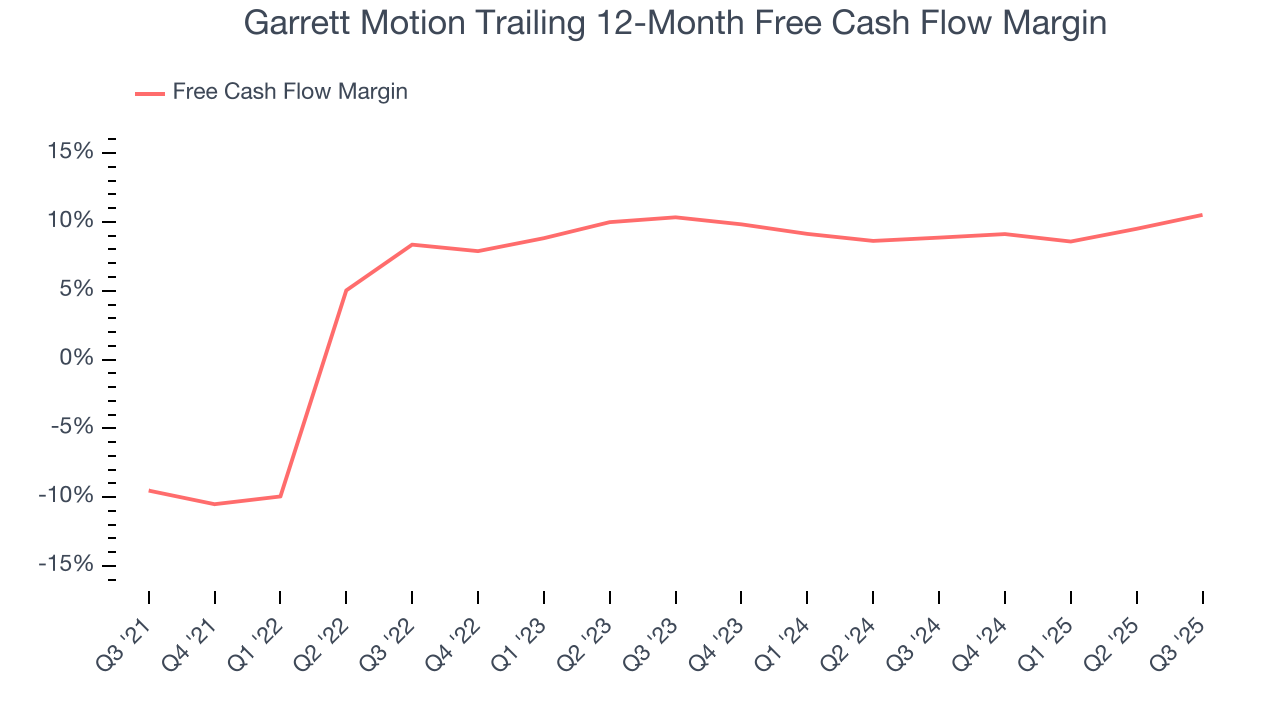
Garrett Motion’s free cash flow clocked in at $90 million in Q3, equivalent to a 10% margin. This result was good as its margin was 4.3 percentage points higher than in the same quarter last year, building on its favorable historical trend.
10. Return on Invested Capital (ROIC)
EPS and free cash flow tell us whether a company was profitable while growing its revenue. But was it capital-efficient? Enter ROIC, a metric showing how much operating profit a company generates relative to the money it has raised (debt and equity).
Although Garrett Motion hasn’t been the highest-quality company lately because of its poor revenue and EPS performance, it found a few growth initiatives in the past that worked out wonderfully. Its five-year average ROIC was 64.7%, splendid for an industrials business.
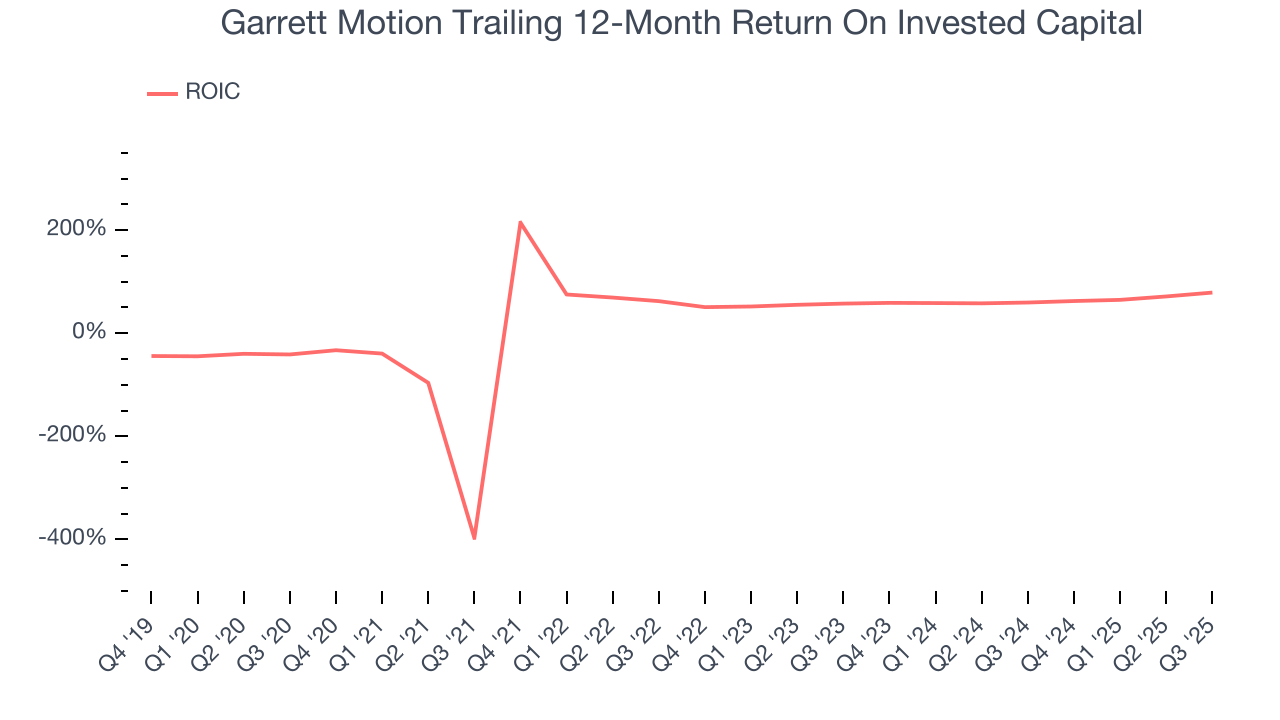
We like to invest in businesses with high returns, but the trend in a company’s ROIC is what often surprises the market and moves the stock price. Garrett Motion’s ROIC has increased over the last few years. This is a good sign, and we hope the company can keep improving.
11. Balance Sheet Assessment
Garrett Motion reported $230 million of cash and $1.5 billion of debt on its balance sheet in the most recent quarter. As investors in high-quality companies, we primarily focus on two things: 1) that a company’s debt level isn’t too high and 2) that its interest payments are not excessively burdening the business.
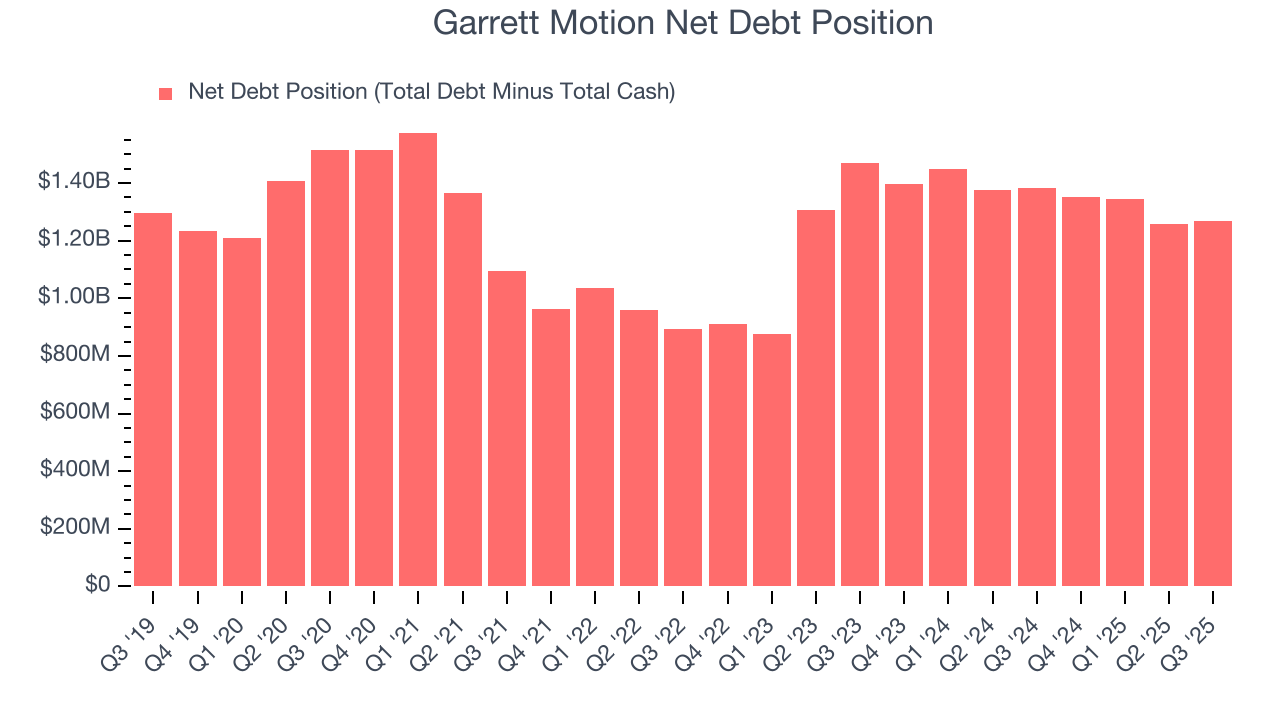
With $525 million of EBITDA over the last 12 months, we view Garrett Motion’s 2.4× net-debt-to-EBITDA ratio as safe. We also see its $106 million of annual interest expenses as appropriate. The company’s profits give it plenty of breathing room, allowing it to continue investing in growth initiatives.
12. Key Takeaways from Garrett Motion’s Q3 Results
We were impressed by how significantly Garrett Motion blew past analysts’ EBITDA expectations this quarter. We were also excited its revenue outperformed Wall Street’s estimates by a wide margin. Zooming out, we think this was a solid print. The stock traded up 3.3% to $17.96 immediately after reporting.
13. Is Now The Time To Buy Garrett Motion?
Updated: January 8, 2026 at 11:34 PM EST
We think that the latest earnings result is only one piece of the bigger puzzle. If you’re deciding whether to own Garrett Motion, you should also grasp the company’s longer-term business quality and valuation.
Garrett Motion isn’t a terrible business, but it isn’t one of our picks. To begin with, its revenue growth was uninspiring over the last five years, and analysts expect its demand to deteriorate over the next 12 months. And while its stellar ROIC suggests it has been a well-run company historically, the downside is its projected EPS for the next year is lacking. On top of that, its declining EPS over the last five years makes it a less attractive asset to the public markets.
Garrett Motion’s P/E ratio based on the next 12 months is 10.5x. While this valuation is fair, the upside isn’t great compared to the potential downside. We're fairly confident there are better stocks to buy right now.
Wall Street analysts have a consensus one-year price target of $20.80 on the company (compared to the current share price of $18.17).