
Interactive Brokers (IBKR)
Interactive Brokers is in a league of its own. Its impressive sales growth and high returns on capital tee it up for fast and profitable expansion.― StockStory Analyst Team
1. News


2. Summary
Why We Like Interactive Brokers
Founded in 1977 and known for its sophisticated trading technology and global reach across 150+ exchanges in 34 countries, Interactive Brokers (NASDAQ:IBKR) is a global electronic broker that provides low-cost trading and investment services across stocks, options, futures, forex, bonds, and other financial instruments.
- Incremental sales over the last five years have been highly profitable as its earnings per share increased by 28.8% annually, topping its revenue gains
- Balance sheet strength has increased this cycle as its 20.7% annual tangible book value per share growth over the last two years was exceptional
- Annual revenue growth of 22.8% over the past five years was outstanding, reflecting market share gains this cycle


We see a bright future for Interactive Brokers. No coincidence the stock is up 281% over the last five years.
Is Now The Time To Buy Interactive Brokers?


At $71.53 per share, Interactive Brokers trades at 30.5x forward P/E. There’s no denying that the lofty valuation means there’s much good news priced into the stock.
If you like the company and believe the bull case, we suggest making it a smaller position as our analysis shows high-quality companies outperform the market over a multi-year period regardless of valuation.
3. Interactive Brokers (IBKR) Research Report: Q4 CY2025 Update
Electronic brokerage firm Interactive Brokers (NASDAQ:IBKR) announced better-than-expected revenue in Q4 CY2025, with sales up 15.4% year on year to $1.64 billion. Its non-GAAP profit of $0.65 per share was 11% above analysts’ consensus estimates.
Interactive Brokers (IBKR) Q4 CY2025 Highlights:
- Volume: $4.04 million vs analyst estimates of $3.97 million (29.7% year-on-year growth, 2% beat)
- Revenue: $1.64 billion vs analyst estimates of $1.63 billion (15.4% year-on-year growth, 1.1% beat)
- Pre-tax Profit: $1.3 billion (79.1% margin)
- Adjusted EPS: $0.65 vs analyst estimates of $0.59 (11% beat)
- Market Capitalization: $32.67 billion
Company Overview
Founded in 1977 and known for its sophisticated trading technology and global reach across 150+ exchanges in 34 countries, Interactive Brokers (NASDAQ:IBKR) is a global electronic broker that provides low-cost trading and investment services across stocks, options, futures, forex, bonds, and other financial instruments.
Interactive Brokers serves both institutional and individual customers through its advanced electronic trading platform. The company's technology-first approach allows it to execute, clear, and settle trades globally with minimal human intervention, resulting in some of the industry's lowest commission rates and transaction costs. This efficiency has made the company particularly attractive to sophisticated and active traders who value execution speed and cost effectiveness.
The company offers multiple trading platforms tailored to different user needs, including its flagship Trader Workstation (TWS) for advanced traders, a web-based Client Portal for easier access, and mobile applications for on-the-go trading. These platforms provide tools for analyzing markets, managing risk, and executing complex trading strategies across multiple asset classes.
Beyond basic brokerage services, Interactive Brokers offers a comprehensive suite of features including margin lending, securities financing, portfolio analysis tools, and educational resources. The company's IB SmartRouting technology continuously searches for the best available prices across exchanges and automatically routes customer orders to achieve optimal execution.
Interactive Brokers generates revenue primarily through transaction-based commissions, interest on margin loans, securities lending, and foreign exchange conversion. The company offers two main service tiers: IBKR Pro for sophisticated traders seeking the lowest costs and best execution, and IBKR Lite, which provides commission-free trading on U.S. stocks and ETFs for less active traders.
A typical customer might be a day trader executing multiple currency trades daily using the company's advanced order routing technology, or an investment advisor managing client portfolios through the company's advisor-specific tools that facilitate trade allocation and reporting across multiple accounts.
4. Investment Banking & Brokerage
Investment banks and brokerages facilitate capital raises, mergers and acquisitions, and securities trading. The sector benefits from corporate activity during economic expansion, increased retail trading participation, and advisory opportunities in emerging sectors. Headwinds include economic cycle vulnerability affecting deal flow, compressed trading commissions due to electronic platforms, and regulatory capital requirements constraining certain higher-risk activities.
Interactive Brokers competes with traditional brokerages like Charles Schwab (NYSE:SCHW) and Morgan Stanley's E*TRADE (NYSE:MS), as well as newer entrants like Robinhood (NASDAQ:HOOD). In the institutional space, its competitors include Goldman Sachs (NYSE:GS), JPMorgan Chase (NYSE:JPM), and Bank of America's Merrill Lynch (NYSE:BAC).
5. Revenue Growth
A company’s long-term performance is an indicator of its overall quality. Any business can have short-term success, but a top-tier one grows for years. Thankfully, Interactive Brokers’s 22.7% annualized revenue growth over the last five years was exceptional. Its growth beat the average financials company and shows its offerings resonate with customers.
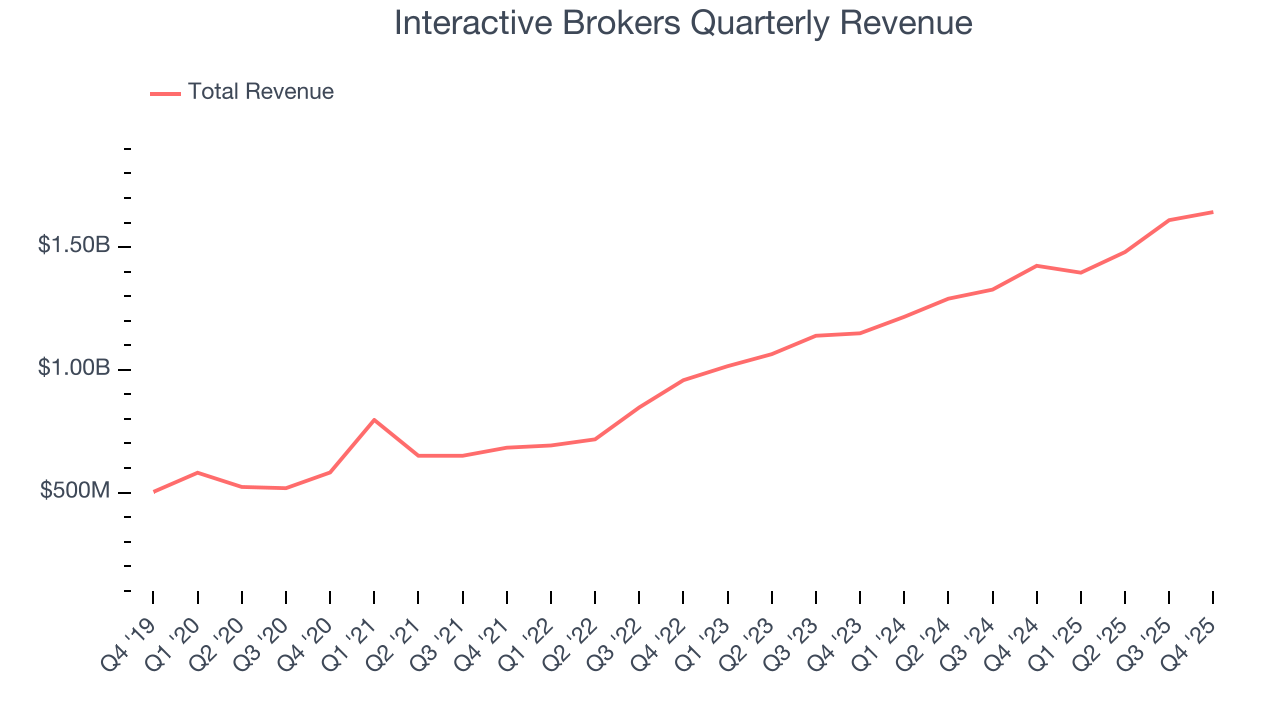
We at StockStory place the most emphasis on long-term growth, but within financials, a half-decade historical view may miss recent interest rate changes, market returns, and industry trends. Interactive Brokers’s annualized revenue growth of 18.5% over the last two years is below its five-year trend, but we still think the results suggest healthy demand. 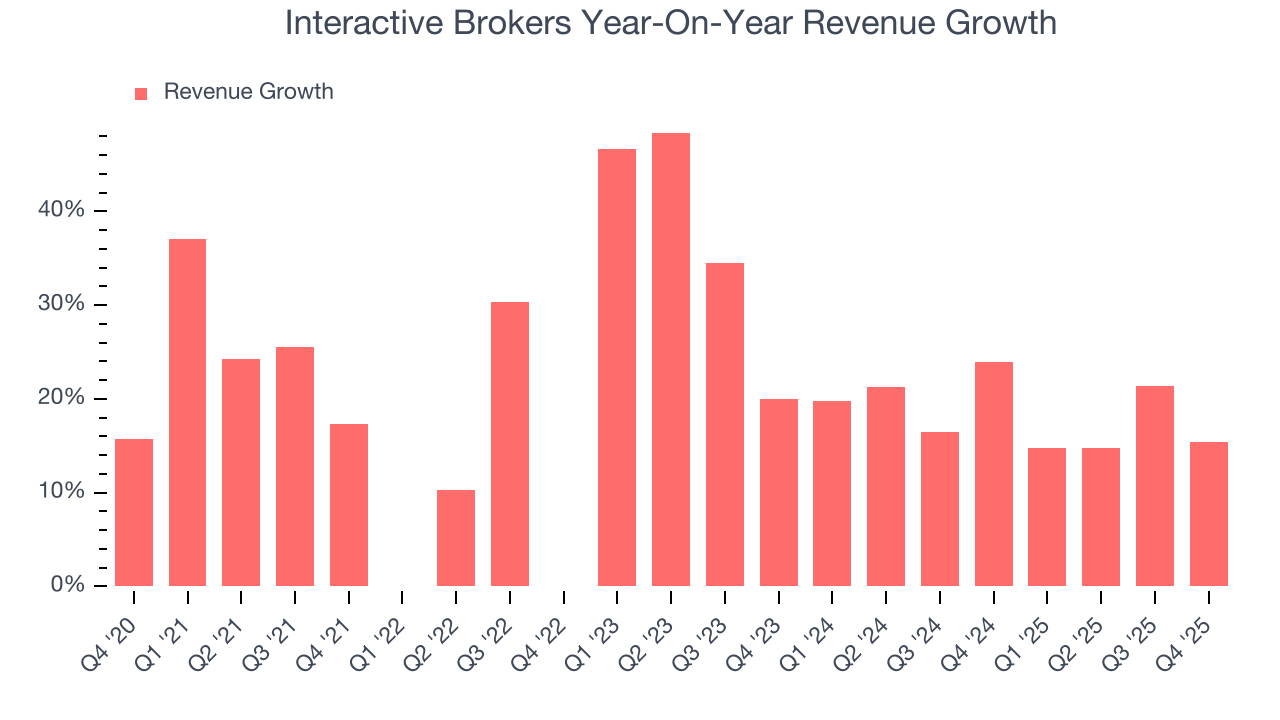 Note: Quarters not shown were determined to be outliers, impacted by outsized investment gains/losses that are not indicative of the recurring fundamentals of the business.
This quarter, Interactive Brokers reported year-on-year revenue growth of 15.4%, and its $1.64 billion of revenue exceeded Wall Street’s estimates by 1.1%.
6. Pre-Tax Profit Margin
Revenue growth is one major determinant of business quality, and the efficiency of operations is another. For Investment Banking & Brokerage companies, we look at pre-tax profit rather than the operating margin that defines sectors such as consumer, tech, and industrials.
Interest income and expenses play a big role in financial institutions' profitability, so they should be factored into the definition of profit. Taxes, however, should not as they are largely out of a company's control. This is pre-tax profit by definition.
Over the last five years, Interactive Brokers’s pre-tax profit margin has fallen by 20.9 percentage points, going from 64.3% to 77.8%. It has also expanded by 7.6 percentage points on a two-year basis, showing its expenses have consistently grown at a slower rate than revenue. This typically signals prudent management.
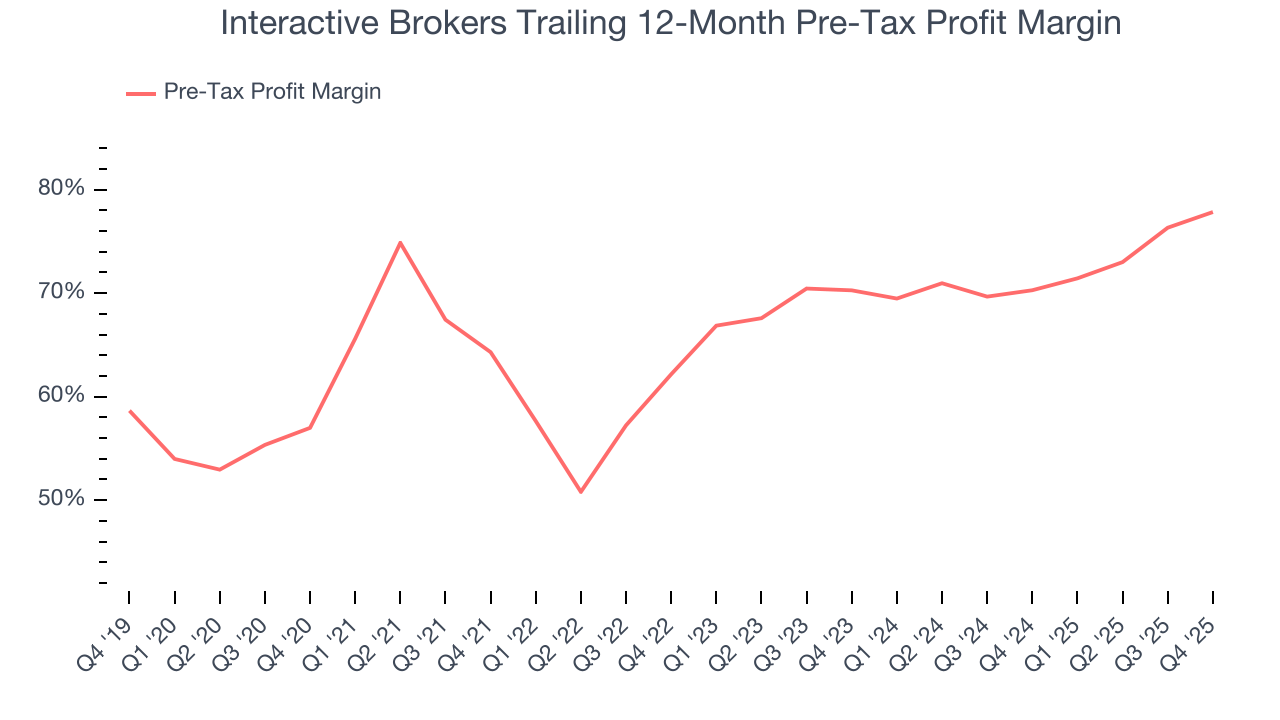
Interactive Brokers’s pre-tax profit margin came in at 79.1% this quarter. This result was 6.1 percentage points better than the same quarter last year.
7. Earnings Per Share
Revenue trends explain a company’s historical growth, but the long-term change in earnings per share (EPS) points to the profitability of that growth – for example, a company could inflate its sales through excessive spending on advertising and promotions.
Interactive Brokers’s EPS grew at an astounding 28.8% compounded annual growth rate over the last five years, higher than its 22.7% annualized revenue growth. This tells us the company became more profitable on a per-share basis as it expanded.
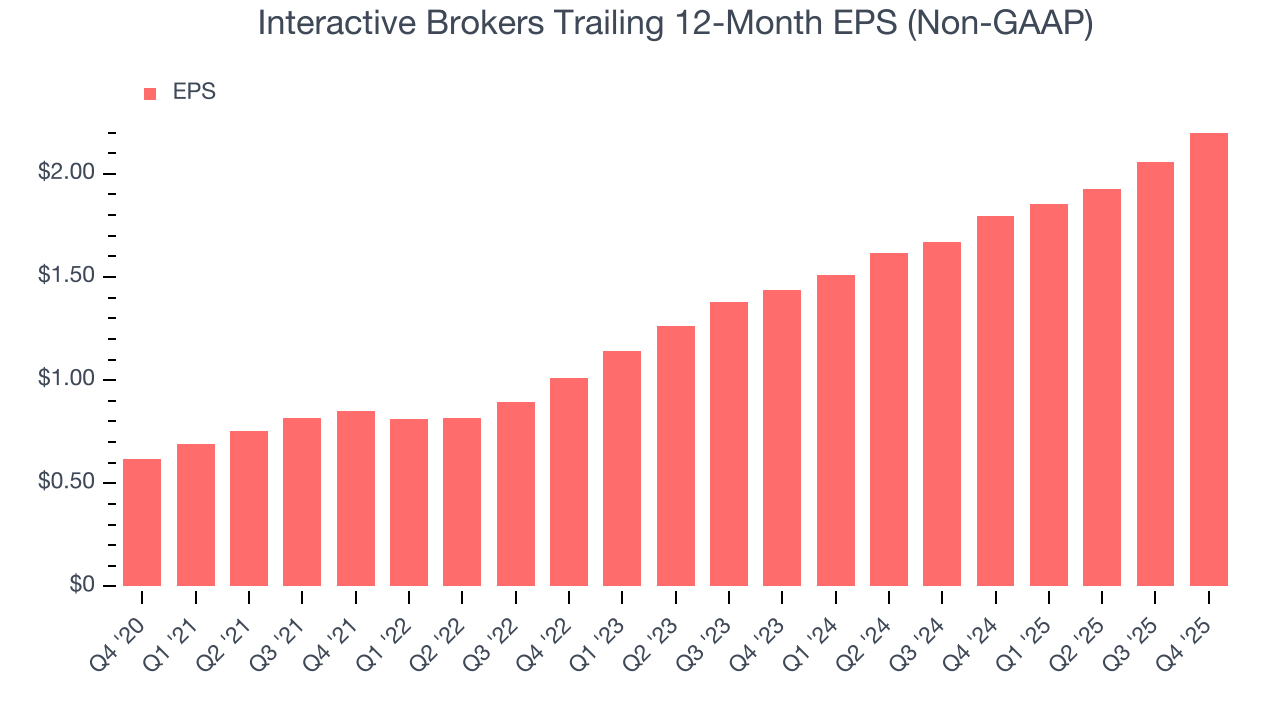
Like with revenue, we analyze EPS over a shorter period to see if we are missing a change in the business.
For Interactive Brokers, its two-year annual EPS growth of 23.8% was lower than its five-year trend. We still think its growth was good and hope it can accelerate in the future.
In Q4, Interactive Brokers reported adjusted EPS of $0.65, up from $0.51 in the same quarter last year. This print easily cleared analysts’ estimates, and shareholders should be content with the results. Over the next 12 months, Wall Street expects Interactive Brokers’s full-year EPS of $2.20 to grow 6.9%.
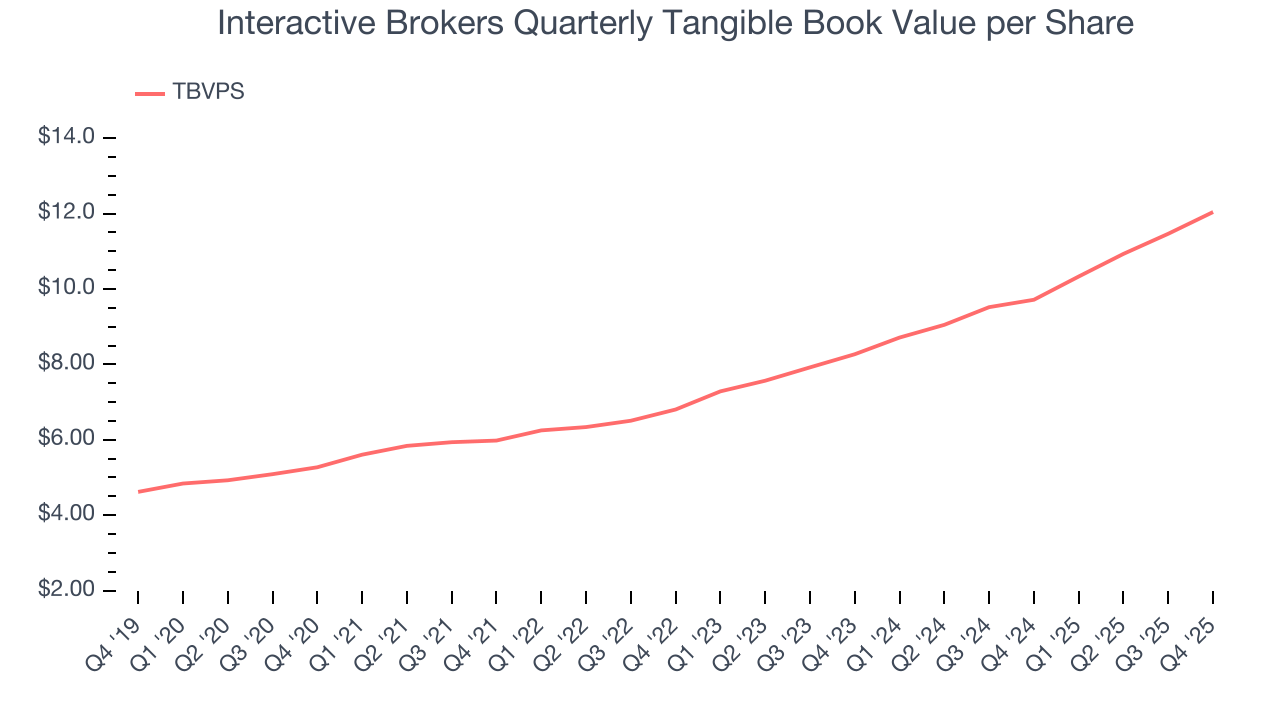
8. Tangible Book Value Per Share (TBVPS)
Financial firms profit by providing a wide range of services, making them fundamentally balance sheet-driven enterprises with multiple intermediation roles. Market participants emphasize balance sheet quality and sustained book value growth when evaluating these multifaceted institutions.
Because of this, tangible book value per share (TBVPS) emerges as the critical performance benchmark for the sector. This metric captures real, liquid net worth per share that reflects the institution’s overall financial health across all business lines. EPS can become murky due to the complexity of multiple revenue streams, acquisition impacts, or accounting flexibility across different financial services, and book value resists financial engineering manipulation.
Interactive Brokers’s TBVPS grew at an exceptional 18% annual clip over the last five years. TBVPS growth has also accelerated recently, growing by 20.7% annually over the last two years from $8.27 to $12.04 per share.
9. Return on Equity
Return on equity, or ROE, tells us how much profit a company generates for each dollar of shareholder equity, a key funding source for banks. Over a long period, banks with high ROE tend to compound shareholder wealth faster through retained earnings, buybacks, and dividends.
Over the last five years, Interactive Brokers has averaged an ROE of 20.2%, excellent for a company operating in a sector where the average shakes out around 10% and those putting up 25%+ are greatly admired. This is a bright spot for Interactive Brokers.
10. Balance Sheet Risk
The debt-to-equity ratio is a widely used measure to assess a company's balance sheet health. A higher ratio means that a business aggressively financed its growth with debt. This can result in higher earnings (if the borrowed funds are invested profitably) but also increases risk.
If debt levels are too high, there could be difficulties in meeting obligations, especially during economic downturns or periods of rising interest rates if the debt has variable-rate payments.
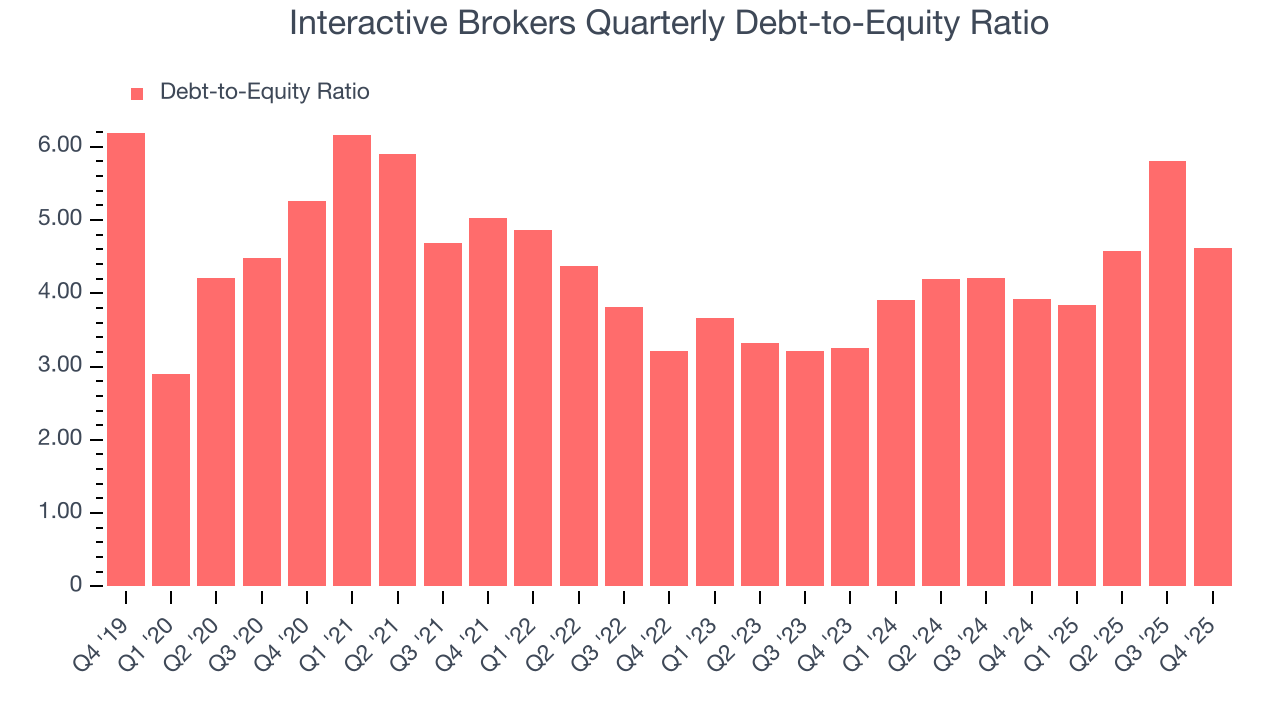
Interactive Brokers currently has $24.75 billion of debt and $5.36 billion of shareholder's equity on its balance sheet, and over the past four quarters, has averaged a debt-to-equity ratio of 4.7×. We think this is dangerous - for a financials business, anything above 3.5× raises red flags.
11. Key Takeaways from Interactive Brokers’s Q4 Results
We enjoyed seeing Interactive Brokers beat analysts’ transaction volumes expectations this quarter. We were also glad its EPS outperformed Wall Street’s estimates. Overall, we think this was a solid quarter with some key areas of upside. Investors were likely hoping for more, and shares traded down 1.9% to $70.46 immediately after reporting.
12. Is Now The Time To Buy Interactive Brokers?
Updated: February 23, 2026 at 11:58 PM EST
The latest quarterly earnings matters, sure, but we actually think longer-term fundamentals and valuation matter more. Investors should consider all these pieces before deciding whether or not to invest in Interactive Brokers.
There are multiple reasons why we think Interactive Brokers is an elite financials company. First of all, the company’s revenue growth was exceptional over the last five years. On top of that, its astounding EPS growth over the last five years shows its profits are trickling down to shareholders, and its expanding pre-tax profit margin shows the business has become more efficient.
Interactive Brokers’s P/E ratio based on the next 12 months is 30.5x. There’s some optimism reflected in this multiple, but we don’t mind owning an elite business, even if it’s slightly expensive. We’re in the camp that investments like this should be held for at least three to five years to negate the short-term price volatility that can come with relatively high valuations.
Wall Street analysts have a consensus one-year price target of $80.67 on the company (compared to the current share price of $71.53).